
Forklift Truck Market Overview
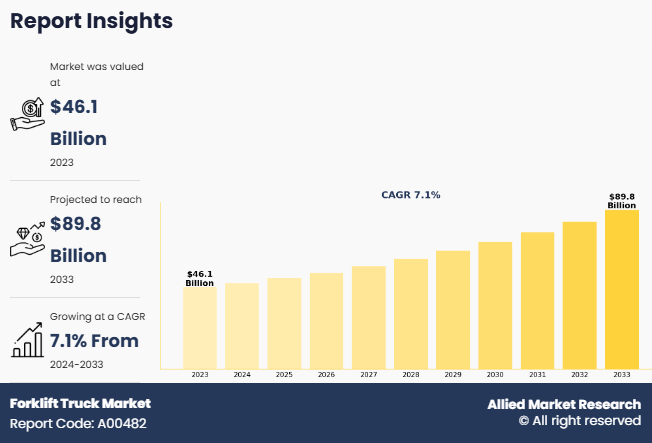
The global forklift truck market size was valued at USD 46.1 billion in 2023, and is projected to reach USD 89.8 billion by 2033, growing at a CAGR of 7.1% from 2024 to 2033. The global forklift truck market is primarily driven by the expansion of the e-commerce sector, growth in manufacturing, and rapid industrialization worldwide. On the other hand, advancements in electric vehicle technology and innovations in forklift design present promising opportunities for future growth.
Key Market Trend & Insights
- Smart Manufacturing Surge: Growth of smart factories driven by Industry 4.0, IoT, big data, and cloud integration.
- Asia-Pacific Growth Hub: Rapid manufacturing expansion in China, India, Japan, and Southeast Asia due to industrialization and low-cost labor.
- EV Industry Advancements: Lithium-ion battery adoption and EV boom are fueling electric forklift demand.
- EV Market Leaders: China, Europe, and the U.S. dominate EV sales, boosting demand for material handling solutions like forklifts.
- Electric Forklifts on the Rise: Electric-powered forklift segment expected to grow significantly.
- Demand for Compact Forklifts: Below 5-ton load capacity segment expected to witness major growth.
- Construction Sector Drives Demand: Forklift use in construction industry is growing significantly.
Market Size & Forecast
- 2033 Projected Market Size: USD 89.8 Billion
- 2023 Market Size: USD 46.1 Billion
- Compound Annual Growth Rate (CAGR) (2024-2033): 7.1%
Report Key Highlighters:
The forklift truck industry study covers 14 countries. The research includes regional and segment analysis of each country in terms of value for the projected period 2024-2033.
The study integrated high-quality data, professional opinions and analysis, and critical independent perspectives. The research approach is intended to provide a balanced view of global markets and to assist stakeholders in making educated decisions in order to achieve their most ambitious growth objectives.
Over 3,700 product literature, annual reports, industry statements, and other comparable materials from major industry participants were reviewed to gain a better understanding of the forklift truck market size.
Introduction
Forklift trucks are powerful, heavy-duty lift trucks, which are widely used to lift and transfer heavy materials, such as container goods, crates, and other such components, over a short distance. These trucks are majorly used in dockyards, warehousing operations, and recycling operations to perform functions such as loading and unloading goods from vehicles and moving packed goods around the storage area. In addition, forklift is generally powered by an electric battery or internal combustion engine.
The global forklift truck market share is driven by growth in e-commerce sector, growth of the manufacturing industry, and rapid industrialization across the globe. However, factors such as limited charging infrastructure for electric forklift and regulatory challenges hinder the growth of the market. On the contrary, growing advancement in the EV sector and increasing technological growth in the forklift industry are anticipated to offer lucrative growth opportunity for the market.
In recent years, growth in quick commerce and other e-commerce platforms due to growing smart phone adoption and technological growth in the industry, have resulted in increased inclination of consumers towards online shopping.
The e-commerce industry is particularly growing at a faster pace in developing region especially India, Brazil, Mexico, and other countries located in Southeast Asia. The growth of e-commerce industry in these region is majorly due to strong economic growth and increase in disposable income among consumers.
For instance, according to a data published by Invest India, a National Investment Promotion and Facilitation Agency of the Government of India, announced that the internet subscribers in India as of September 2024, accounted for over 969 million, and the number of telephone subscribers as of August 2024 accounted for 1200 Mn. The e-commerce industry in India is witnessing strong growth rate primarily due to increased smartphone penetration, and low data prices, thus driving the e-commerce industry . According to the agency, the country has an active 950 million internet users, and India is the 2nd largest internet market in the world. Similar to India, other major developing countries around the world are also experiencing increase in smartphone and internet penetration, thus facilitating the growth of the e-commerce industry. The growth of e-commerce industry is increasing the number of warehouses, distribution centers, logistics hubs in these countries, further driving the demand for forklift truck market forecast.
Key Developments
Leading companies are adopting strategies such as acquisition, agreement, expansion, partnership, contracts, and product launches to strengthen their market position.
On September 3, 2024 Mitsubishi Heavy Industries, Ltd. and Mitsubishi Logisnext Co., Ltd. announced that they have jointly exhibited autonomous and intelligent warehouse logistics solution at Logis-Tech Tokyo 2024. It also showcased next generation of forklift for automated truck cargo handling. Moreover, it also exhibited lithium-ion battery-powered small forklift trucks developed to reduce environmental footprints.
On September 5, 2024, Toyota Material Handling Japan, a division of Toyota Industries Corporation announced its strategic investment initiative in Gideon a Croatia based industrial automation company for new vision based automated vehicle solutions. In addition, Gideon develops and offers modern technologies for autonomous mobile robotics for automating specific processes in warehouse and manufacturing environments. The strategic partnership and investment are forecast to create possibilities to simplify automated vehicle systems through standardization, reduced deployment times and increasing flexibility, adaptability, and scalability.
On September 13, 2022, Toyota Material Handling Japan, a division of Toyota Industries Corporation announced the development of its first autonomous lift truck, which is equipped with AI based technology. The new forklift truck can automatically recognize the location and position of other trucks and further load and generate automated travel routes to perform loading operations.The truck was showcased in Logis-Tech Tokyo 2022. The company also announced that it is expanding its product lineup for logistics automation vehicles specifically for indoors environment such as warehouses. The newly developed autonomous lift truck is equipped with 3D-LiDAR, pallet location and position detection technology, which have the ability to automatically detect and analyze travel routes.
Market Segmentation
The fork lift market is segmented into power source, class, load capacity, end user, and region. On the basis of power source, the market is segregated into ICE powered, and electric powered. Based on class, the market is segmented into class 1, class 2, class 3, class 4, class 5, and others. On the basis of load capacity, the market is segregated into below 5 ton, 5-15 ton, and above 16 ton. By end user, the market is analyzed into industrial, construction, and manufacturing. Region-wise, the market is analyzed across North America, Europe, Asia-Pacific, Middle East and Africa, and Latin America.
By Power Source
By power source, the fork lift market has been segmented into ICE powered, and electric powered. The ICE powered segment accounted for the largest market share in 2023, as ICE forklifts are well-suited for handling heavy loads and long operations. Similarly, ICE powertrain forklifts are capable of handling more load and can perform in extreme environment. In addition, ICE forklifts are majorly used in industries such as construction, manufacturing, and logistics, where large and heavy materials need to be moved regularly. Furthermore, ICE forklifts often have a low upfront cost and are easier to maintain, especially in regions where there is limited access to charging infrastructure.

By Class
Based on class, the class 4 segment dominated the global forklift truck market demand in 2023, as they are equipped with internal combustion engine and cushion tires, which are ideal for smooth, indoor surfaces such as warehouses and distribution centers. Also, class 4 forklift can navigate through tight spaces, owning to their smaller turning radius as compared to other pneumatic tire forklifts. Moreover, class 4 forklifts are robust and can withstand heavy loads, making them suitable for industries such as manufacturing, construction, retail, and logistics.

By Load Capacity
On the basis of load capacity, the 5-15 ton segment dominated the global market share in 2023, as 5-15 ton range of forklifts are essential for use in industries that handle large and heavy load in construction and material, ports and logistics, manufacturing, construction, mining, and others. In addition, the 5-15 ton segment offers flexible configuration of attachments such as side shifters, clamps, or telescoping forks, making them adaptable to specific tasks.

By End User
Based on end user, the manufacturing segment dominated the global market share in 2023, as they help to streamline material handling processes, and improve operational efficiency in manufacturing industry. Forklift trucks are also used in transporting raw materials and help move raw materials from storage areas to production lines quickly and safely. In addition, forklifts are used in transportation of finished goods to warehouses or shipping areas for distribution from the manufacturing facility.

By Region
Region-wise, the market is analyzed across North America, Europe, Asia-Pacific, Middle East and Africa, and Latin America. The Asia-Pacific region dominated the global market share owning to the strong growth in the industrial, and logistics industry in the region. . Countries such as China, India, Japan, South Korea, and Southeast Asian nations are key manufacturing hubs for industries such as electronics, automotive, textiles, and machinery. Moreover, high import and export volumes in the region are further driving the demand for forklift trucks in the region.

Which are the Top Forklift Truck companies
The following are the leading companies in the market. These players have adopted various strategies to increase their market penetration and strengthen their position in the forklift truck industry.
Toyota Industries Corporation
Mitsubishi Forklift Trucks
Caterpillar
Godrej & Boyce Mfg. Co. Ltd.
Hyundai Material Handling
Anhui Heli Co., Ltd.
Komatsu
Clark Equipment
Crown Equipment Corporation
Jungheinrich AG
What are the Top Impacting Factors
Key Market Driver
Growth of Manufacturing Industry
In recent years, the manufacturing sector has seen remarkable growth owing to growth in globalization, technological advancements, and increase in consumer demand for consumers products. In addition, advancement in technology such as industry 4.0 and integration with big data, cloud computing and internet of things has helped in the development of smart factories.
The manufacturing industry is growing at a faster pace in Asia-Pacific as compared to other regions , especially in countries such as China, India, Japan, and South Korea, particularly in industries such as electronics, textile, and automotive manufacturing . Rapid industrialization and availability of low-cost labor in Southeast Asia, including countries like Vietnam and Indonesia, have further bolstered the region manufacturing industry.
According to data published by the United Nation Industrial Development Organization, global manufacturing output witnessed significant growth in the second quarter of 2024. According to the data, the global industrial output increased by 1% in quarter-over-quarter comparison, following stalled production in the previous quarter.The data also showcased that the manufacturing industry faced several challenges such as a high rate of inflation, volatile energy prices, supply chain disruptions and the growth of regional conflicts.
Growing Advancement in the EV Industry
Rapid advancement in the EV industry is driving the market for forklift truck industry. Rapid advancement in the electric vehicle battery such as use of lithium-ion batteries, as compared to traditional lead-acid batteries in forklifts, allows in faster charging, and higher energy density. The advancement in the EV industry and increase use of modern technologies are driving the demand for electric forklifts. According to the International Energy Agency, as of 2022, the electric vehicle segment sales were around 10 million. According to the data, the sales of EVs have more than tripled in the last three years from 2019-2021. Similarly, the share of EV, which was 4% in 2020, reached around 14% in 2022.
Three markets dominate the market globally that include China, Europe, and the U.S. China alone accounted for a major share of global EV sales in 2022. Europe was the second largest market in 2022. The sales of EV increased by 15% in the region due to strong government support and technology development. EV sales in the U.S. increased by over 55% in 2022. In the first quarter of 2023, EV car sales reached 2.3 million, accounting for 25% more as compared to 2022.
Key Benefits for Stakeholders
This report provides a quantitative analysis of the market segments, current trends, estimations, and dynamics of the forklift truck market analysis from 2023 to 2033 to identify the prevailing forklift truck market opportunity
The market research is offered along with information related to key drivers, restraints, and opportunities.
Porter's five forces analysis highlights the potency of buyers and suppliers to enable stakeholders make profit-oriented business decisions and strengthen their supplier-buyer network.
In-depth analysis of the market segmentation assists to determine the prevailing market opportunities.
Major countries in each region are mapped according to their revenue contribution to the global market.
Market player positioning facilitates benchmarking and provides a clear understanding of the present position of the market players.
The report includes the analysis of the regional as well as global forklift truck market trends, key players, market segments, application areas, and market growth strategies.
Forklift Truck Market Report Highlights
| Aspects | Details |
| Market Size By 2033 | USD 89.8 billion |
| Growth Rate | CAGR of 7.1% |
| Forecast period | 2023 - 2033 |
| Report Pages | 280 |
| By Power Source |
|
| By Class |
|
| By Load Capacity |
|
| By End User |
|
| By Region |
|
| Key Market Players | Hyundai Material Handling, Caterpillar Inc., Godrej & Boyce Mfg. Co. Ltd., Toyota Industries Corporation, Komatsu, Anhui Heli Co., Ltd., Crown Equipment Corporation, clark equipment, Mitsubishi Forklift Trucks, Jungheinrich AG |
Analyst Review
The forklift truck market is in its growth stage; however, its contribution to the global market is expected to increase significantly within the next seven years. Recent innovations, which incorporate high efficiency and accuracy in warehouses/e-business, enable the technology to reach a wider segment of the audience. Numerous players are entering this market with innovative products. Emerging technology, such as development of electric forklift trucks and lithium-ion battery forklift trucks, is expected to increase the competition in the future.
Ongoing advancements in forklift trucks owing to innovative efforts have further enhanced the efficiency of these trucks. The competitive advantages of electric forklift trucks over IC engine forklift truck alternatives are described in the report. Rise in adoption of forklift trucks in warehouse spaces drives the market growth. Forklift trucks are used in warehousing area to move goods and place heavy pallets into the pallet rack. Warehouses for different sectors such as automotive & food industry are increasing at a notable rate, thereby resulting in high demand for forklift trucks. Therefore, increase in demand for electric forklift truck and strong government support are projected to propel the market growth ahead as well.
Increase use of electric powertrain is the upcoming trend in the global forklift truck market.
The manufacturing segment is the leading application of the forklift truck market.
Asia-Pacific is the largest region for forklift truck market.
The global forklift truck industry was valued at $46.13 billion in 2023.
Toyota Industries Corporation, Mitsubishi Forklift Trucks, Caterpillar, and Anhui Heli Co., Ltd. are some of the major companies operating in the market.
Loading Table Of Content...
Loading Research Methodology...

