0
2019
Frozen Bakery Products Market

Frozen Bakery Products Market

by Product (Breads, Pizza Crust, Cakes & Pastries, Waffles, Donuts, and Cookies), Source (Corn, Wheat, Barley, and Rye), End Use (Retail, Food Service Industry, and Food Processing Industry), and Distribution Channel (Artisan Baker, Retail, Catering, and Online Channel): Global Opportunity Analysis and Industry Forecast, 2018 - 2025

Report Code: A04817
Feb 2019 | Pages: 236
Tables: 112
Charts: 46
  • Formats*:

  • pdf

    Single User License, Five User
    License & Enterprise User License

  • xls

    Data Pack Excel License

  • ppt

    It comes with the additional cost
    of $2500.00 contact sales.


COVID-19

Pandemic disrupted the entire world and affected many industries.

Get detailed COVID-19 impact analysis on the Frozen Bakery Products Market

Request Now !

Frozen Bakery Products Market Overview:

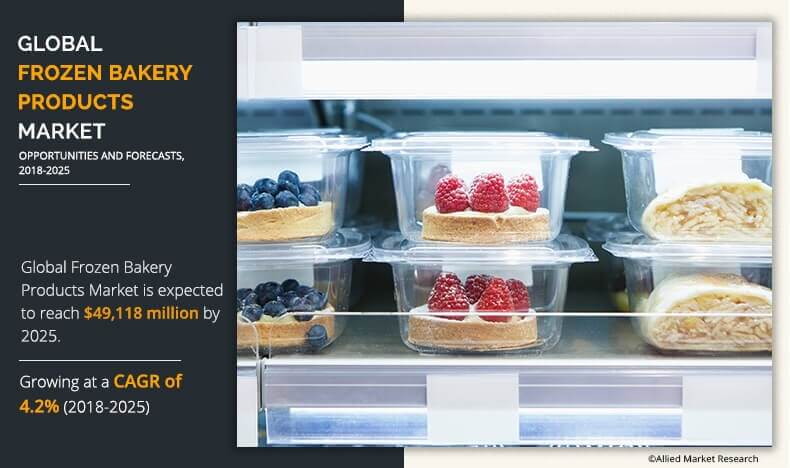
The global frozen bakery products market was valued at $33,870 million in 2017 and is projected to reach $49,118 million by 2025, growing at a CAGR of 4.2% from 2018 to 2025.
Frozen bakery products market includes bread, cakes, pastries, and donuts, which are derived from corn, rice, wheat, barley, oats, and rye. The consumption of these sources being used as the raw materials for bakery product varies across the world. These are rich in nutrition and taste, exhibit comparatively longer shelf life, and are convenient to use, which drive the demand for these products in the market. Frozen bakery products are usually sold in various stores, cafes, and restaurants. The overall key parameters responsible for the growth of the market, signifies positive signs for frozen bakery products market forecast.


The consumers desirability for convenience in having food products is one of the major factors that drives the growth of the global frozen bakery products market. Convenience factor is important for the consumer even when it comes to food consumption as it helps to cut down the time for daily chores. Thus, frozen food products gain importance among the target customers. Over the past couple of years, there has been a rise in demand for various types of frozen food products, which is attributable to the various health benefits associated with the product. Frozen food products are packed with nutrients and exhibit a longer shelf life. This increases the demand for various types of frozen food products simultaneously paving path of opportunity for global frozen bakery products market to grow. As a result, different food manufacturers strategize on coming up with such products that cater to the needs of its customers. As a result, convenience factor is being considered as one of the most influential frozen bakery products market trends.

A large portion of the population from various demographic segments have been following a healthy diet plan, due to rise in awareness on various benefits associated with the adoption of healthy lifestyle. Consumers have been looking out for food products that are rich in nutrition and promote other such health benefits. Frozen food products have a characteristic feature of preserving its nutrition content for a longer period. As a result, with the rise in trend on food fortification, frozen bakery products industry sights opportunity in gaining traction among the health-conscious customer and simultaneously generating sales.


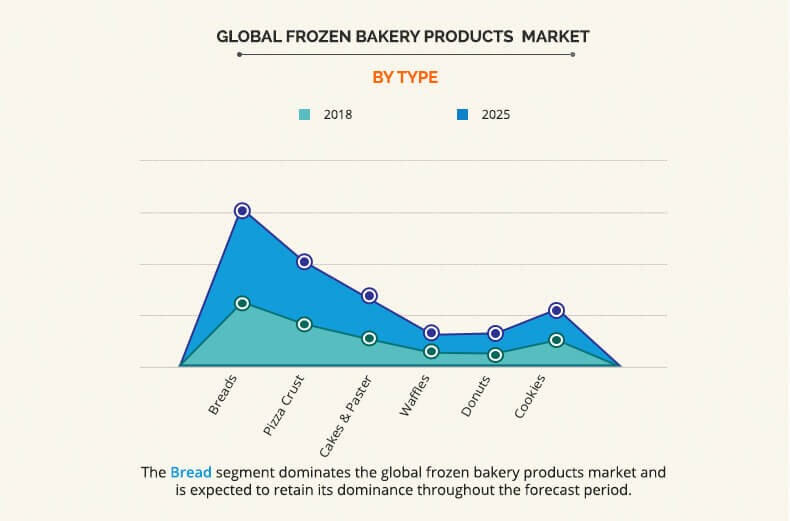
Based on product, the market is segmented into breads, pizza crust, cakes & pastries, waffles, donuts, and cookies. As of 2018, the bread segment accounted for the highest share as compared to other product segment owing to increase in demand for bread in Germany, France, UK, and Italy. In 2018, the pizza crust segment also accounted for highest share after frozen bread segment owing to increase in demand for the products in the retail and commercial sectors. With the rise in trend over vegan diet among customers, some of the key manufacturers now strategize on coming up with pizza crust accordingly. For instance, in 2018, B&G Foods launched cauliflower pizza crust for the North American market. The global frozen bakery products market size is mainly determined by the consumption rate of these products across the globe.


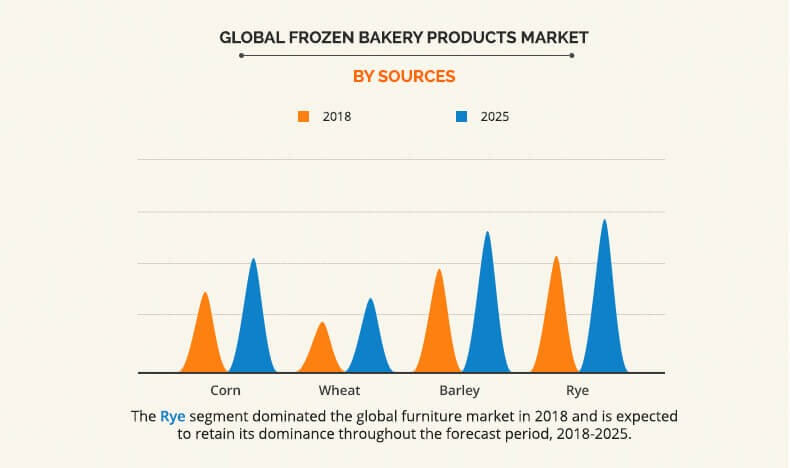
Based on source, the global frozen bakery product market is classified into corn, wheat, barley, and rye. In 2018, barley and rye accounted for highest frozen bakery products market share owing to their adoption as raw materials for the production of various types of frozen bakery products. Though these two sources account for highest share in the source segment, corn is expected to grow at a comparatively higher rate in terms of value during the forecast period. North America is being tagged as the leading producer as well as the consumer of corn. Hence in North America, corn is being used as the prime food ingredient to produce various types of bakery products.


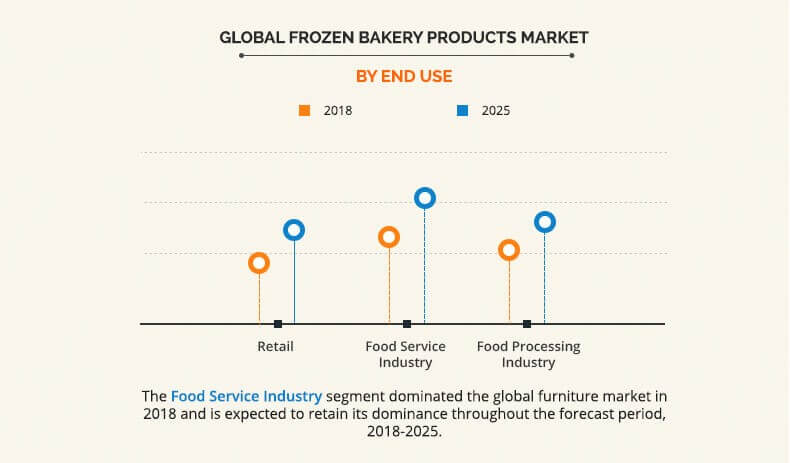
Based on the end use segment, the global frozen bakery product market is segmented into retail, food service industry, and food processing industry. There is an increase in demand for food service industry in the frozen bakery product market as majority of the consumers prefer visiting the quick service restaurants, coffee shops, and restaurants to enjoy a gastronomy experience. This in turn boosts the frozen bakery products market growth.


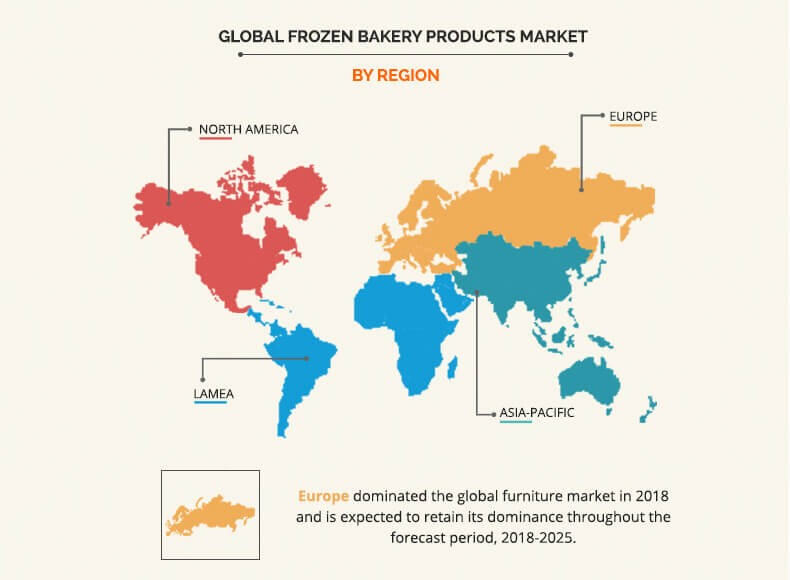
Based on region, the frozen bakery products market is analyzed across North America, Europe, Asia-Pacific, and LAMEA. Europe is a matured and homogenous market for frozen bakery products with high product penetration. Increase in the requirement of frozen bakery products surges the demand for these products in the market. The European market experiences growth owing to good economic situation and rise in product launches that cater to the demand of the consumers. The North America frozen bakery products market is anticipated to witness strong growth owing to rise in awareness about the health benefits associated with the consumption of various types of frozen food products.

Key players profiled for global frozen bakery products market in the report include General Mills (Pillsburry), Aryzta AG, Grupo Bimbo S.A.B. de C.V., Europastry, S.A., Lantmannen Unibake International, Associated British Foods plc, Flower Foods Inc., TreeHouse Foods, Inc., Dawn Foods Products Inc., and Vandemoortele NV.

Key Benefits For Frozen Bakery Products Market:

  • The report provides an extensive frozen bakery products market analysis of the current and emerging market trends and opportunities.
  • The report provides detailed qualitative and quantitative analysis of the current trends and future estimations that help evaluate the prevailing market opportunities.
  • A comprehensive analysis of the factors that drive and restrict the growth of the market is provided.
  • An extensive analysis of the market is conducted by following key product positioning and monitoring the top competitors within the market framework.
  • The report provides extensive qualitative insights on the potential segments or regions exhibiting favorable growth.

Frozen Bakery Products Market Report Highlights

Aspects Details
By Product Type
  • Breads
  • Pizza Crust
  • Cakes & Pastries
  • Waffles
  • Donuts
  • Cookies
By Source
  • Corn
  • Wheat
  • Barley
  • Rye
By End Use
  • Retail
  • Food Service Industry
  • Food Processing Industry
By Distribution Channel
  • Artisan Baker
  • Retail
  • Catering
  • Online Channel
By Region
  • North America  (U.S., Canada)
  • Europe  (Germany, UK, France, Rest of Europe)
  • Asia-Pacific  (China, India, Japan, Rest of Asia-Pacific)
  • LAMEA  (Latin America, Middle East, Africa)
Key Market Players GENERALMILLS(PILLSBURRY), TREEHOUSEFOODS,INC., FLOWER FOODS INC., LANTMANNENUNIBAKEINTERNATIONAL, ARYZTAAG, ASSOCIATE DBRITISH FOODS PLC, DAWNFOODSPRODUCTSINC., EUROPASTRY,S.A., VANDEMOORTELENV, GRUPOBIMBOS.A.B.DEC.V.
 

CHAPTER 1:INTRODUCTION

1.1.REPORTDESCRIPTION
1.2.KEYMARKETSEGMENTS
1.3.KEYBENEFITS
1.4.RESEARCHMETHODOLOGY

1.4.1.Primaryresearch
1.4.2.Secondaryresearch
1.4.3.Analysttoolsandmodels

CHAPTER 2:EXECUTIVESUMMARY

2.1.CXOPERSPECTIVE

CHAPTER 3:MARKETLANDSCAPE

3.1.MARKETDEFINITIONANDSCOPE
3.2.KEYFINDINGS

3.2.1.Topinvestmentpockets
3.2.2.Topwinningstrategies

3.3.PORTER'SFIVEFORCESANALYSIS

3.3.1.Bargainingpowerofsuppliers
3.3.2.Threatofnewentrants
3.3.3.Threatofsubstitutes
3.3.4.Competitiverivalry
3.3.5.Bargainingpoweramongbuyers

3.4.MARKETSHAREANALYSIS/TOPPLAYERPOSITIONING
3.5.MARKETDYNAMICS

3.5.1.Drivers
3.5.2.Restraints
3.5.3.Opportunities

CHAPTER 4:FROZENBAKERYPRODUCTSMARKETBYPRODUCTTYPE

4.1.OVERVIEW
4.2.BREADS

4.2.1.Keymarkettrends,Growthfactorsandopportunities
4.2.2.Marketsizeandforecastbyregion
4.2.3.Marketanalysisbycountry

4.3.PIZZACRUST

4.3.1.Keymarkettrends,Growthfactorsandopportunities
4.3.2.Marketsizeandforecastbyregion
4.3.3.Marketanalysisbycountry

4.4.CAKESANDPASTRIES

4.4.1.Keymarkettrends,Growthfactorsandopportunities
4.4.2.Marketsizeandforecastbyregion
4.4.3.Marketanalysisbycountry

4.5.WAFFLES

4.5.1.Keymarkettrends,Growthfactorsandopportunities
4.5.2.Marketsizeandforecastbyregion
4.5.3.Marketanalysisbycountry

4.6.DONUTS

4.6.1.Keymarkettrends,Growthfactorsandopportunities
4.6.2.Marketsizeandforecastbyregion
4.6.3.Marketanalysisbycountry

4.7.COOKIES

4.7.1.Keymarkettrends,Growthfactorsandopportunities
4.7.2.Marketsizeandforecastbyregion
4.7.3.Marketanalysisbycountry

CHAPTER 5:FROZENBAKERYPRODUCTSMARKETBYSOURCE

5.1.OVERVIEW
5.2.CORN

5.2.1.Keymarkettrends,Growthfactorsandopportunities
5.2.2.Marketsizeandforecastbyregion
5.2.3.Marketanalysisbycountry

5.3.WHEAT

5.3.1.Keymarkettrends,Growthfactorsandopportunities
5.3.2.Marketsizeandforecastbyregion
5.3.3.Marketanalysisbycountry

5.4.BARLEY

5.4.1.Keymarkettrends,Growthfactorsandopportunities
5.4.2.Marketsizeandforecastbyregion
5.4.3.Marketanalysisbycountry

5.5.RYE

5.5.1.Keymarkettrends,Growthfactorsandopportunities
5.5.2.Marketsizeandforecastbyregion
5.5.3.Marketanalysisbycountry

CHAPTER 6:FROZENBAKERYPRODUCTSMARKETBYENDUSE

6.1.OVERVIEW
6.2.RETAIL

6.2.1.Keymarkettrends,Growthfactorsandopportunities
6.2.2.Marketsizeandforecastbyregion
6.2.3.Marketanalysisbycountry

6.3.FOODSERVICEINDUSTRY

6.3.1.Keymarkettrends,Growthfactorsandopportunities
6.3.2.Marketsizeandforecastbyregion
6.3.3.Marketanalysisbycountry

6.4.FOODPROCESSINGINDUSTRY

6.4.1.Keymarkettrends,Growthfactorsandopportunities
6.4.2.Marketsizeandforecastbyregion
6.4.3.Marketanalysisbycountry

CHAPTER 7:FROZENBAKERYPRODUCTSMARKETBYDISTRIBUTIONCHANNEL

7.1.OVERVIEW
7.2.ARTISANBAKER

7.2.1.Keymarkettrends,Growthfactorsandopportunities
7.2.2.Marketsizeandforecastbyregion
7.2.3.Marketanalysisbycountry

7.3.RETAIL

7.3.1.Keymarkettrends,Growthfactorsandopportunities
7.3.2.Marketsizeandforecastbyregion
7.3.3.Marketanalysisbycountry

7.4.CATERING

7.4.1.Keymarkettrends,Growthfactorsandopportunities
7.4.2.Marketsizeandforecastbyregion
7.4.3.Marketanalysisbycountry

7.5.ONLINECHANNEL

7.5.1.Keymarkettrends,Growthfactorsandopportunities
7.5.2.Marketsizeandforecastbyregion
7.5.3.Marketanalysisbycountry

CHAPTER 8:FROZENBAKERYPRODUCTSMARKETBYREGION

8.1.OVERVIEW
8.2.NORTHAMERICA

8.2.1.Keymarkettrendsandopportunities
8.2.2.MarketsizeandforecastbyProductType
8.2.3.MarketsizeandforecastbySource
8.2.4.MarketsizeandforecastbyEndUse
8.2.5.MarketsizeandforecastbyDistributionChannel
8.2.6.MarketsizeandforecastbyCountry
8.2.7.U.S.FROZENBAKERYPRODUCTSMARKET

8.2.7.1.MarketsizeandforecastbyProductType
8.2.7.2.MarketsizeandforecastbySource
8.2.7.3.MarketsizeandforecastbyEndUse
8.2.7.4.MarketsizeandforecastbyDistributionChannel

8.2.8.CANADAFROZENBAKERYPRODUCTSMARKET

8.2.8.1.MarketsizeandforecastbyProductType
8.2.8.2.MarketsizeandforecastbySource
8.2.8.3.MarketsizeandforecastbyEndUse
8.2.8.4.MarketsizeandforecastbyDistributionChannel

8.3.EUROPE

8.3.1.Keymarkettrendsandopportunities
8.3.2.MarketsizeandforecastbyProductType
8.3.3.MarketsizeandforecastbySource
8.3.4.MarketsizeandforecastbyEndUse
8.3.5.MarketsizeandforecastbyDistributionChannel
8.3.6.MarketsizeandforecastbyCountry
8.3.7.GERMANYFROZENBAKERYPRODUCTSMARKET

8.3.7.1.MarketsizeandforecastbyProductType
8.3.7.2.MarketsizeandforecastbySource
8.3.7.3.MarketsizeandforecastbyEndUse
8.3.7.4.MarketsizeandforecastbyDistributionChannel

8.3.8.UKFROZENBAKERYPRODUCTSMARKET

8.3.8.1.MarketsizeandforecastbyProductType
8.3.8.2.MarketsizeandforecastbySource
8.3.8.3.MarketsizeandforecastbyEndUse
8.3.8.4.MarketsizeandforecastbyDistributionChannel

8.3.9.FRANCEFROZENBAKERYPRODUCTSMARKET

8.3.9.1.MarketsizeandforecastbyProductType
8.3.9.2.MarketsizeandforecastbySource
8.3.9.3.MarketsizeandforecastbyEndUse
8.3.9.4.MarketsizeandforecastbyDistributionChannel

8.3.10.RESTOFEUROPEFROZENBAKERYPRODUCTSMARKET

8.3.10.1.MarketsizeandforecastbyProductType
8.3.10.2.MarketsizeandforecastbySource
8.3.10.3.MarketsizeandforecastbyEndUse
8.3.10.4.MarketsizeandforecastbyDistributionChannel

8.4.ASIAPACIFIC

8.4.1.Keymarkettrendsandopportunities
8.4.2.MarketsizeandforecastbyProductType
8.4.3.MarketsizeandforecastbySource
8.4.4.MarketsizeandforecastbyEndUse
8.4.5.MarketsizeandforecastbyDistributionChannel
8.4.6.MarketsizeandforecastbyCountry
8.4.7.CHINAFROZENBAKERYPRODUCTSMARKET

8.4.7.1.MarketsizeandforecastbyProductType
8.4.7.2.MarketsizeandforecastbySource
8.4.7.3.MarketsizeandforecastbyEndUse
8.4.7.4.MarketsizeandforecastbyDistributionChannel

8.4.8.INDIAFROZENBAKERYPRODUCTSMARKET

8.4.8.1.MarketsizeandforecastbyProductType
8.4.8.2.MarketsizeandforecastbySource
8.4.8.3.MarketsizeandforecastbyEndUse
8.4.8.4.MarketsizeandforecastbyDistributionChannel

8.4.9.JAPANFROZENBAKERYPRODUCTSMARKET

8.4.9.1.MarketsizeandforecastbyProductType
8.4.9.2.MarketsizeandforecastbySource
8.4.9.3.MarketsizeandforecastbyEndUse
8.4.9.4.MarketsizeandforecastbyDistributionChannel

8.4.10.RESTOFASIAPACIFICFROZENBAKERYPRODUCTSMARKET

8.4.10.1.MarketsizeandforecastbyProductType
8.4.10.2.MarketsizeandforecastbySource
8.4.10.3.MarketsizeandforecastbyEndUse
8.4.10.4.MarketsizeandforecastbyDistributionChannel

8.5.LAMEA

8.5.1.Keymarkettrendsandopportunities
8.5.2.MarketsizeandforecastbyProductType
8.5.3.MarketsizeandforecastbySource
8.5.4.MarketsizeandforecastbyEndUse
8.5.5.MarketsizeandforecastbyDistributionChannel
8.5.6.MarketsizeandforecastbyCountry
8.5.7.LATINAMERICAFROZENBAKERYPRODUCTSMARKET

8.5.7.1.MarketsizeandforecastbyProductType
8.5.7.2.MarketsizeandforecastbySource
8.5.7.3.MarketsizeandforecastbyEndUse
8.5.7.4.MarketsizeandforecastbyDistributionChannel

8.5.8.MIDDLEEASTFROZENBAKERYPRODUCTSMARKET

8.5.8.1.MarketsizeandforecastbyProductType
8.5.8.2.MarketsizeandforecastbySource
8.5.8.3.MarketsizeandforecastbyEndUse
8.5.8.4.MarketsizeandforecastbyDistributionChannel

8.5.9.AFRICAFROZENBAKERYPRODUCTSMARKET

8.5.9.1.MarketsizeandforecastbyProductType
8.5.9.2.MarketsizeandforecastbySource
8.5.9.3.MarketsizeandforecastbyEndUse
8.5.9.4.MarketsizeandforecastbyDistributionChannel

CHAPTER 9:COMPANYPROFILES

9.1.GENERALMILLS(PILLSBURRY)

9.1.1.Companyoverview
9.1.2.Businessperformance
9.1.3.Keystrategicmovesanddevelopments

9.2.ARYZTAAG

9.2.1.Companyoverview
9.2.2.Businessperformance
9.2.3.Keystrategicmovesanddevelopments

9.3.GRUPOBIMBOS.A.B.DEC.V.

9.3.1.Companyoverview
9.3.2.Businessperformance
9.3.3.Keystrategicmovesanddevelopments

9.4.EUROPASTRY,S.A.

9.4.1.Companyoverview
9.4.2.Businessperformance
9.4.3.Keystrategicmovesanddevelopments

9.5.LANTMANNENUNIBAKEINTERNATIONAL

9.5.1.Companyoverview
9.5.2.Businessperformance
9.5.3.Keystrategicmovesanddevelopments

9.6.ASSOCIATEDBRITISHFOODSPLC

9.6.1.Companyoverview
9.6.2.Businessperformance
9.6.3.Keystrategicmovesanddevelopments

9.7.FLOWERFOODSINC.

9.7.1.Companyoverview
9.7.2.Businessperformance
9.7.3.Keystrategicmovesanddevelopments

9.8.TREEHOUSEFOODS,INC.

9.8.1.Companyoverview
9.8.2.Businessperformance
9.8.3.Keystrategicmovesanddevelopments

9.9.DAWNFOODSPRODUCTSINC.

9.9.1.Companyoverview
9.9.2.Businessperformance
9.9.3.Keystrategicmovesanddevelopments

9.10.VANDEMOORTELENV

9.10.1.Companyoverview
9.10.2.Businessperformance
9.10.3.Keystrategicmovesanddevelopments

LIST OF TABLES

TABLE 01.    GLOBAL FROZEN BAKERY PRODUCTS MARKET, BY PRODUCT TYPE, 2017–2025 ($MILLION)
TABLE 02.    GLOBAL BREADS MARKET, BY REGION, 2017–2025 ($MILLION)
TABLE 03.    GLOBAL PIZZA CRUST FROZEN BAKERY PRODUCTS MARKET, BY REGION, 2017–2025 ($MILLION)
TABLE 04.    GLOBAL CAKES & PASTRIES FROZEN BAKERY PRODUCTS MARKET, BY REGION, 2017–2025 ($MILLION)
TABLE 05.    GLOBAL WAFFLES FROZEN BAKERY PRODUCTS MARKET, BY REGION, 2017–2025 ($MILLION)
TABLE 06.    GLOBAL DONUTS FROZEN BAKERY PRODUCTS MARKET, BY REGION, 2017–2025 ($MILLION)
TABLE 07.    GLOBAL COOKIES FROZEN BAKERY PRODUCTS MARKET, BY REGION, 2017–2025 ($MILLION)
TABLE 08.    GLOBAL FROZEN BAKERY PRODUCTS MARKET, BY SOURCE, 2017–2025 ($MILLION)
TABLE 09.    GLOBAL CORN FROZEN BAKERY PRODUCTS MARKET, BY REGION, 2017–2025 ($MILLION)
TABLE 10.    GLOBAL WHEAT FROZEN BAKERY PRODUCTS MARKET, BY REGION, 2017–2025 ($MILLION)
TABLE 11.    GLOBAL BARLEY FROZEN BAKERY PRODUCTS MARKET, BY REGION, 2017–2025 ($MILLION)
TABLE 12.    GLOBAL RYE FROZEN BAKERY PRODUCTS MARKET, BY REGION, 2017–2025 ($MILLION)
TABLE 13.    GLOBAL FROZEN BAKERY PRODUCTS MARKET, BY END USER, 2017–2025 ($MILLION)
TABLE 14.    GLOBAL FROZEN BAKERY PRODUCTS MARKET FOR RETAIL, BY REGION, 2017–2025 ($MILLION)
TABLE 15.    GLOBAL FROZEN BAKERY PRODUCTS MARKET FOR FOOD SERVICE INDUSTRY, BY REGION, 2017–2025 ($MILLION)
TABLE 16.    GLOBAL FROZEN BAKERY PRODUCTS MARKET FOR FOOD PROCESSING INDUSTRY, BY REGION, 2017–2025 ($MILLION)
TABLE 17.    GLOBAL FROZEN BAKERY PRODUCTS MARKET, BY DISTRIBUTION CHANNEL, 2017–2025 ($MILLION)
TABLE 18.    GLOBAL FROZEN BAKERY PRODUCTS MARKET FOR ARTISAN BAKER, BY REGION, 2017–2025 ($MILLION)
TABLE 19.    GLOBAL FROZEN BAKERY PRODUCTS MARKET FOR RETAIL, BY REGION, 2017–2025 ($MILLION)
TABLE 20.    GLOBAL FROZEN BAKERY PRODUCTS MARKET FOR CATERING, BY REGION, 2017–2025 ($MILLION)
TABLE 21.    GLOBAL FROZEN BAKERY PRODUCTS MARKET FOR ONLINE CHANNEL, BY REGION, 2017–2025 ($MILLION)
TABLE 22.    GLOBAL FROZEN BAKERY PRODUCTS MARKET, BY REGION, 2017–2025 ($MILLION)
TABLE 23.    NORTH AMERICA FROZEN BAKERY PRODUCTS MARKET, BY PRODUCT TYPE, 2017–2025 ($MILLION)
TABLE 24.    NORTH AMERICA FROZEN BAKERY PRODUCTS MARKET, BY SOURCE, 2017–2025 ($MILLION)
TABLE 25.    NORTH AMERICA FROZEN BAKERY PRODUCTS MARKET, BY END USER, 2017–2025 ($MILLION)
TABLE 26.    NORTH AMERICA FROZEN BAKERY PRODUCTS MARKET, BY DISTRIBUTION CHANNEL, 2017–2025 ($MILLION)
TABLE 27.    NORTH AMERICA FROZEN BAKERY PRODUCTS MARKET, BY COUNTRY, 2017–2025 ($MILLION)
TABLE 28.    U.S. FROZEN BAKERY PRODUCTS MARKET, BY PRODUCT TYPE, 2017–2025 ($MILLION)
TABLE 29.    U.S. FROZEN BAKERY PRODUCTS MARKET, BY SOURCE, 2017–2025 ($MILLION)
TABLE 30.    U.S. FROZEN BAKERY PRODUCTS MARKET, BY END USER, 2017–2025 ($MILLION)
TABLE 31.    CANADA FROZEN BAKERY PRODUCTS MARKET, BY PRODUCT TYPE, 2017–2025 ($MILLION)
TABLE 32.    CANADA FROZEN BAKERY PRODUCTS MARKET, BY SOURCE, 2017–2025 ($MILLION)
TABLE 33.    CANADA FROZEN BAKERY PRODUCTS MARKET, BY END USER, 2017–2025 ($MILLION)
TABLE 34.    EUROPE FROZEN BAKERY PRODUCTS MARKET, BY PRODUCT TYPE, 2017–2025 ($MILLION)
TABLE 35.    EUROPE FROZEN BAKERY PRODUCTS MARKET, BY SOURCE, 2017–2025 ($MILLION)
TABLE 36.    EUROPE FROZEN BAKERY PRODUCTS MARKET, BY END USER, 2017–2025 ($MILLION)
TABLE 37.    EUROPE FROZEN BAKERY PRODUCTS MARKET, BY END USER, 2017–2025 ($MILLION)
TABLE 38.    EUROPE FROZEN BAKERY PRODUCTS MARKET, BY COUNTRY, 2017–2025 ($MILLION)
TABLE 39.    UK FROZEN BAKERY PRODUCTS MARKET, BY PRODUCT TYPE, 2017–2025 ($MILLION)
TABLE 40.    UK FROZEN BAKERY PRODUCTS MARKET, BY SOURCE, 2017–2025 ($MILLION)
TABLE 41.    UK FROZEN BAKERY PRODUCTS MARKET, BY END USER, 2017–2025 ($MILLION)
TABLE 42.    UK FROZEN BAKERY PRODUCTS MARKET, BY DISTRIBUTION CHANNEL, 2017–2025 ($MILLION)
TABLE 43.    GERMANY FROZEN BAKERY PRODUCTS MARKET, BY PRODUCT TYPE, 2017–2025 ($MILLION)
TABLE 44.    GERMANY FROZEN BAKERY PRODUCTS MARKET, BY SOURCE, 2017–2025 ($MILLION)
TABLE 45.    GERMANY FROZEN BAKERY PRODUCTS MARKET, BY END USER, 2017–2025 ($MILLION)
TABLE 46.    FRANCE FROZEN BAKERY PRODUCTS MARKET, BY PRODUCT TYPE, 2017–2025 ($MILLION)
TABLE 47.    FRANCE FROZEN BAKERY PRODUCTS MARKET, BY SOURCE, 2017–2025 ($MILLION)
TABLE 48.    FRANCE FROZEN BAKERY PRODUCTS MARKET, BY END USER, 2017–2025 ($MILLION)
TABLE 49.    FRANCE FROZEN BAKERY PRODUCTS MARKET, BY DISTRIBUTION CHANNEL, 2017–2025 ($MILLION)
TABLE 50.    REST OF EUROPE FROZEN BAKERY PRODUCTS MARKET, BY PRODUCT TYPE, 2017–2025 ($MILLION)
TABLE 51.    REST OF EUROPE FROZEN BAKERY PRODUCTS MARKET, BY SOURCE, 2017–2025 ($MILLION)
TABLE 52.    REST OF EUROPE FROZEN BAKERY PRODUCTS MARKET, BY END USER, 2017–2025 ($MILLION)
TABLE 53.    ASIA-PACIFIC FROZEN BAKERY PRODUCTS MARKET, BY PRODUCT TYPE, 2017–2025 ($MILLION)
TABLE 54.    ASIA-PACIFIC FROZEN BAKERY PRODUCTS MARKET, BY SOURCE, 2017–2025 ($MILLION)
TABLE 55.    ASIA-PACIFIC FROZEN BAKERY PRODUCTS MARKET, BY END USER, 2017–2025 ($MILLION)
TABLE 56.    ASIA-PACIFIC FROZEN BAKERY PRODUCTS MARKET, BY DISTRIBUTION CHANNEL, 2017–2025 ($MILLION)
TABLE 57.    ASIA-PACIFIC FROZEN BAKERY PRODUCTS MARKET, BY COUNTRY, 2017–2025 ($MILLION)
TABLE 58.    CHINA FROZEN BAKERY PRODUCTS MARKET, BY PRODUCT TYPE, 2017–2025 ($MILLION)
TABLE 59.    CHINA FROZEN BAKERY PRODUCTS MARKET, BY SOURCE, 2017–2025 ($MILLION)
TABLE 60.    CHINA FROZEN BAKERY PRODUCTS MARKET, BY END USER, 2017–2025 ($MILLION)
TABLE 61.    CHINA FROZEN BAKERY PRODUCTS MARKET, BY END USER, 2017–2025 ($MILLION)
TABLE 62.    INDIA FROZEN BAKERY PRODUCTS MARKET, BY PRODUCT TYPE, 2017–2025 ($MILLION)
TABLE 63.    INDIA FROZEN BAKERY PRODUCTS MARKET, BY SOURCE, 2017–2025 ($MILLION)
TABLE 64.    INDIA FROZEN BAKERY PRODUCTS MARKET, BY END USER, 2017–2025 ($MILLION)
TABLE 65.    INDIA FROZEN BAKERY PRODUCTS MARKET, BY DISTRIBUTION CHANNEL, 2017–2025 ($MILLION)
TABLE 66.    JAPAN FROZEN BAKERY PRODUCTS MARKET, BY PRODUCT TYPE, 2017–2025 ($MILLION)
TABLE 67.    JAPAN FROZEN BAKERY PRODUCTS MARKET, BY SOURCE, 2017–2025 ($MILLION)
TABLE 68.    JAPAN FROZEN BAKERY PRODUCTS MARKET, BY END USER, 2017–2025 ($MILLION)
TABLE 69.    JAPAN FROZEN BAKERY PRODUCTS MARKET, BY DISTRIBUTION CHANNEL, 2017–2025 ($MILLION)
TABLE 70.    REST OF ASIA PACIFIC FROZEN BAKERY PRODUCTS MARKET, BY PRODUCT TYPE, 2017–2025 ($MILLION)
TABLE 71.    REST OF ASIA PACIFIC FROZEN BAKERY PRODUCTS MARKET, BY SOURCE, 2017–2025 ($MILLION)
TABLE 72.    REST OF ASIA PACIFIC FROZEN BAKERY PRODUCTS MARKET, BY END USER, 2017–2025 ($MILLION)
TABLE 73.    REST OF ASIA PACIFIC FROZEN BAKERY PRODUCTS MARKET, BY DISTRIBUTION CHANNEL, 2017–2025 ($MILLION)
TABLE 74.    LAMEA FROZEN BAKERY PRODUCTS MARKET, BY PRODUCT TYPE, 2017–2025 ($MILLION)
TABLE 75.    LAMEA FROZEN BAKERY PRODUCTS MARKET, BY SOURCE, 2017–2025 ($MILLION)
TABLE 76.    LAMEA FROZEN BAKERY PRODUCTS MARKET, BY END USER, 2017–2025 ($MILLION)
TABLE 77.    LAMEA FROZEN BAKERY PRODUCTS MARKET, BY DISTRIBUTION CHANNEL, 2017–2025 ($MILLION)
TABLE 78.    LAMEA FROZEN BAKERY PRODUCTS MARKET, BY COUNTRY, 2017–2025 ($MILLION)
TABLE 79.    LATIN AMERICA FROZEN BAKERY PRODUCTS MARKET, BY PRODUCT TYPE, 2017–2025 ($MILLION)
TABLE 80.    LATIN AMERICA FROZEN BAKERY PRODUCTS MARKET, BY SOURCE, 2017–2025 ($MILLION)
TABLE 81.    LATIN AMERICA FROZEN BAKERY PRODUCTS MARKET, BY END USER, 2017–2025 ($MILLION)
TABLE 82.    LATIN AMERICA FROZEN BAKERY PRODUCTS MARKET, BY END USER, 2017–2025 ($MILLION)
TABLE 83.    MIDDLE EAST FROZEN BAKERY PRODUCTS MARKET, BY PRODUCT TYPE, 2017–2025 ($MILLION)
TABLE 84.    MIDDLE EAST FROZEN BAKERY PRODUCTS MARKET, BY SOURCE, 2017–2025 ($MILLION)
TABLE 85.    MIDDLE EAST FROZEN BAKERY PRODUCTS MARKET, BY END USER, 2017–2025 ($MILLION)
TABLE 86.    MIDDLE EAST FROZEN BAKERY PRODUCTS MARKET, BY END USER, 2017–2025 ($MILLION)
TABLE 87.    AFRICA FROZEN BAKERY PRODUCTS MARKET, BY PRODUCT TYPE, 2017–2025 ($MILLION)
TABLE 88.    AFRICA FROZEN BAKERY PRODUCTS MARKET, BY SOURCE, 2017–2025 ($MILLION)
TABLE 89.    AFRICA FROZEN BAKERY PRODUCTS MARKET, BY END USER, 2017–2025 ($MILLION)
TABLE 90.    AFRICA FROZEN BAKERY PRODUCTS MARKET, BY END USER, 2017–2025 ($MILLION)
TABLE 91.    ARYZTA AG: COMPANY SNAPSHOT
TABLE 92.    ETAC AB: PRODUCT PORTFOLIO
TABLE 93.    GF HEALTH PRODUCTS, INC.: COMPANY SNAPSHOT
TABLE 94.    GF HEALTH PRODUCTS, INC.: PRODUCT PORTFOLIO
TABLE 95.    GRUPO BIMBO S.A.S. DE C.V.: COMPANY SNAPSHOT
TABLE 96.    GRUPO BIMBO S.A.B DE C.V. : PRODUCT PORTFOLIO
TABLE 97.    GRUPO BIMBO S.A.B DE C.V. : PRODUCT PORTFOLIO
TABLE 98.    EUROPASTRY S.A. : COMPANY SNAPSHOT
TABLE 99.    KARMA: PRODUCT PORTFOLIO
TABLE 100.    GRUPO BIMBO S.A.B DE C.V. : PRODUCT PORTFOLIO
TABLE 101.    LANTMANNEN UNIBAKE INTERNATIONAL.: COMPANY SNAPSHOT
TABLE 102.    LANTMANNEN UNIBAKE INTERNATIONAL: PRODUCT PORTFOLIO
TABLE 103.    ASSOCIATED BRITISH FOODS PLC: COMPANY SNAPSHOT
TABLE 104.    ASSOCIATED BRITISH FOODS PLC: PRODUCT PORTFOLIO
TABLE 105.    FLOWER FOODS INC.: COMPANY SNAPSHOT
TABLE 106.    FLOWER FOODS INC.: PRODUCT PORTFOLIO
TABLE 107.    TREEHOUSE FOODS INC.: COMPANY SNAPSHOT
TABLE 108.    TREEHOUSE FOODS INC.: PRODUCT PORTFOLIO
TABLE 109.    DAWN FOODS PRODUCTS INC.: COMPANY SNAPSHOT
TABLE 110.    DAWN FOODS PRODUCTS INC.: PRODUCT PORTFOLIO
TABLE 111.    VANDEMOORTELE NV: COMPANY SNAPSHOT
TABLE 112.    VANDEMOORTELE NV: PRODUCT PORTFOLIO

LIST OF FIGURES

FIGURE 01.    KEY MARKET SEGMENTS
FIGURE 02.    GLOBAL FROZEN BAKERY PRODUCTS MARKET SNAPSHOT
FIGURE 03.    TOP INVESTMENT POCKETS
FIGURE 04.    TOP WINNING STRATEGIES, BY DEVELOPMENT, 2015–2018* (%)
FIGURE 05.    TOP WINNING STRATEGIES, BY COMPANY, 2015–2018*
FIGURE 06.    MODERATE BARGAINING POWER OF SUPPLIERS
FIGURE 07.    MODERATE BARGAINING POWER OF BUYERS
FIGURE 08.    HIGH THREAT OF SUBSTITUTION
FIGURE 09.    MODERATE THREAT OF NEW ENTRANTS
FIGURE 10.    MODERATE INTENSITY OF COMPETITIVE RIVALRY
FIGURE 11.    TOP PLAYER POSITIONING
FIGURE 12.    GLOBAL FROZEN BAKERY PRODUCTS MARKET SHARE, BY PRODUCT TYPES, 2017(%)
FIGURE 13.    COMPARATIVE SHARE ANALYSIS OF FROZEN BAKERY PRODUCTS MARKET, BY COUNTRY, 2017 & 2025 (%)
FIGURE 14.    COMPARATIVE SHARE ANALYSIS OF PEDIATRIC FROZEN BAKERY PRODUCTS MARKET, BY COUNTRY, 2017 & 2025 (%)
FIGURE 15.    COMPARATIVE SHARE ANALYSIS OF CAKES & PASTRIES FROZEN BAKERY PRODUCTS MARKET, BY COUNTRY, 2017 & 2025 (%)
FIGURE 16.    COMPARATIVE SHARE ANALYSIS OF WAFFLES FROZEN BAKERY PRODUCTS MARKET, BY COUNTRY, 2017 & 2025 (%)
FIGURE 17.    COMPARATIVE SHARE ANALYSIS OF PEDIATRIC FROZEN BAKERY PRODUCTS MARKET, BY COUNTRY, 2017 & 2025 (%)
FIGURE 18.    COMPARATIVE SHARE ANALYSIS OF COOKIES FROZEN BAKERY PRODUCTS MARKET, BY COUNTRY, 2017 & 2025 (%)
FIGURE 19.    GLOBAL FROZEN BAKERY PRODUCTS MARKET SHARE, BY SOURCE, 2017(%)
FIGURE 20.    COMPARATIVE SHARE ANALYSIS OF CORN FROZEN BAKERY PRODUCTS MARKET, BY COUNTRY, 2017 & 2025 (%)
FIGURE 21.    COMPARATIVE SHARE ANALYSIS OF WHEAT FROZEN BAKERY PRODUCTS MARKET, BY COUNTRY, 2017 & 2025 (%)
FIGURE 22.    COMPARATIVE SHARE ANALYSIS OF BARIATRIC FROZEN BAKERY PRODUCTS MARKET, BY COUNTRY, 2017 & 2025 (%)
FIGURE 23.    COMPARATIVE SHARE ANALYSIS OF RYE FROZEN BAKERY PRODUCTS MARKET, BY COUNTRY, 2017 & 2025 (%)
FIGURE 24.    GLOBAL FROZEN BAKERY PRODUCTS MARKET SHARE, BY END USER, 2017(%)
FIGURE 25.    COMPARATIVE SHARE ANALYSIS OF FROZEN BAKERY PRODUCTS MARKET FOR RETAIL, BY COUNTRY, 2017 & 2025 (%)
FIGURE 26.    COMPARATIVE SHARE ANALYSIS OF FROZEN BAKERY PRODUCTS MARKET FOR FOOD SERVICE INDUSTRY, BY COUNTRY, 2017 & 2025 (%)
FIGURE 27.    COMPARATIVE SHARE ANALYSIS OF FROZEN BAKERY PRODUCTS MARKET FOR FOOD PROCESSING INDUSTRY, BY COUNTRY,  2017 & 2025 (%)
FIGURE 28.    GLOBAL FROZEN BAKERY PRODUCTS MARKET SHARE, BY DISTRIBUTION CHANNEL, 2017(%)
FIGURE 29.    COMPARATIVE SHARE ANALYSIS OF FROZEN BAKERY PRODUCTS MARKET FOR RETAIL, BY COUNTRY, 2017 & 2025 (%)
FIGURE 30.    COMPARATIVE SHARE ANALYSIS OF FROZEN BAKERY PRODUCTS MARKET FOR RETAIL, BY COUNTRY, 2017 & 2025 (%)
FIGURE 31.    COMPARATIVE SHARE ANALYSIS OF FROZEN BAKERY PRODUCTS MARKET FOR CATERING, BY COUNTRY,  2017 & 2025 (%)
FIGURE 32.    COMPARATIVE SHARE ANALYSIS OF FROZEN BAKERY PRODUCTS MARKET FOR ONLINE CHANNEL, BY COUNTRY,  2017 & 2025 (%)
FIGURE 33.    GLOBAL FROZEN BAKERY PRODUCTS MARKET SHARE BY REGION, 2017(%)
FIGURE 34.    U.S. FROZEN BAKERY PRODUCTS MARKET, 2017–2025 ($MILLION)
FIGURE 35.    CANADA FROZEN BAKERY PRODUCTS MARKET, 2017–2025 ($MILLION)
FIGURE 36.    UK FROZEN BAKERY PRODUCTS MARKET, 2017–2025 ($MILLION)
FIGURE 37.    GERMANY FROZEN BAKERY PRODUCTS MARKET, 2017–2025 ($MILLION)
FIGURE 38.    FRANCE FROZEN BAKERY PRODUCTS MARKET, 2017–2025 ($MILLION)
FIGURE 39.    REST OF EUROPE FROZEN BAKERY PRODUCTS MARKET, 2017–2025 ($MILLION)
FIGURE 40.    CHINA FROZEN BAKERY PRODUCTS MARKET, 2017–2025 ($MILLION)
FIGURE 41.    INDIA FROZEN BAKERY PRODUCTS MARKET, 2017–2025 ($MILLION)
FIGURE 42.    JAPAN FROZEN BAKERY PRODUCTS MARKET, 2017–2025 ($MILLION)
FIGURE 43.    REST OF ASIA PACIFIC FROZEN BAKERY PRODUCTS MARKET, 2017–2025 ($MILLION)
FIGURE 44.    LATIN AMERICA FROZEN BAKERY PRODUCTS MARKET, 2017–2025 ($MILLION)
FIGURE 45.    MIDLDLE EAST FROZEN BAKERY PRODUCTS MARKET, 2017–2025 ($MILLION)
FIGURE 46.    MIDLDLE EAST FROZEN BAKERY PRODUCTS MARKET, 2017–2025 ($MILLION)


The global frozen bakery products market is emerging at a considerable pace owing to enhanced internet penetration facilitating easy access to information about food nutrition, adoption of healthy lifestyle, and surging demand for bakery products. Over the past few years, there has been an increase in rate of consumption of various types frozen food products attributable to various health benefits associated with its consumption. This factor makes way for the growth of the frozen bakery products market.

Now-a-days, customers are more conscious about their health and focus on various food products that deliver health benefits and are easy to cook. This boosts the demand for various types of food products that promote health and wellness.

Moreover, North America and Asia-Pacific are projected to register a significant growth as compared to the saturated markets of Europe due to rise in number of health-conscious customers and growth in per capita income.

PURCHASE OPTIONS

Call or Email us

U.S.-Canada Toll-free: +1-800-792-5285
Int'l : +1-503-894-6022
Europe : +44-845-528-1300
Email : help@alliedmarketresearch.com

Looking for Customization?

 Customization Request

Have a Question?

 Speak with Analyst

Any Confusion?

 Inquire Before Buying

Have a glance of the Report

  Request Sample

Purchase Full Report of
Frozen Bakery Products Market

Start reading instantly.
This Report and over 68,399+ more Reports, Available with Avenue Library. T&C*.

  • Online Only
  • $3,456
  • Online cloud access only
  • Restricted print, copy, paste & download
  • Read only
  • Free industry update
    (Within 180 days)
  • Free report update in next update cycle
    (Feb 2020 - Feb 2021)
  • Data Pack
  • $3,840
  • Restricted to one authorized user
  • One print only
  • Available in
    Excel
  • Free industry update
    (Within 180 days)
  •   Free report update in next update cycle
    (Feb 2020 - Feb 2021)
  • Single User
  • $5,769
  • Restricted to one authorized user
  • One print only
  • Available in
    PDF
  • Free industry update
    (Within 180 days)
  •   Free report update in next update cycle
    (Feb 2020 - Feb 2021)
  • Five Users
  • $6,450
  • Limited to five authorized users
  • Print upto five copies
  • Available in
    PDF
  • Free industry update
    (Within 180 days)
  •   Free report update in next update cycle
    (Feb 2020 - Feb 2021)
  • Enterprise
    License/PDF

  • $10,995
  • Unlimited
    within
    company/enterprise
  • Available in Excel & PDF
  • Free industry update
    (Within 180 days)
  •   Free report update in next update cycle
    (Feb 2020 - Feb 2021)
  • Library
    Membership

  • $999 $ 1,175
    Per User/ Per month/ Billed annually
  • Published Content
    E-access
  • Company Profiles
    E-access
  • Newly Added Content Access
  • 10 PDF
    Downloads
  • 5 Excel Data
    Pack Downloads
  • 250 Company Profiles PDF Downloads
  • Buy Now

*Taxes/Fees, if applicable will be added during checkout. All prices in USD

RELATED REPORTS
 

Why Allied Market Research?


Infallible Methodology

To ensure high-level data integrity, accurate analysis, and impeccable forecasts

Analyst Support

For complete satisfaction

Customization

On-demand customization of scope of the report to exactly meet your needs

TARGETED MARKET VIEW

Targeted market view to provide pertinent information and save time of readers

Get fresh content delivered

Get insights on topics that are crucial for your business. Stay abreast of your interest areas.

Get Industry Data Alerts

Why Allied Market Research?

Infallible Methodology

To ensure high-level data integrity, accurate analysis, and impeccable forecasts

Analyst Support

For complete satisfaction

Customization

On-demand customization of scope of the report to exactly meet your needs

TARGETED MARKET VIEW

Targeted market view to provide pertinent information and save time of readers