
GaN Power Device Market Research, 2033
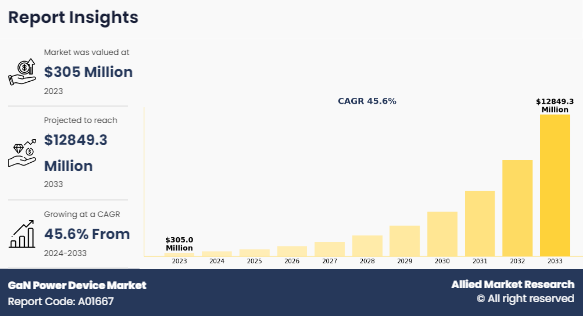
The Global GaN Power Device Market was valued at $305 million in 2023, and is projected to reach $12,849.3 million by 2033, growing at a CAGR of 45.6% from 2024 to 2033. Gallium nitride (GaN) power devices are semiconductor components that utilize GaN as their base material, offering significant advantages over traditional silicon-based devices.
GaN is a wide bandgap semiconductor, allowing for higher efficiency, greater thermal conductivity, and the ability to operate at higher voltages and frequencies. This makes GaN devices particularly suitable for power applications, such as in electric vehicles, renewable energy systems, and industrial power supplies. The introduction of GaN technology has revolutionized power electronics by enabling smaller, lighter, and more efficient power converters. These devices facilitate rapid switching capabilities, reducing energy losses and improving overall system performance. As industries continue to push for higher efficiency and miniaturization, GaN power devices are becoming increasingly vital in advancing modern energy solutions, paving the way for a more sustainable future.
Key Takeaways
- The GaN power device market study covers 20 countries. The research includes a segment analysis of each country in terms of value for the projected period.
- The study integrates high-quality data, professional opinions & analysis, and critical independent perspectives. The research approach is intended to provide a balanced view of global markets and to assist stakeholders in making educated decisions to achieve their most ambitious growth objectives.
- Over 3,700 product literature, annual reports, industry statements, and other comparable materials from major industry participants were reviewed to gain a better understanding of the market.
- The GaN power device market is highly fragmented, with several players, including Efficient Power Conversion Corporation (EPC), Fujitsu Limited, GaN Systems, On Semiconductors, Panasonic Corporation, VisIC, Texas Instruments Inc., Toshiba Corporation, Fujitsu Limited, Infineon Technologies AG, and Taiwan Semiconductor Manufacturing Company.
The GaN power device market is driven by several key factors, including a rise in demand for energy-efficient solutions in various sectors such as automotive, telecommunications, and renewable energy. The increase in the adoption of electric vehicles and the need for advanced power management systems contribute significantly to the market growth. In addition, GaN's ability to operate at higher voltages and frequencies enables smaller, lighter devices, appealing to industries focused on miniaturization. Supportive government initiatives aimed at promoting energy efficiency and sustainability further bolster the GaN power device market growth. As technology advances, the superior performance characteristics of GaN devices, such as increased efficiency and reduced size, are expected to lead to their widespread adoption. High power density and high electron mobility in GaN power devices enable more efficient, compact, and faster power conversion, driving market growth in applications like electric vehicles, renewable energy, and consumer electronics.
Segment Overview
The GaN power device market is segmented into device type, end use, and region. By device type, the market is segmented into power discrete, power module, and power IC. By end use, the market is segmented into telecommunication, industrial, automotive, consumer electronics, military and defense, energy and power, and others. Region-wise, it is analyzed across North America (the U.S., Canada, and Mexico), Europe (the UK, Germany, France, Italy, Spain, and the rest of Europe), Asia-Pacific (China, Japan, India, South Korea, and rest of Asia-Pacific), and LAMEA (Latin America, Middle East, and Africa).
By device type, the power IC segment dominated the GaN power device market in 2023 due to its integration of multiple functions in a compact design. Power ICs enhance efficiency by minimizing energy loss and improving thermal performance, which is critical for applications in electric vehicles, consumer electronics, and renewable energy systems. Their ability to manage power conversion and regulation seamlessly allows for smaller and lighter designs, appealing to industries seeking space-saving solutions. In addition, a rise in demand for high-performance power management solutions further accelerates the adoption of power ICs, driving the segment growth.

By end use, the consumer electronics segment dominated the GaN power device market in 2023 and is expected to continue its dominance during the forecast period due to a rise in demand for efficient, compact, and high-performance devices. As consumer electronics continue to evolve, there is a growing emphasis on miniaturization and enhanced functionality. GaN power devices are particularly well-suited for the needs of miniaturization, efficiency, and high performance, offering significant advantages over traditional silicon-based technologies. Their ability to operate at higher frequencies and voltages allows for smaller power adapters and chargers, making them ideal for smartphones, laptops, and gaming consoles.
Moreover, the shift towards energy-efficient products is driving manufacturers to adopt GaN technology, as it reduces energy consumption and heat generation. This aligns with consumer preferences for eco-friendly devices and regulations aimed at improving energy efficiency. In addition, the rise in fast-changing technologies in smartphones and portable electronics is facilitated by GaN devices, which can significantly reduce charging times while maintaining safety and reliability.
The versatility of GaN in various applications, ranging from power supply units to wireless charging systems, further solidifies its position in the consumer electronics segment. With the rise in demand for high-performance, energy-efficient products, GaN power devices are poised to play a pivotal role in the consumer electronics sector.

Region-wise, it is analyzed across North America (the U.S., Canada, and Mexico), Europe (the UK, Germany, France, Italy, Spain, and the rest of Europe), Asia-Pacific (China, Japan, India, South Korea, and rest of Asia-Pacific), and LAMEA (Latin America, Middle East, and Africa).
The Asia-Pacific region is leading in the GaN power device market as the region is home to a rapidly growing consumer electronics sector, with countries such as China, Japan, and South Korea at the forefront of technological innovation. Rise in demand for efficient power management in devices such as smartphones, laptops, and home appliances drives the adoption of GaN technology, which offers superior performance as compared to traditional silicon solutions.
Moreover, significant investments in electric vehicle (EV) infrastructure and renewable energy initiatives in Asia-Pacific countries are boosting the demand for GaN power devices. Governments are promoting green technologies to meet sustainability goals, further enhancing GaN power device market opportunities. The region also has a robust semiconductor manufacturing base, enabling local companies to develop and produce GaN devices efficiently.
In addition, ongoing advancements in telecommunications, particularly with the rollout of 5G networks, require high-performance power solutions that GaN technology can provide. This combination of a strong industrial foundation, supportive government policies, and advanced demand for advanced electronics positions Asia-Pacific as a leader in the GaN power device market, poised for sustained growth in the coming years.

Competitive Analysis
The players operating in the GaN power device market include Efficient Power Conversion Corporation (EPC), Fujitsu Limited, GaN Systems, On Semiconductor, Panasonic Corporation, VisIC, Texas Instruments Inc., Toshiba Corporation, Fujitsu Limited, Infineon Technologies AG, and Taiwan Semiconductor Manufacturing Company. The key players in the GaN power devices market are focusing on acquisitions and partnerships to increase GaN power devices' capabilities and invest in the R&D of GaN power devices.
Market Dynamics
Advancements in Telecommunications
The rollout of 5G networks is a major factor for the GaN power device market, as it increases the demand for high-performance solutions that can meet the rigorous requirements of modern communication systems. GaN devices offer superior efficiency, higher frequency operation, and reduced thermal management needs, making them ideal for critical applications in telecommunications.
5G technology promises to deliver significantly faster data speeds, lower latency, and increased connectivity for a growing number of devices. 5G technology improves network capabilities, creating a growing need for power amplifiers and management systems that can handle the higher data requirements and provide reliable service.. GaN power devices can operate at higher frequencies, which is essential for the efficient transmission of data in 5G networks. This advantage allows for more compact designs, enabling manufacturers to produce smaller, lighter base stations and network equipment.
Moreover, GaN technology is crucial for telecom operators aiming to reduce operational costs and achieve sustainability targets. As energy efficiency becomes a key focus in the telecommunications industry, companies are looking for solutions that not only lower energy consumption but also minimize environmental impact. By utilizing GaN devices, companies can achieve higher efficiency in power conversion, ultimately lowering energy consumption and reducing their carbon footprint. For instance, in 2022, Qorvo launched its new line of GaN-based power amplifiers tailored for 5G applications. These amplifiers enhance signal strength and coverage, allowing telecom operators to meet the high data demands for 5G technology while optimizing their infrastructure for future advancements. This development highlights GaN's critical role in enabling the next generation of telecommunications.
Limited Availability of Substrates
Limited availability of high-quality GaN substrates poses a significant restraint on the GaN power device market. GaN technology relies heavily on substrates, as they serve as the foundational material upon which devices are fabricated. The most commonly used substrates for GaN production include sapphire, silicon carbide (SiC), and silicon. However, production of high-quality GaN substrates is complex and costly, which can hinder scalability and impact supply chain stability.
Sapphire substrates, while widely used, present challenges in terms of thermal conductivity and lattice mismatch, which can affect device performance. On the other hand, silicon carbide substrates offer better thermal properties but are more expensive and less readily available. As demand for GaN devices surges, driven by sectors such as telecommunications and electric vehicles, the pressure on substrate suppliers increases, potentially leading to shortages and longer lead times.
Moreover, the semiconductor industry is already facing supply chain disruptions, exacerbated by geopolitical factors and the global pandemic. These disruptions further complicate the sourcing of high-quality substrates, making it difficult for manufacturers to scale production to meet rising demand. Consequently, limited substrate availability can lead to higher costs and delays in product development, ultimately slowing down the adoption of GaN power devices in various applications. The scarcity of high-quality GaN substrates presents a significant challenge, impacting production scalability and the overall growth of the GaN power device market.
Renewable Energy Integration
Expansion of renewable energy sources, such as solar and wind, presents a significant opportunity for the adoption of Gallium Nitride (GaN) technology, particularly in power conversion and management applications. As the world increasingly shifts toward sustainable energy solutions to combat climate change, the efficiency and effectiveness of energy conversion systems become paramount. GaN power devices excel in this area, including energy efficiency, thermal management, size and weight reduction, and high-frequency operation. Their superior performance characteristics compared to traditional silicon-based devices allow them to operate at higher frequencies, which enables the design of smaller and lighter inverters and converters, crucial for optimizing space and weight in renewable energy installations. In solar energy systems, GaN technology enables more efficient power conversion from photovoltaic (PV) panels to the electrical grid, maximizing energy yield and reducing losses. Similarly, in wind energy applications, GaN devices enhance the performance of power converters that manage the variable output from wind turbines, ensuring stable and reliable energy delivery. The high efficiency of GaN devices not only improves the overall energy output but also reduces cooling requirements, leading to lower operational costs.
Furthermore, government initiatives and incentives promoting renewable energy adoption create a favorable environment for the integration of advanced technologies, including GaN. As more countries set ambitious renewable energy targets, the demand for efficient power management solutions will grow, driving the adoption of GaN devices.
In addition, the shift toward decentralized energy systems, including microgrids and energy storage solutions, further emphasizes the need for efficient power conversion technologies. GaN technology stands out as a key enabler for the future of renewable energy, paving the way for smarter, more efficient energy systems that align with global sustainability goals. This combination of factors positions GaN technology as an essential component in the transition to a more sustainable energy landscape.
Historical Data and Information for the GaN Power Device Industry
The GaN power device market has seen significant growth over the past decade, driven by advancements in semiconductor technology and a rise in demand for energy-efficient solutions. Initially used in niche applications like RF amplifiers for military and aerospace, GaN technology has gained prominence in mainstream sectors such as telecommunications, automotive, and consumer electronics.
The rise of electric vehicles and renewable energy sources has further propelled the demand for GaN devices, particularly in applications like power converters and inverters, where efficiency is critical. Government initiatives promoting sustainability and energy efficiency have also supported GaN power device market expansion.
In addition, the demand for fast-charging technologies and the rollout of 5G networks emphasize the need for efficient power management solutions, further accelerating the adoption of GaN devices. This evolution positions the GaN power device market as a dynamic and essential component in the transition toward more sustainable and efficient energy solutions.
Recent Developments in the GaN Power Device Industry
- In June 2024, Texas Instruments launched the industry’s first GaN Integrated Power Module (IPM), aimed at enhancing efficiency and minimizing the size of high-voltage motors. This innovative module integrates GaN technology with advanced control features, delivering significant gains in energy efficiency and compactness, making it well-suited for applications that require robust, high-performance motor control solutions.
Key Benefits For Stakeholders
- This report provides a quantitative GaN power device market analysis of the market segments, current trends, estimations, and dynamics of the GaN power device market from 2023 to 2033 to identify the prevailing GaN power device market opportunities. The GaN power device market size is in $ million in the report.
- The market research is offered along with information related to key drivers, restraints, and GaN power device market opportunities.
- Porter's five forces analysis highlights the potency of buyers and suppliers to enable stakeholders to make profit-oriented business decisions and strengthen their supplier-buyer network. GaN power device market overview, GaN power device market demand is covered in the report.
- In-depth analysis of the GaN power device market report segmentation helps determine the prevailing market opportunities.
- Major countries in each region are mapped according to their revenue contribution to the global market.
- Market player positioning facilitates benchmarking and provides a clear understanding of the present position of the market players. GaN power device market share by companies covered in the report.
- The report includes the analysis of the regional as well as global GaN power device market trends, key players, market segments, application areas, and GaN power device market growth strategies.
GaN Power Device Market Report Highlights
| Aspects | Details |
| Market Size By 2033 | USD 12.9 billion |
| Growth Rate | CAGR of 45.6% |
| Forecast period | 2023 - 2033 |
| Report Pages | 300 |
| By Device Type |
|
| By End Use |
|
| By Region |
|
| Key Market Players | ON SEMICONDUCTOR CORPORATION, Toshiba Corporation, VISIC TECHNOLOGIES LTD, TAIWAN SEMICONDUCTOR MANUFACTURING COMPANY, LTD., GaN Systems Inc., TEXAS INSTRUMENTS INC., Panasonic Corporation, Infineon Technologies AG, Efficient Power Conversion Corporation Inc., Fujitsu Limited |
Analyst Review
Gallium Nitride (GaN) has gradually emerged as a sustainable semiconductor material in imminent power electronic converters. The useful properties of GaN, such as its wide band gap and the prospect to form hetero structures, make the optimization of the power conversion possible. Although GaN power devices are in an initial phase, they have already surpassed the silicon counterparts. GaN is applied in optical and high-speed electronic devices, and has gained considerable impetus in recent years for power electronics applications. High-voltage transistors over 600 V have been reported to gain a high growth rate in terms of revenue. Over the past decade, the performance of GaN power devices has been quickly improving.
The preference of GaN over other wide band gap materials like Silicon Carbide (SiC) and diamond, as they offer similar, if not better performance than its counterparts in comparatively low cost. In addition, their advantageous properties, such as high frequency switching, and compact size, also help to spur their demand in the market. GaN switching devices are anticipated to replace metal oxide semiconductor field effect transistors (MOSFETs) in majority of the switching power supply applications in the coming years.
GaN Power Modules accounts for the majority of market share in the device segment, owing to their wide scale operation across several applications, such as high voltage applications where low current loss is a priority. GaN power ICs are anticipated to grow with a fast-paced rate in the forthcoming years.
The North American region held the highest share in the market, owing to the presence of developed nations that possess an established IT & telecommunication vertical, which has the highest revenue share in the market.
Key players in the GaN Power Devices market are Efficient Power Conversion Corporation (EPC), GaN Systems, On Semiconductors, Panasonic Corporation, VisIC, Texas Instruments Inc., Toshiba Corporation, Fujitsu Limited, Infineon Technologies AG, and Taiwan Semiconductor Manufacturing Company.
The GaN power device market was valued at $ 305.0 million in 2023 and is estimated to reach $12,849.3 million by 2033, exhibiting a CAGR of 45.6% from 2024 to 2033.
The Asia-Pacific region is leading in the market as the region is home to a rapidly growing consumer electronics sector, with countries such as China, Japan, and South Korea at the forefront of technological innovation
The consumer electronics segment dominated the market in 2023 and is expected to continue its dominance during the forecast period due to rise in demand for efficient, compact, and high-performance devices
The GaN power device market is growing due to rising energy efficiency demands, electric vehicle expansion, and renewable energy systems. Trends include miniaturization, 5G technology advancements, increased R&D investments, and emerging applications across various sectors, all contributing to a competitive landscape and enhanced adoption of GaN technology.
The players operating in the global GaN power devices market include Efficient Power Conversion Corporation (EPC), Fujitsu Limited, GaN Systems, On Semiconductors, Panasonic Corporation, VisIC, Texas Instruments Inc., Toshiba Corporation, Fujitsu Limited, Infineon Technologies AG, and Taiwan Semiconductor Manufacturing Company.
Loading Table Of Content...
Loading Research Methodology...

