0
2022
Geothermal Turbines Market

Geothermal Turbines Market

by Type (Dry Steam, Flash Cycle, Binary Cycle), by Application (Industrial, Residential, Agricultural, Others): Global Opportunity Analysis and Industry Forecast, 2021-2031

Report Code: A15572
Oct 2022 | Pages: 218
Tables: 119
Charts: 66
  • Formats*:

  • pdf

    Single User License, Five User
    License & Enterprise User License

  • xls

    Data Pack Excel License

  • ppt

    It comes with the additional cost
    of $2500.00 contact sales.


Geothermal Turbines Market Research, 2031

The global geothermal turbines market size was valued at $67.5 billion in 2021 and is projected to reach $99.5 billion by 2031, growing at a CAGR of 4% from 2022 to 2031.

In the second quarter 2021, due to eco-friendly and clean resources leads to a rise in security concern for electricity and are continuously driving the market growth for the geothermal power market.However, it is anticipated that sales of geothermal turbine for power generation will increase in the next years due to elements including supportive government policies and initiatives to fulfil expanding energy demand using renewable energy sources.

The geothermal turbines market majorly focuses on the indicators that are comprehensively included while conducting a thorough analysis. The key indicators include product mapping of players, impact of key regulations on the market, value chain analysis, porter's five forces, top player positioning, market dynamics, covid impact, top investment pockets, market size, and forecast in terms of value($Million), and top winning strategies that have helped understand the growth strategies adopted by the key players and their potential impact on the market.

Geothermal Turbines Market

Geothermal is a dependable and unvarying source of energy that can be acquired without burning any external fuel. The energy can be managed from underground sources such as hot rocks, hot dry steam, and wet steam sources. The use of geothermal energy is greatly impacted by factors including steam & water temperature, accessibility, reservoir porosity, and permeability. The energy can be used for cooling, district heating, or for electricity generation depending on its properties.

The rise in the share of renewable energy sources and the demand for clean energy are the key factors propelling the growth of the global geothermal turbines market. In addition, it is projected that rising demand for heating and cooling systems, such as district heating and ground source heat pumps, will propel the geothermal turbines market growth. Moreover, as renewable energy is becoming a larger portion of the overall energy mix, the global geothermal turbine market is predicted to rise at a rapid rate during the forecast period.

Energy generation from geothermal power plants is capital-intensive and the development of these power plants needs substantial capital requirements, owing to high exploration costs and resource assessment, including field infrastructure, drilling of production and injection wells, geothermal fluid collection and disposal systems, and other surface installations. This is one of the main factors preventing a lot of new competitors from entering the industry. However, these plants have a considerable initial cost. The market expansion among medium and large-tier businesses has been encouraged by their extremely low and predictable operational expenses.

Furthermore, as energy from the earth's surface is used to generate electricity, geothermal energy serves as one of the clean energy sources. Currently, demand for heating and cooling systems that use ground-source heat pumps and district heating is growing substantially. In addition, governments offer several incentives to support market growth. To promote this market, the Alberta government introduced Bill-36, the Geothermal Resource Development Act, in 2020 which aims at defining a working framework for developing geothermal resources in Alberta. Moreover, an increase in the adoption and advancement of binary cycle technology enable the effective use of geothermal resources and creates a wide range of opportunities for the market.
Geothermal Turbines Market

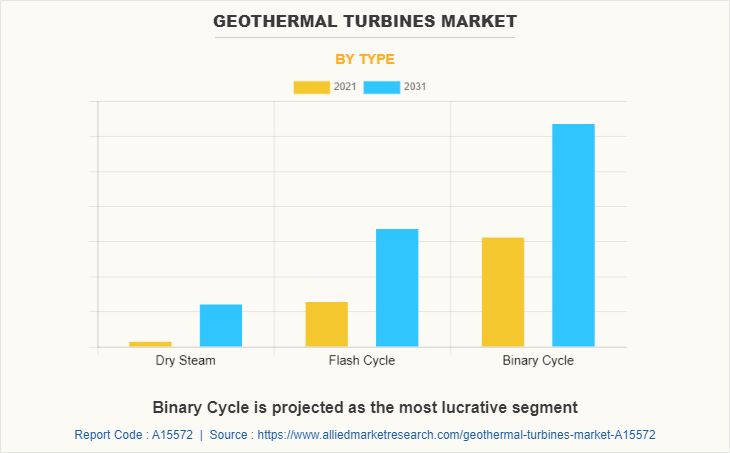
Depending on the type, the binary cycle is the fastest-growing segment during the forecast period. This is attributed to the Majority of binary plants being utilized in low- or medium-enthalpy geothermal fields, where resource fluid is heated in a closed loop by process fluid which leads surge in demand for the market
Geothermal Turbines Market

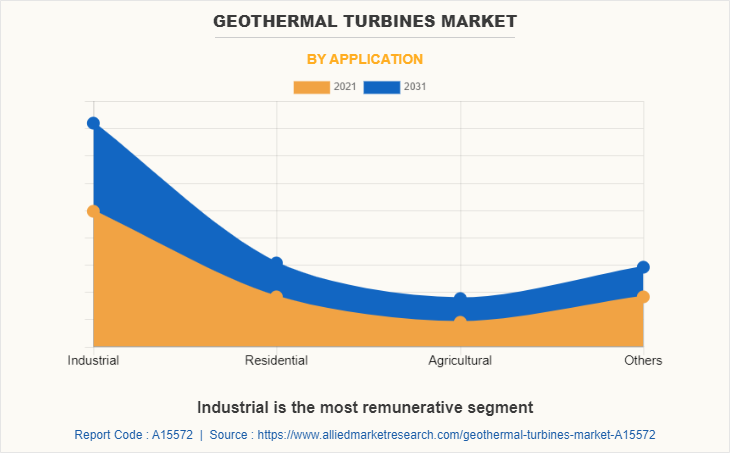
Based on application, the industrial segment witnessed the highest geothermal turbines market share in 2021. Owing to mainly certain industries heating needs can be fulfilled by geothermal heating, as long as they do not require extremely high temperatures. Geothermal heating can replace fossil fuels and provide continuous industrial output.
Geothermal Turbines Market

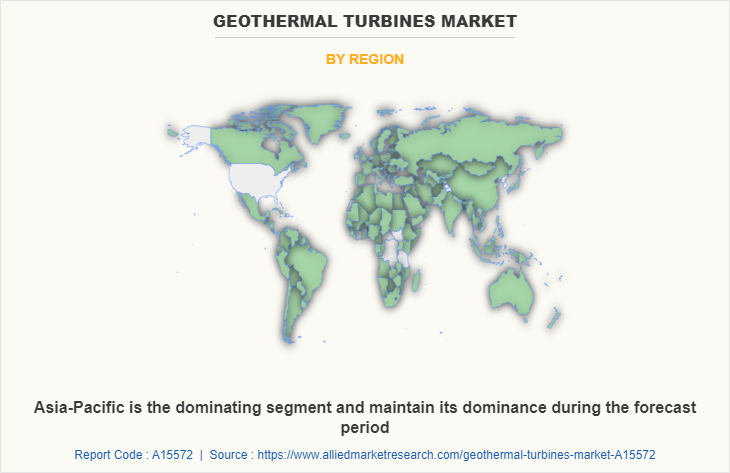
Region-wise Asia-Pacific is the largest segment during the forecast period. This is attributed to the fact that the national government has been forced to take action and adopt laws as a result of the tremendous potential for geothermal energy generation in these economies. These policies may make it possible for oil & gas firms to explore regional geothermal energy potential, hence fostering market expansion.

The geothermal turbine market analysis is segmented based on type, application, and region. Based on type, the market is categorized into dry steam, flash cycle, and binary cycle. Based on application, it is divided into residential, industrial, agricultural, and others. Region-wise, the market is studied across North America, Europe, Asia-Pacific, and LAMEA.

The global geothermal turbine market forecast profiles leading players, including Ansaldo Energia, Calpine, Enel Spa, Exergy International Srl, ElectraTherm Inc., Fuji Electric Co., Ltd., General Electric, Halliburton, Mitsubishi Electric Corporation, Ormat Technologies Inc., Toshiba Corporation and Turboden S.p.A. The global geothermal turbine market report provides an in-depth competitive analysis as well as profiles of these major players.

Recent Development Strategies Undertaken By Key Players:

In April 2021, Ansaldo Energia has been awarded from Gruppo Arvedi a contract for supply and refurbishment of new combined cycle plant in Servola. Such plant includes an AE64.3A gas turbine, equipped with latest generation technologies already validated to guarantee high efficiency, operational flexibility, and low emissions.

In June 2022, EXERGY International Srl and Geothermal Development & Investment Inc. signed a partnership agreement for the exclusive distribution of turnkey geothermal power plants in Japan using advanced, highly efficient ORC (Organic Rankine Cycle) technology.

In July 2022, Enel Green Power agreed with Vulcan Energy for geothermal lithium research by leveraging development opportunities offered by the "Cesano" license in the outskirts of Rome. This agreement brings together the respective expertise of these companies in geothermal energy and lithium extraction to develop joint initiatives at the site located in Latium and beyond.

Impact of COVID-19 on the global geothermal turbines industry

The novel coronavirus is an incomparable global pandemic that has spread to over 180 countries and caused huge loss of lives and the economy around the globe. The adoption of geothermal turbines for electricity generation, which was strongly dependent on China and India, as well as the world economy both, suffered from the health crisis brought on by the spread of COVID-19.

Due to supply chain interruption and a lack of raw materials, manufacturing units were forced to shut down during the lockdown and, in turn, negatively impacting the geothermal turbine for power generation market statistics. Additionally, labor shortage caused supply chain issues in the United States, a dominating country in the geothermal turbine market, and a nationwide lockdown hampered industrial progress.

Further, the disruptions to transport and logistics affected due to strict government regulations as well as nationwide lockdown led to a significant pause in delivering the product, rising shipment costs and price of fuel, taxes, workforce, and disruptions to shipping facilities. However, it is anticipated that sales of geothermal turbines for power generation will increase in the next years due to elements including supportive government policies and initiatives to fulfill expanding energy demand using renewable energy sources.

Key Benefits For Stakeholders

  • This report provides a quantitative analysis of the market segments, current trends, estimations, and dynamics of the geothermal turbines market analysis from 2021 to 2031 to identify the prevailing geothermal turbines market opportunities.
  • The market research is offered along with information related to key drivers, restraints, and opportunities.
  • Porter's five forces analysis highlights the potency of buyers and suppliers to enable stakeholders to make profit-oriented business decisions and strengthen their supplier-buyer network.
  • In-depth analysis of the geothermal turbines market segmentation assists to determine the prevailing market opportunities.
  • Major countries in each region are mapped according to their revenue contribution to the global market.
  • Market player positioning facilitates benchmarking and provides a clear understanding of the present position of the market players.
  • The report includes an analysis of regional and global geothermal turbine market trends, key players, market segments, application areas, and market growth strategies.

Geothermal Turbines Market Report Highlights

Aspects Details
Market Size By 2031 USD 99.5 billion
Growth Rate CAGR of 4%
Forecast period 2021 - 2031
Report Pages 218
By Type
  • Dry Steam
  • Flash Cycle
  • Binary Cycle
By Application
  • Industrial
  • Residential
  • Agricultural
  • Others
By Region
  • North America  (U.S., Canada, Mexico)
  • Europe  (Germany, UK, France, Italy, Spain, Russia, Rest of Europe)
  • Asia-Pacific  (China, Japan, India, South Korea, Australia, Rest of Asia-Pacific)
  • LAMEA  (Brazil, Saudi Arabia, South Africa, Rest of LAMEA)
Key Market Players MITSUBISHI ELECTRIC CORPORATION, GE, Ansaldo Energia, Fuji Electric, ElectraTherm Inc., Calpine, Chevron Corporation, Enel SpA., Exergy International Srl, Toshiba Corporation
 
  • CHAPTER 1:INTRODUCTION

    • 1.1.Report description

    • 1.2.Key market segments

    • 1.3.Key benefits to the stakeholders

    • 1.4.Research Methodology

      • 1.4.1.Secondary research

      • 1.4.2.Primary research

      • 1.4.3.Analyst tools and models

  • CHAPTER 2:EXECUTIVE SUMMARY

    • 2.1.Key findings of the study

    • 2.2.CXO Perspective

  • CHAPTER 3:MARKET OVERVIEW

    • 3.1.Market definition and scope

    • 3.2.Key findings

      • 3.2.1.Top investment pockets

    • 3.3.Porter’s five forces analysis

    • 3.4.Top player positioning

    • 3.5.Market dynamics

      • 3.5.1.Drivers

      • 3.5.2.Restraints

      • 3.5.3.Opportunities

    • 3.6.COVID-19 Impact Analysis on the market

  • CHAPTER 4: GEOTHERMAL TURBINES MARKET, BY TYPE

    • 4.1 Overview

      • 4.1.1 Market size and forecast

    • 4.2 Dry Steam

      • 4.2.1 Key market trends, growth factors and opportunities

      • 4.2.2 Market size and forecast, by region

      • 4.2.3 Market share analysis by country

    • 4.3 Flash Cycle

      • 4.3.1 Key market trends, growth factors and opportunities

      • 4.3.2 Market size and forecast, by region

      • 4.3.3 Market share analysis by country

    • 4.4 Binary Cycle

      • 4.4.1 Key market trends, growth factors and opportunities

      • 4.4.2 Market size and forecast, by region

      • 4.4.3 Market share analysis by country

  • CHAPTER 5: GEOTHERMAL TURBINES MARKET, BY APPLICATION

    • 5.1 Overview

      • 5.1.1 Market size and forecast

    • 5.2 Industrial

      • 5.2.1 Key market trends, growth factors and opportunities

      • 5.2.2 Market size and forecast, by region

      • 5.2.3 Market share analysis by country

    • 5.3 Residential

      • 5.3.1 Key market trends, growth factors and opportunities

      • 5.3.2 Market size and forecast, by region

      • 5.3.3 Market share analysis by country

    • 5.4 Agricultural

      • 5.4.1 Key market trends, growth factors and opportunities

      • 5.4.2 Market size and forecast, by region

      • 5.4.3 Market share analysis by country

    • 5.5 Others

      • 5.5.1 Key market trends, growth factors and opportunities

      • 5.5.2 Market size and forecast, by region

      • 5.5.3 Market share analysis by country

  • CHAPTER 6: GEOTHERMAL TURBINES MARKET, BY REGION

    • 6.1 Overview

      • 6.1.1 Market size and forecast

    • 6.2 North America

      • 6.2.1 Key trends and opportunities

      • 6.2.2 North America Market size and forecast, by Type

      • 6.2.3 North America Market size and forecast, by Application

      • 6.2.4 North America Market size and forecast, by country

        • 6.2.4.1 U.S.
          • 6.2.4.1.1 Key market trends, growth factors and opportunities
          • 6.2.4.1.2 Market size and forecast, by Type
          • 6.2.4.1.3 Market size and forecast, by Application
        • 6.2.4.2 Canada
          • 6.2.4.2.1 Key market trends, growth factors and opportunities
          • 6.2.4.2.2 Market size and forecast, by Type
          • 6.2.4.2.3 Market size and forecast, by Application
        • 6.2.4.3 Mexico
          • 6.2.4.3.1 Key market trends, growth factors and opportunities
          • 6.2.4.3.2 Market size and forecast, by Type
          • 6.2.4.3.3 Market size and forecast, by Application
    • 6.3 Europe

      • 6.3.1 Key trends and opportunities

      • 6.3.2 Europe Market size and forecast, by Type

      • 6.3.3 Europe Market size and forecast, by Application

      • 6.3.4 Europe Market size and forecast, by country

        • 6.3.4.1 Germany
          • 6.3.4.1.1 Key market trends, growth factors and opportunities
          • 6.3.4.1.2 Market size and forecast, by Type
          • 6.3.4.1.3 Market size and forecast, by Application
        • 6.3.4.2 UK
          • 6.3.4.2.1 Key market trends, growth factors and opportunities
          • 6.3.4.2.2 Market size and forecast, by Type
          • 6.3.4.2.3 Market size and forecast, by Application
        • 6.3.4.3 France
          • 6.3.4.3.1 Key market trends, growth factors and opportunities
          • 6.3.4.3.2 Market size and forecast, by Type
          • 6.3.4.3.3 Market size and forecast, by Application
        • 6.3.4.4 Italy
          • 6.3.4.4.1 Key market trends, growth factors and opportunities
          • 6.3.4.4.2 Market size and forecast, by Type
          • 6.3.4.4.3 Market size and forecast, by Application
        • 6.3.4.5 Spain
          • 6.3.4.5.1 Key market trends, growth factors and opportunities
          • 6.3.4.5.2 Market size and forecast, by Type
          • 6.3.4.5.3 Market size and forecast, by Application
        • 6.3.4.6 Russia
          • 6.3.4.6.1 Key market trends, growth factors and opportunities
          • 6.3.4.6.2 Market size and forecast, by Type
          • 6.3.4.6.3 Market size and forecast, by Application
        • 6.3.4.7 Rest of Europe
          • 6.3.4.7.1 Key market trends, growth factors and opportunities
          • 6.3.4.7.2 Market size and forecast, by Type
          • 6.3.4.7.3 Market size and forecast, by Application
    • 6.4 Asia-Pacific

      • 6.4.1 Key trends and opportunities

      • 6.4.2 Asia-Pacific Market size and forecast, by Type

      • 6.4.3 Asia-Pacific Market size and forecast, by Application

      • 6.4.4 Asia-Pacific Market size and forecast, by country

        • 6.4.4.1 China
          • 6.4.4.1.1 Key market trends, growth factors and opportunities
          • 6.4.4.1.2 Market size and forecast, by Type
          • 6.4.4.1.3 Market size and forecast, by Application
        • 6.4.4.2 Japan
          • 6.4.4.2.1 Key market trends, growth factors and opportunities
          • 6.4.4.2.2 Market size and forecast, by Type
          • 6.4.4.2.3 Market size and forecast, by Application
        • 6.4.4.3 India
          • 6.4.4.3.1 Key market trends, growth factors and opportunities
          • 6.4.4.3.2 Market size and forecast, by Type
          • 6.4.4.3.3 Market size and forecast, by Application
        • 6.4.4.4 South Korea
          • 6.4.4.4.1 Key market trends, growth factors and opportunities
          • 6.4.4.4.2 Market size and forecast, by Type
          • 6.4.4.4.3 Market size and forecast, by Application
        • 6.4.4.5 Australia
          • 6.4.4.5.1 Key market trends, growth factors and opportunities
          • 6.4.4.5.2 Market size and forecast, by Type
          • 6.4.4.5.3 Market size and forecast, by Application
        • 6.4.4.6 Rest of Asia-Pacific
          • 6.4.4.6.1 Key market trends, growth factors and opportunities
          • 6.4.4.6.2 Market size and forecast, by Type
          • 6.4.4.6.3 Market size and forecast, by Application
    • 6.5 LAMEA

      • 6.5.1 Key trends and opportunities

      • 6.5.2 LAMEA Market size and forecast, by Type

      • 6.5.3 LAMEA Market size and forecast, by Application

      • 6.5.4 LAMEA Market size and forecast, by country

        • 6.5.4.1 Brazil
          • 6.5.4.1.1 Key market trends, growth factors and opportunities
          • 6.5.4.1.2 Market size and forecast, by Type
          • 6.5.4.1.3 Market size and forecast, by Application
        • 6.5.4.2 Saudi Arabia
          • 6.5.4.2.1 Key market trends, growth factors and opportunities
          • 6.5.4.2.2 Market size and forecast, by Type
          • 6.5.4.2.3 Market size and forecast, by Application
        • 6.5.4.3 South Africa
          • 6.5.4.3.1 Key market trends, growth factors and opportunities
          • 6.5.4.3.2 Market size and forecast, by Type
          • 6.5.4.3.3 Market size and forecast, by Application
        • 6.5.4.4 Rest of LAMEA
          • 6.5.4.4.1 Key market trends, growth factors and opportunities
          • 6.5.4.4.2 Market size and forecast, by Type
          • 6.5.4.4.3 Market size and forecast, by Application
  • CHAPTER 7: COMPANY LANDSCAPE

    • 7.1. Introduction

    • 7.2. Top winning strategies

    • 7.3. Product Mapping of Top 10 Player

    • 7.4. Competitive Dashboard

    • 7.5. Competitive Heatmap

    • 7.6. Key developments

  • CHAPTER 8: COMPANY PROFILES

    • 8.1 MITSUBISHI ELECTRIC CORPORATION

      • 8.1.1 Company overview

      • 8.1.2 Company snapshot

      • 8.1.3 Operating business segments

      • 8.1.4 Product portfolio

      • 8.1.5 Business performance

      • 8.1.6 Key strategic moves and developments

    • 8.2 Toshiba Corporation

      • 8.2.1 Company overview

      • 8.2.2 Company snapshot

      • 8.2.3 Operating business segments

      • 8.2.4 Product portfolio

      • 8.2.5 Business performance

      • 8.2.6 Key strategic moves and developments

    • 8.3 Fuji Electric

      • 8.3.1 Company overview

      • 8.3.2 Company snapshot

      • 8.3.3 Operating business segments

      • 8.3.4 Product portfolio

      • 8.3.5 Business performance

      • 8.3.6 Key strategic moves and developments

    • 8.4 Enel SpA.

      • 8.4.1 Company overview

      • 8.4.2 Company snapshot

      • 8.4.3 Operating business segments

      • 8.4.4 Product portfolio

      • 8.4.5 Business performance

      • 8.4.6 Key strategic moves and developments

    • 8.5 Exergy International Srl

      • 8.5.1 Company overview

      • 8.5.2 Company snapshot

      • 8.5.3 Operating business segments

      • 8.5.4 Product portfolio

      • 8.5.5 Business performance

      • 8.5.6 Key strategic moves and developments

    • 8.6 Chevron Corporation

      • 8.6.1 Company overview

      • 8.6.2 Company snapshot

      • 8.6.3 Operating business segments

      • 8.6.4 Product portfolio

      • 8.6.5 Business performance

      • 8.6.6 Key strategic moves and developments

    • 8.7 Calpine

      • 8.7.1 Company overview

      • 8.7.2 Company snapshot

      • 8.7.3 Operating business segments

      • 8.7.4 Product portfolio

      • 8.7.5 Business performance

      • 8.7.6 Key strategic moves and developments

    • 8.8 Ansaldo Energia

      • 8.8.1 Company overview

      • 8.8.2 Company snapshot

      • 8.8.3 Operating business segments

      • 8.8.4 Product portfolio

      • 8.8.5 Business performance

      • 8.8.6 Key strategic moves and developments

    • 8.9 ElectraTherm Inc.

      • 8.9.1 Company overview

      • 8.9.2 Company snapshot

      • 8.9.3 Operating business segments

      • 8.9.4 Product portfolio

      • 8.9.5 Business performance

      • 8.9.6 Key strategic moves and developments

    • 8.10 GE

      • 8.10.1 Company overview

      • 8.10.2 Company snapshot

      • 8.10.3 Operating business segments

      • 8.10.4 Product portfolio

      • 8.10.5 Business performance

      • 8.10.6 Key strategic moves and developments

  • LIST OF TABLES

  • TABLE 01. GLOBAL GEOTHERMAL TURBINE TMARKET, BY TYPE, 2021–2031 ($MILLION)
    TABLE 02. GEOTHERMAL TURBINE MARKET FOR DRY STEAM, BY REGION, 2021–2031 ($MILLION)
    TABLE 03. GEOTHERMAL TURBINE MARKET FOR FLASH CYCLE, BY REGION, 2021–2031 ($MILLION)
    TABLE 04. GEOTHERMAL TURBINE MARKET FOR BINARY CYCLE, BY REGION, 2021–2031 ($MILLION)
    TABLE 05. GLOBAL GEOTHERMAL TURBINE MARKET, BY APPLICATION, 2021–2031 ($MILLION)
    TABLE 06. GEOTHERMAL TURBINE MARKET FOR INDUSTRIAL, BY REGION, 2021–2031 ($MILLION)
    TABLE 07. GEOTHERMAL TURBINE MARKET FOR RESIDENTIAL, BY REGION, 2021–2031 ($MILLION)
    TABLE 08. GEOTHERMAL TURBINE MARKET FOR AGRICULTURAL, BY REGION, 2021–2031 ($MILLION)
    TABLE 09. GEOTHERMAL TURBINE MARKET FOR OTHERS, BY REGION, 2021–2031 ($MILLION)
    TABLE 10. SCR POWER CONTROLLER MARKET, BY REGION, 2021–2031 ($MILLION)
    TABLE 11. NORTH AMERICA GEOTHERMAL TURBINE MARKET, BY TYPE, 2021–2031 ($MILLION)
    TABLE 12. NORTH AMERICA GEOTHERMAL TURBINE MARKET, BY APPLICATION, 2021–2031 ($MILLION)
    TABLE 13. NORTH AMERICA GEOTHERMAL TURBINE MARKET, BY COUNTRY, 2021–2031 ($MILLION)
    TABLE 14. U.S. GEOTHERMAL TURBINE MARKET, BY TYPE, 2021–2031 ($MILLION)
    TABLE 15. U.S. GEOTHERMAL TURBINE MARKET, BY APPLICATION, 2021–2031 ($MILLION)
    TABLE 16. CANADA GEOTHERMAL TURBINE MARKET, BY TYPE, 2021–2031 ($MILLION)
    TABLE 17. CANADA GEOTHERMAL TURBINE MARKET, BY APPLICATION, 2021–2031 ($MILLION)
    TABLE 18. MEXICO GEOTHERMAL TURBINE MARKET, BY TYPE, 2021–2031 ($MILLION)
    TABLE 19. MEXICO GEOTHERMAL TURBINE MARKET, BY APPLICATION, 2021–2031 ($MILLION)
    TABLE 20. EUROPE GEOTHERMAL TURBINE MARKET, BY TYPE, 2021–2031 ($MILLION)
    TABLE 21. EUROPE GEOTHERMAL TURBINE MARKET, BY APPLICATION, 2021–2031 ($MILLION)
    TABLE 22. EUROPE GEOTHERMAL TURBINE MARKET, BY COUNTRY, 2021–2031 ($MILLION)
    TABLE 23. GERMANY GEOTHERMAL TURBINE MARKET, BY TYPE, 2021–2031 ($MILLION)
    TABLE 24. GERMANY GEOTHERMAL TURBINE MARKET, BY APPLICATION, 2021–2031 ($MILLION)
    TABLE 25. U.K. GEOTHERMAL TURBINE MARKET, BY TYPE, 2021–2031 ($MILLION)
    TABLE 26. U.K. GEOTHERMAL TURBINE MARKET, BY APPLICATION, 2021–2031 ($MILLION)
    TABLE 27. FRANCE GEOTHERMAL TURBINE MARKET, BY TYPE, 2021–2031 ($MILLION)
    TABLE 28. FRANCE GEOTHERMAL TURBINE MARKET, BY APPLICATION, 2021–2031 ($MILLION)
    TABLE 29. ITALY GEOTHERMAL TURBINE MARKET, BY TYPE, 2021–2031 ($MILLION)
    TABLE 30. ITALY GEOTHERMAL TURBINE MARKET, BY APPLICATION, 2021–2031 ($MILLION)
    TABLE 31. SPAIN GEOTHERMAL TURBINE MARKET, BY TYPE, 2021–2031 ($MILLION)
    TABLE 32. SPAIN GEOTHERMAL TURBINE MARKET, BY APPLICATION, 2021–2031 ($MILLION)
    TABLE 33. RUSSIA GEOTHERMAL TURBINE MARKET, BY TYPE, 2021–2031 ($MILLION)
    TABLE 34. RUSSIA GEOTHERMAL TURBINE MARKET, BY APPLICATION, 2021–2031 ($MILLION)
    TABLE 35. REST OF EUROPE GEOTHERMAL TURBINE MARKET, BY TYPE, 2021–2031 ($MILLION)
    TABLE 36. REST OF EUROPE GEOTHERMAL TURBINE MARKET, BY APPLICATION, 2021–2031 ($MILLION)
    TABLE 37. ASIA-PACIFIC GEOTHERMAL TURBINE MARKET, BY TYPE, 2021–2031 ($MILLION)
    TABLE 38. ASIA-PACIFIC GEOTHERMAL TURBINE MARKET, BY APPLICATION, 2021–2031 ($MILLION)
    TABLE 39. ASIA-PACIFIC GEOTHERMAL TURBINE MARKET, BY COUNTRY, 2021–2031 ($MILLION)
    TABLE 40. CHINA GEOTHERMAL TURBINE MARKET, BY TYPE, 2021–2031 ($MILLION)
    TABLE 41. CHINA GEOTHERMAL TURBINE MARKET, BY APPLICATION, 2021–2031 ($MILLION)
    TABLE 42. JAPAN GEOTHERMAL TURBINE MARKET, BY TYPE, 2021–2031 ($MILLION)
    TABLE 43. JAPAN GEOTHERMAL TURBINE MARKET, BY APPLICATION, 2021–2031 ($MILLION)
    TABLE 44. INDIA GEOTHERMAL TURBINE MARKET, BY TYPE, 2021–2031 ($MILLION)
    TABLE 45. INDIA GEOTHERMAL TURBINE MARKET, BY APPLICATION, 2021–2031 ($MILLION)
    TABLE 46. AUSTRALIA GEOTHERMAL TURBINE MARKET, BY TYPE, 2021–2031 ($MILLION)
    TABLE 47. AUSTRALIA GEOTHERMAL TURBINE MARKET, BY APPLICATION, 2021–2031 ($MILLION)
    TABLE 48. SOUTH KOREA GEOTHERMAL TURBINE MARKET, BY TYPE, 2021–2031 ($MILLION)
    TABLE 49. SOUTH KOREA GEOTHERMAL TURBINE MARKET, BY APPLICATION, 2021–2031 ($MILLION)
    TABLE 50. REST OF ASIA-PACIFIC GEOTHERMAL TURBINE MARKET, BY TYPE, 2021–2031 ($MILLION)
    TABLE 51. REST OF ASIA-PACIFIC GEOTHERMAL TURBINE MARKET, BY APPLICATION, 2021–2031 ($MILLION)
    TABLE 52. LAMEA GEOTHERMAL TURBINE MARKET, BY TYPE, 2021–2031 ($MILLION)
    TABLE 53. LAMEA GEOTHERMAL TURBINE MARKET, BY APPLICATION, 2021–2031 ($MILLION)
    TABLE 54. LAMEA GEOTHERMAL TURBINE MARKET, BY COUNTRY, 2021–2031 ($MILLION)
    TABLE 55. BRAZIL GEOTHERMAL TURBINE MARKET, BY TYPE, 2021–2031 ($MILLION)
    TABLE 56. BRAZIL GEOTHERMAL TURBINE MARKET, BY APPLICATION, 2021–2031 ($MILLION)
    TABLE 57. SAUDI ARABIA GEOTHERMAL TURBINE MARKET, BY TYPE, 2021–2031 ($MILLION)
    TABLE 58. SAUDI ARABIA GEOTHERMAL TURBINE MARKET, BY APPLICATION, 2021–2031 ($MILLION)
    TABLE 59. SOUTH AFRICA GEOTHERMAL TURBINE MARKET, BY TYPE, 2021–2031 ($MILLION)
    TABLE 60. SOUTH AFRICA GEOTHERMAL TURBINE MARKET, BY APPLICATION, 2021–2031 ($MILLION)
    TABLE 61. REST OF LAMEA GEOTHERMAL TURBINE MARKET, BY TYPE, 2021–2031 ($MILLION)
    TABLE 62. REST OF LAMEA GEOTHERMAL TURBINE MARKET, BY APPLICATION, 2021–2031 ($MILLION)
    TABLE 63. KEY AGREEMENT(2020-2022)
    TABLE 64. KEY BUSINEES EXPANSION (2020-2022)
    TABLE 65. ANSALDO ENERGIA: KEY EXECUTIVES
    TABLE 66. ANSALDO ENERGIA: COMPANY SNAPSHOT
    TABLE 67. ANSALDO ENERGIA: PRODUCT PORTFOLIO
    TABLE 68. ANSALDO ENERGIA: KEY STRATEGIC MOVES AND DEVELOPMENTS
    TABLE 69. CALPINE: KEY EXECUTIVES
    TABLE 70. CALPINE: COMPANY SNAPSHOT
    TABLE 71. CALPINE: PRODUCT PORTFOLIO
    TABLE 72. ENEL SPA: KEY EXECUTIVES
    TABLE 73. ENEL SPA: COMPANY SNAPSHOT
    TABLE 74. ENEL SPA: PRODUCT PORTFOLIO
    TABLE 75. OVERALL FINANCIAL STATUS ($MILLION)
    TABLE 76. CHEVRON: KEY STRATEGIC MOVES AND DEVELOPMENT: -
    TABLE 77. EXERGY INTERNATIONAL SRL: KEY EXECUTIVES
    TABLE 78. EXERGY INTERNATIONAL SRL: COMPANY SNAPSHOT
    TABLE 79. EXERGY INTERNATIONAL SRL: PRODUCT PORTFOLIO
    TABLE 80. EXERGY INTERNATIONAL SRL: KEY STRATEGIC MOVES AND DEVELOPMENTS
    TABLE 81. ELECTRATHERM INC.: KEY EXECUTIVES
    TABLE 82. ELECTRATHERM INC.: COMPANY SNAPSHOT
    TABLE 83. ELECTRATHERM INC.: PRODUCT PORTFOLIO
    TABLE 84. FUJI ELECTRIC CO., LTD.: KEY EXECUTIVES
    TABLE 85. FUJI ELECTRIC CO., LTD.: COMPANY SNAPSHOT
    TABLE 86. FUJI ELECTRIC CO., LTD.: OPERATING SEGMENTS
    TABLE 87. FUJI ELECTRIC CO., LTD.: PRODUCT PORTFOLIO
    TABLE 88. FUJI ELECTRIC CO., LTD.: NET SALES, 2019–2021 ($MILLION)
    TABLE 89. GENERAL ELECTRIC: KEY EXECUTIVES
    TABLE 90. GENERAL ELECTRIC: COMPANY SNAPSHOT
    TABLE 91. GENERAL ELECTRIC: OPERATING SEGMENTS
    TABLE 92. GENERAL ELECTRIC: PRODUCT PORTFOLIO
    TABLE 93. OVERALL FINANCIAL STATUS ($MILLION)
    TABLE 94. HALLIBURTON: BOARD OF DIRECTORS
    TABLE 95. HALLIBURTON: SNAPSHOT
    TABLE 96. HALLIBURTON: OPERATING SEGMENTS
    TABLE 97. HALLIBURTON: PRODUCT PORTFOLIO
    TABLE 98. OVERALL FINANCIAL STATUS
    TABLE 99. HALLIBURTON: KEY STRATEGIC MOVES AND DEVELOPMENT: -
    TABLE 100. MITSUBISHI ELECTRIC: KEY EXECUTIVES
    TABLE 101. MITSUBISHI ELECTRIC: COMPANY SNAPSHOT
    TABLE 102. MITSUBISHI ELECTRIC: OPERATING SEGMENTS
    TABLE 103. MITSUBISHI ELECTRIC: PRODUCT PORTFOLIO
    TABLE 104. MITSUBISHI ELECTRIC: NET SALES, 2019–2021 ($MILLION)
    TABLE 105. MITSUBISHI ELECTRIC: KEY STRATEGIC MOVES AND DEVELOPMENTS
    TABLE 106. ORMAT TECHNOLOGIES, INC.: KEY EXECUTIVES
    TABLE 107. ORMAT TECHNOLOGIES, INC.: COMPANY SNAPSHOT
    TABLE 108. ORMAT TECHNOLOGIES, INC.: OPERATING SEGMENTS
    TABLE 109. ORMAT TECHNOLOGIES, INC.: PRODUCT PORTFOLIO
    TABLE 110. ORMAT TECHNOLOGIES, INC.: NET SALES, 2019–2021 ($MILLION)
    TABLE 111. TOSHIBA : KEY EXECUTIVES
    TABLE 112. TOSHIBA: COMPANY SNAPSHOT
    TABLE 113. TOSHIBA: OPERATING SEGMENTS
    TABLE 114. TOSHIBA: PRODUCT PORTFOLIO
    TABLE 115. OVERALL FINANCIAL STATUS ($MILLION)
    TABLE 116. TURBODEN S.P.A: KEY EXECUTIVES
    TABLE 117. TURBODEN S.P.A: COMPANY SNAPSHOT
    TABLE 118. TURBODEN S.P.A: PRODUCT PORTFOLIO
  • LIST OF FIGURES

  • FIGURE 01. GEOTHERMAL TURBINE MARKET SNAPSHOT
    FIGURE 02. GEOTHERMAL TURBINE MARKET SEGMENTATION
    FIGURE 03. TOP INVESTMENT POCKETS
    FIGURE 04. MODERATE BARGAINING POWER OF SUPPLIERS
    FIGURE 05. HIGH BARGAINING POWER OF BUYERS
    FIGURE 06. MODERATE THREAT OF NEW ENTRANTS
    FIGURE 07. HIGH THREAT OF SUBSTITUTES
    FIGURE 08. MODERATE COMPETITIVE RIVALRY
    FIGURE 09. GEOTHERMAL TURBINE MARKET DYNAMICS
    FIGURE 10. VALUE CHAIN ANALYSIS
    FIGURE 11. GLOBAL GEOTHERMAL TURBINE MARKET, BY TYPE, 2021–2031 ($MILLION)
    FIGURE 12. COMPARATIVE SHARE ANALYSIS OF GEOTHERMAL TURBINE MARKET FOR DRY STEAM,
    BY COUNTRY, 2021& 2031 (%)
    FIGURE 13. COMPARATIVE SHARE ANALYSIS OF GEOTHERMAL TURBINE MARKET FOR FLASH CYCLE,
    BY COUNTRY, 2021& 2031 (%)
    FIGURE 14. COMPARATIVE SHARE ANALYSIS OF GEOTHERMAL TURBINE MARKET FOR BINARY CYCLE,
    BY COUNTRY, 2021& 2031 (%)
    FIGURE 15. GLOBAL GEOTHERMAL TURBINE MARKET, BY APPLICATION, 2021–2031 ($MILLION)
    FIGURE 16. COMPARATIVE SHARE ANALYSIS OF GEOTHERMAL TURBINE MARKET FOR INDUSTRIAL,
    BY COUNTRY, 2021& 2031 (%)
    FIGURE 17. COMPARATIVE SHARE ANALYSIS OF GEOTHERMAL TURBINE MARKET FOR RESIDENTIAL,
    BY COUNTRY, 2021& 2031 (%)
    FIGURE 18. COMPARATIVE SHARE ANALYSIS OF GEOTHERMAL TURBINE MARKET FOR AGRICULTURAL,
    BY COUNTRY, 2021& 2031 (%)
    FIGURE 19. COMPARATIVE SHARE ANALYSIS OF GEOTHERMAL TURBINE MARKET FOR OTHERS, BY COUNTRY, 2021& 2031 (%)
    FIGURE 20. GLOBAL GEOTHERMAL TURBINE MARKET, BY REGION, 2021–2031 ($MILLION)
    FIGURE 21. U.S. GEOTHERMAL TURBINE MARKET REVENUE, 2021–2031($MILLION)
    FIGURE 22. CANADA GEOTHERMAL TURBINE MARKET REVENUE, 2021–2031($MILLION)
    FIGURE 23. MEXICO GEOTHERMAL TURBINE MARKET REVENUE, 2021–2031($MILLION)
    FIGURE 24. GERMANY GEOTHERMAL TURBINE MARKET REVENUE, 2021–2031($MILLION)
    FIGURE 25. UK GEOTHERMAL TURBINE MARKET REVENUE, 2021–2031($MILLION)
    FIGURE 26. FRANCE GEOTHERMAL TURBINE MARKET REVENUE, 2021–2031($MILLION)
    FIGURE 27. ITALY GEOTHERMAL TURBINE MARKET REVENUE, 2021–2031($MILLION)
    FIGURE 28. SPAIN GEOTHERMAL TURBINE MARKET REVENUE, 2021–2031($MILLION)
    FIGURE 29. RUSSIA GEOTHERMAL TURBINE MARKET REVENUE, 2021–2031($MILLION)
    FIGURE 30. REST OF EUROPE GEOTHERMAL TURBINE MARKET REVENUE, 2021–2031($MILLION)
    FIGURE 31. CHINA GEOTHERMAL TURBINE MARKET REVENUE, 2021–2031($MILLION)
    FIGURE 32. JAPAN GEOTHERMAL TURBINE MARKET REVENUE, 2021–2031($MILLION)
    FIGURE 33. INDIA GEOTHERMAL TURBINE MARKET REVENUE, 2021–2031($MILLION)
    FIGURE 34. AUSTRALIA GEOTHERMAL TURBINE MARKET REVENUE, 2021–2031($MILLION)
    FIGURE 35. SOUTH KOREA GEOTHERMAL TURBINE MARKET REVENUE, 2021–2031($MILLION)
    FIGURE 36. REST OF ASIA-PACIFIC GEOTHERMAL TURBINE MARKET REVENUE, 2021–2031($MILLION)
    FIGURE 37. BRAZIL GEOTHERMAL TURBINE MARKET REVENUE, 2021–2031($MILLION)
    FIGURE 38. SAUDI ARABIA GEOTHERMAL TURBINE MARKET REVENUE, 2021–2031 ($MILLION)
    FIGURE 39. SOUTH AFRICA GEOTHERMAL TURBINE MARKET REVENUE, 2021–2031($MILLION)
    FIGURE 40. REST OF LAMEA MARKET REVENUE, 2021–2031($MILLION)
    FIGURE 41. MARKET PLAYER POSITIONING, 2021
    FIGURE 42. TOP WINNING STRATEGIES, BY YEAR, (2020-2022)
    FIGURE 43. TOP WINNING STRATEGIES, BY DEVELOPMENT, (2020-2022)
    FIGURE 44. TOP WINNING STRATEGIES, BY COMPANY, (2020-2022)
    FIGURE 45. PRODUCT MAPPING OF TOP 12 PLAYERS
    FIGURE 46. COMPETITIVE HEATMAP OF KEY PLAYERS
    FIGURE 47. ENEL SPA: REVENUE, 2019–2021 ($MILLION)
    FIGURE 48. ENEL SPA: REVENUE SHARE BY REGION, 2021 (%)
    FIGURE 49. FUJI ELECTRIC CO., LTD.: NET SALES, 2019–2021 ($MILLION)
    FIGURE 50. FUJI ELECTRIC CO., LTD.: REVENUE SHARE BY SEGMENT, 2021 (%)
    FIGURE 51. FUJI ELECTRIC CO., LTD.: REVENUE SHARE BY REGION, 2021 (%)
    FIGURE 52. GENERAL ELECTRIC: REVENUE, 2019–2021 ($MILLION)
    FIGURE 53. GENERAL ELECTRIC: REVENUE SHARE BY SEGMENT, 2021 (%)
    FIGURE 54. GENERAL ELECTRIC: REVENUE SHARE BY REGION, 2021 (%)
    FIGURE 55. HALLIBURTON: NET SALES
    FIGURE 56. HALLIBURTON: REVENUES SHARED BY SEGMENT
    FIGURE 57. HALLIBURTON: REVENUES SHARED BY REGION
    FIGURE 58. MITSUBISHI ELECTRIC: NET SALES, 2019–2021 ($MILLION)
    FIGURE 59. MITSUBISHI ELECTRIC: REVENUE SHARE BY SEGMENT, 2021 (%)
    FIGURE 60. MITSUBISHI ELECTRIC: REVENUE SHARE BY REGION, 2021 (%)
    FIGURE 61. ORMAT TECHNOLOGIES, INC.: NET SALES, 2019–2021 ($MILLION)
    FIGURE 62. ORMAT TECHNOLOGIES, INC.: REVENUE SHARE BY SEGMENT, 2021 (%)
    FIGURE 63. ORMAT TECHNOLOGIES, INC.: REVENUE SHARE BY REGION, 2021 (%)
    FIGURE 64. TOSHIBA: REVENUE, 2019–2021 ($MILLION)
    FIGURE 65. TOSHIBA: REVENUE SHARE BY SEGMENT, 2021(%)
    FIGURE 66. TOSHIBA: REVENUE SHARE BY REGION, 2021 (%)


According to CXOs of leading companies, the global geothermal turbine market is projected to exhibit high growth potential. Geothermal energy is heat derived within the sub-surface of the earth. On the basis of characteristics, geothermal energy can be used for heating and cooling purposes. It can also be harnessed to generate clean electricity.

In addition, rise in global population, industrial growth, and rise in infrastructural development activities boost demand for electricity. Consumers are increasingly favoring clean technologies for a variety of end uses, including the power industry. Geothermal energy has excellent reliability and can be used for both direct heating and electricity generation. Sales of geothermal power equipment are anticipated to increase, owing to the switch from solar and wind to geothermal energy. Technological advances, as well as changes in exploration and drilling, power production, steam field, and heating technologies are anticipated to raise the standard of equipment used in geothermal power plants and, as a result, enhance growth of the geothermal turbines market. For instance, In June 2022, Dominica Geothermal Development announced development of a geothermal project in the village of Laudat in Roseau Valley, Dominica with a planned capacity of 10 MW. Construction of the power plant is anticipated to begin within a year and be finished in 18 months. In July 2022, the first geothermal power plant of the California Independent System Operator (CAISO) started its commercial operations. The facility has the ability to produce 30 MW of electricity.

The CXOs further added that sustained economic growth and the development of the commercial and industrial sectors have surged the popularity of geothermal turbine market.

PURCHASE OPTIONS

Call or Email us

U.S.-Canada Toll-free: +1-800-792-5285
Int'l : +1-503-894-6022
Europe : +44-845-528-1300
Email : help@alliedmarketresearch.com
 
FREQUENTLY ASKED QUESTIONS?

A. Rising demand for heating and cooling systems, such as district heating and ground source heat pumps, will propel the geothermal turbines market growth.

A. Industrial is the leading application of geothermal turbines market

A. Asia-Pacific is the largest regional market for Geothermal Turbines

A. The global geothermal turbines market was valued at $67.5 billion in 2021, and is projected to reach $99.5 billion by 2031, growing at a CAGR of 4% from 2022 to 2031.

A. Ansaldo Energia, Calpine, Enel Spa, Exergy International Srl, ElectraTherm Inc., Fuji Electric Co., Ltd., General Electric, Halliburton, Mitsubishi Electric Corporation, Ormat Technologies Inc., Toshiba Corporation and Turboden S.p.A. are the top companies to hold the market share in Geothermal Turbines

Looking for Customization?

 Customization Request

Have a Question?

 Speak with Analyst

Any Confusion?

 Inquire Before Buying

Have a glance of the Report

  Request Sample
RELATED TAGS

Purchase Full Report of
Geothermal Turbines Market

Start reading instantly.
This Report and over 67,404+ more Reports, Available with Avenue Library. T&C*.

  • Online Only
  • $3,570
  • Online cloud access only
  • Restricted print, copy, paste & download
  • Read only
  • Free industry update
    (Within 180 days)
  • Free report update in next update cycle
    (Oct 2023 - Oct 2024)
  • Data Pack
  • $3,840
  • Restricted to one authorized user
  • One print only
  • Available in
    Excel
  • Free industry update
    (Within 180 days)
  •   Free report update in next update cycle
    (Oct 2023 - Oct 2024)
  • Single User
  • $5,730
  • Restricted to one authorized user
  • One print only
  • Available in
    PDF
  • Free industry update
    (Within 180 days)
  •   Free report update in next update cycle
    (Oct 2023 - Oct 2024)
  • Five Users
  • $6,450
  • Limited to five authorized users
  • Print upto five copies
  • Available in
    PDF
  • Free industry update
    (Within 180 days)
  •   Free report update in next update cycle
    (Oct 2023 - Oct 2024)
  • Enterprise
    License/PDF

  • $9,600
  • Unlimited
    within
    company/enterprise
  • Available in Excel & PDF
  • Free industry update
    (Within 180 days)
  •   Free report update in next update cycle
    (Oct 2023 - Oct 2024)
  • Library
    Membership

  • $999 $ 1,175
    Per User/ Per month/ Billed annually
  • Published Content
    E-access
  • Company Profiles
    E-access
  • Newly Added Content Access
  • 10 PDF
    Downloads
  • 5 Excel Data
    Pack Downloads
  • 250 Company Profiles PDF Downloads
  • Buy Now

*Taxes/Fees, if applicable will be added during checkout. All prices in USD

RELATED REPORTS
 

Why Allied Market Research?


Infallible Methodology

To ensure high-level data integrity, accurate analysis, and impeccable forecasts

Analyst Support

For complete satisfaction

Customization

On-demand customization of scope of the report to exactly meet your needs

TARGETED MARKET VIEW

Targeted market view to provide pertinent information and save time of readers

Get fresh content delivered

Get insights on topics that are crucial for your business. Stay abreast of your interest areas.

Get Industry Data Alerts

Why Allied Market Research?

Infallible Methodology

To ensure high-level data integrity, accurate analysis, and impeccable forecasts

Analyst Support

For complete satisfaction

Customization

On-demand customization of scope of the report to exactly meet your needs

TARGETED MARKET VIEW

Targeted market view to provide pertinent information and save time of readers