0
2022
Heat Exchanger Market

Heat Exchanger Market

by Type (Shell and Tube, Plate and Frame, Air-Cooled, Microchannel Heat Exchanger, and Others), End-user Industry (Chemical, Petrochemical, Oil & Gas, HVACR, Food & Beverages, Power Generation, and Others), and Material of Construction (Carbon Steel, Stainless Steel, Nickel, and Others): Global Opportunity Analysis and Industry Forecast 2021-2030

✷  Report Code: A01719
Feb 2022 | Pages: 287
Tables: 138
Charts: 81
  • Formats*:

  • pdf

    Single User License, Five User
    License & Enterprise User License

  • xls

    Data Pack Excel License

  • ppt

    It comes with the additional cost
    of $2500.00 contact sales.


COVID-19

Pandemic disrupted the entire world and affected many industries.

Get detailed COVID-19 impact analysis on the Heat Exchanger Market

Request Now !

Heat Exchanger Market Outlook – 2030

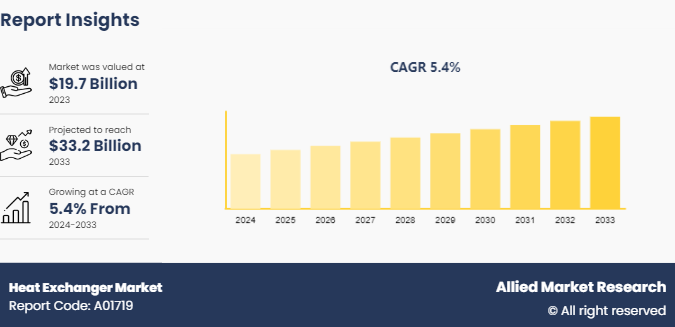
The global heat exchanger market size was valued at $16.7 billion in 2020, and is projected to reach $28.3 billion by 2030, growing at a CAGR of 5.5% from 2020 to 2030. A heat exchanger is a device that facilitates the process of heat exchange between two fluids that are at different temperatures. Heat exchangers are used in many engineering applications, such as refrigeration, heating and air-conditioning systems, power plants, chemical processing systems, food processing systems, automobile radiators, and waste heat recovery units. 

Pandemic impacted almost all industries by hindering various industrial operations and disrupting the supply chain. Maximum companies halted their operation due to less workforce. However, there is a sluggish decline in the global heat exchanger market due to impact of COVID-19.

In addition, air preheaters, economizers, evaporators, superheaters, condensers, and cooling towers used in a power plant are a few examples of heat exchangers. Moreover, heat exchangers are an enabling technology for efficient power generation with a closed, recuperated Brayton cycle, using supercritical carbon dioxide (sCO2) as the working fluid. Heat exchangers influence the overall system efficiency and system size. Heat exchanger designs must balance between heat exchanger effectiveness and pressure drop to achieve the desired tradeoff between system efficiency and system size. This tradeoff between system efficiency and system size is expected to vary with each energy conversion system application.

Heat-Exchanger-Market

Heat exchangers are highly used in chemical, petrochemical, oil & gas, HVACR, food & beverages, and power generation. In addition, rise in demand for product and services by these industries across the globe is predicted to act as a major driving factor for the market. Moreover, rise in demand for heat exchanger in the automotive industry is also expected to act as a major factor for the heat exchanger market growth.

The heat exchanger industry is segmented on the basis of type, end-user industry, material of construction, and region. On the basis of type, the market is categorized into shell and tube, plate and frame, air-cooled, microchannel heat exchanger, and others. On the basis of end-user industry, it is divided into chemical, petrochemical, oil & gas, HVACR, food & beverages, power generation, and others. On the basis of material of construction, it is classified into carbon steel, stainless steel, nickel, and others. The others segment further includes, nickel alloys, titanium, copper, and molybdenum. Region-wise, it is analyzed across North America, Europe, Asia-Pacific, and LAMEA.

The global heat exchanger market analysis covers in-depth information about the major industry participants. The key players operating and profiled in the report include, Accessen Group, Alfa Laval, API Heat Transfer, Chart Industries., Danfoss A/S, Hisaka Works. Ltd., Exchanger Industries Limited, Koch Industries, Inc., Thermofin Gmbh, and Xylem.

Global Heat Exchanger Market, by Type

By type, the shell and tube segment dominated the global heat exchanger market in 2020, and is projected to remain the fastest-growing segment during the forecast period. This is attributed to its advantages over other types of heat exchangers that include, low price as compared to plate type coolers, ease of application in higher operating temperatures and pressures, and others. Shell and tube heat exchangers are a preferred choice owing to the ease of servicing and their compatibility for use with different types of seawater coolants.

Heat Exchanger Market
By Type

Your browser does not support the canvas element.

Shell and tube segment is projected as the most lucrative segment.

Get more information on this report : Request Sample Pages

Global Heat Exchanger Market, by End-user Industry

By end-user industry, the chemical segment dominated the global heat exchanger market in 2020, and is projected to remain the fastest-growing segment during the forecast period. This is attributed to its high adoption of heat exchangers in the chemical industry owing to their application in a complex series of processes, such as heating, cooling, condensing, evaporation, separation, and others. In addition, heat exchangers also withstand the continuous chemical reactions, allowing critical processes to be completed safely as well as efficiently.

Heat Exchanger Market
By End-user

Your browser does not support the canvas element.

Chemical is projected as the most lucrative segment.

Get more information on this report : Request Sample Pages

Global Heat Exchanger Market, by Material of Construction

By Material of construction, the stainless steel segment dominated the global heat exchanger market in 2020, and is projected to remain the fastest-growing segment during the forecast period. This is attributed to its high beneficial characteristics, such as resistance against corrosion in a wide range of pH levels, lightweight, high thermal conductivity, and no requirement of special fluids, as it is compatible with plain clean water. It is a bit expensive; however, due to its aforementioned characteristics, it is preferred for long-run application.

Heat Exchanger Market
By Material Of Construction

Your browser does not support the canvas element.

Stainless steel is projected as the most lucrative segment.

Get more information on this report : Request Sample Pages

Global Heat Exchanger Market, by Region

By region, LAMEA dominated the global heat exchanger market in 2020, and is projected to remain the fastest-growing segment during the forecast period. This is attributed to numerous factors, including a large consumer base (chemical industry, oil & gas refineries, sugar industries, food industry, and others).

Heat Exchanger Market
By Region

2030
Lamea 
North America
Europe
Asia-Pacific

LAMEA holds a dominant position in 2020 and would continue to maintain the lead over the forecast period.

Get more information on this report : Request Sample Pages

Key Benefits For Stakeholders

  • The report provides an in-depth analysis of the global heat exchanger market trends along with the current and future market forecast.
  • This report highlights the key drivers, opportunities, and restraints of the market along with the impact analysis during the forecast period.
  • Porter’s five forces analysis helps analyze the potential of the buyers & suppliers and the competitive scenario of the global heat exchanger market for strategy building.
  • A comprehensive global heat exchanger market forecast report covers factors that drive and restrain the market growth.
  • The qualitative data in this report aims on market dynamics, trends, and developments.

Impact Of Covid-19 Onglobal Heat Exchanger Market

  • The manufacturing of heat exchanger stopped for a specific period due to high peak of COVID-19, which highly impacted sales of the heat exchanger.
  • According to the Organization for Economic Co-operation and Development (OECD), a surge in the price of crude oil began during the lockdown, due to extensive supply and less demand, which increased the production of electricity. However, there is no impact of COVID-19 on the heat exchanger market, due to the extensive production of oil.
  • Sales of heat exchanger is directly proportional to the demand for oil & gas. The oil & gas industry is negatively impacted amid the lockdown imposed due to the COVID-19 outbreak and recorded a huge decline in crude prices in 2020 due to the resumed overflow production, However, the continued upstream activities has not impacted the demand for heat exchanger.
  • COVID-19 impacted almost all industries by hindering various industrial operations and disrupting the supply chain. Maximum companies halted their operation due to less workforce. However, there is a sluggish decline in the global heat exchanger market due to impact of COVID-19. 
  • Furthermore, import and export activities were significantly impacted, which, in turn, adversely affected the industries using heat exchanger and thereby, affecting the global heat exchanger market. 
  • According to the UNIDO, 30.0%–70.0% of pre-COVID-19 workforce of various industries, such as chemical, petrochemical, oil & gas, HVACR, food & beverages, power generation, and other third-party vendors migrated to their hometowns, due to uncertainties and loss of income during the lockdown. This unavailability or less availability of workforce is expected to directly affect the production and manufacturing activities, thereby resulting in decline in demand for raw materials used in heat exchanger. This is expected to decline the growth of the market during the forecast period.
  • The COVID-19 pandemic has had a swift and severe impact on the globally integrated automotive industry. Factors include, disruption in Chinese parts exports, large scale manufacturing interruptions across Europe, and closure of assembly plants in the U.S. However, with decrease in sales of automobile led to decrease in the sales of radiator which in turn to gives a high impact on the heat exchanger market.

Heat Exchanger Market Report Highlights

Aspects Details
By Type
  • Shell And Tube
  • Plate And Frame
  • Air-Cooled
  • Micro channel Heat Exchanger
  • Others
By End-User Industry
  • Chemical
  • Petrochemical
  • Oil and Gas
  • HVACR
  • Food and Beverage
  • Power Generation
  • Others
By Material
  • Carbon Steel
  • Stainless Steel
  • Nickel
  • Others (Nickel Alloys, Titanium, Copper, and Molybdenum)
By Region
  • North America  (U.S., Canada, Mexico)
  • Europe  (Germany, France, UK, Italy, Spain, Rest of Europe)
  • Asia-Pacific  (Japan, China, India, Australia, South Korea, Rest of Asia-Pacific)
  • LAMEA  (Brazil, Saudi Arabia, South Africa, Rest of LAMEA)
 

CHAPTER 1:INTRODUCTION1.1.Report description

1.2.Key market segments
1.3.Key benefits for stakeholders
1.4.Research methodology

1.4.1.Primary research
1.4.2.Secondary research
1.4.3.Analyst tools and models

CHAPTER 2:EXECUTIVE SUMMARY

2.1.Key findings
2.2.CXO perspective

CHAPTER 3:MARKET OVERVIEW

3.1.Market definition and scope
3.2.Key findings

3.2.1.Top investment pockets

3.3.Key forces shaping the market
3.4.Market dynamics

3.4.1.Drivers

3.4.1.1.Growth in oil & gas demand
3.4.1.2.rising industrialization in developing economies

3.4.2.Restraints

3.4.2.1.Leakage and pressure drops in the system

3.4.3.Opportunities

3.4.3.1.Rapid expansion of nuclear power plants
3.4.3.2.Rising demand of petrochemicals

3.5.Pricing Analysis
3.6.Value Chain Analysis
3.7.Impact of key regulations on the global heat exchanger market
3.8.Impact of CORONA (COVID-19) outbreak on the market

CHAPTER 4:GLOBAL HEAT EXCHANGER, BY TYPE

4.1.Overview

4.1.1.Market size and forecast, by Type

4.2.Shell and Tube

4.2.1.Key market trends, growth factors, and opportunities
4.2.2.Market size and forecast, 2020-2030 ($Million)

4.3.Plate and Frame

4.3.1.Key market trends, growth factors, and opportunities
4.3.2.Market size and forecast, 2020-2030 ($Million)

4.4.Air-cooled

4.4.1.Key market trends, growth factors, and opportunities
4.4.2.Market size and forecast, 2020-2030 ($Million)

4.5.Microchannel Heat Exchanger

4.5.1.Key market trends, growth factors, and opportunities
4.5.2.Market size and forecast, 2020-2030 ($Million)

4.6.Others

4.6.1.Key market trends, growth factors, and opportunities
4.6.2.Market size and forecast, 2020-2030 ($Million)

CHAPTER 5:GLOBAL HEAT EXCHANGER, BY END-USER INDUSTRY

5.1.Overview

5.1.1.Market size and forecast, by End-User Industry

5.2.Chemical

5.2.1.Key market trends, growth factors, and opportunities
5.2.2.Market size and forecast, 2020-2030 ($Million)

5.3.Petrochemical

5.3.1.Key market trends, growth factors, and opportunities
5.3.2.Market size and forecast, 2020-2030 ($Million)

5.4.Oil and gas

5.4.1.Key market trends, growth factors, and opportunities
5.4.2.Market size and forecast, 2020-2030 ($Million)

5.5.Heating, ventilation, air conditioning and refrigeration (HVACR)

5.5.1.Key market trends, growth factors, and opportunities
5.5.2.Market size and forecast, 2020-2030 ($Million)

5.6.Food and Beverage

5.6.1.Key market trends, growth factors, and opportunities
5.6.2.Market size and forecast, 2020-2030 ($Million)

5.7.Power Generation

5.7.1.Key market trends, growth factors, and opportunities
5.7.2.Market size and forecast, 2020-2030 ($Million)

5.8.Other

5.8.1.Key market trends, growth factors, and opportunities
5.8.2.Market size and forecast, 2020-2030 ($Million)

CHAPTER 6:GLOBAL HEAT EXCHANGER MARKET, BY MATERIAL OF CONSTRUCTION

6.1.Overview

6.1.1.Market size and forecast, by End-User Industry

6.2.Carbon Steel

6.2.1.Key market trends, growth factors, and opportunities
6.2.2.Market size and forecast, 2020-2030 ($Million)

6.3.Stainless Steel

6.3.1.Key market trends, growth factors, and opportunities
6.3.2.Market size and forecast, 2020-2030 ($Million)

6.4.Nickel

6.4.1.Key market trends, growth factors, and opportunities
6.4.2.Market size and forecast, 2020-2030 ($Million)

6.5.Others (Nickel Alloys, Titanium, Copper And Molybdenum)

6.5.1.Key market trends, growth factors, and opportunities
6.5.2.Market size and forecast, 2020-2030 ($Million)

CHAPTER 7:GLOBAL HEAT EXCHANGER MARKET, BY REGION

7.1.Overview

7.1.1.Market size and forecast, by region

7.2.North America

7.2.1.Key market trends, growth factors, and opportunities
7.2.2.Market size and forecast, by type
7.2.3.Market size and forecast, by End-User Industry
7.2.4.Market size and forecast, by Material of Construction
7.2.5.Market size and forecast, by country

7.2.5.1.U.S.

7.2.5.1.1.Market size and forecast, by type
7.2.5.1.2.Market size and forecast, by End-User Industry
7.2.5.1.3.Market size and forecast, by Material of Construction

7.2.5.2.Canada

7.2.5.2.1.Market size and forecast, by type
7.2.5.2.2.Market size and forecast, by End-User Industry
7.2.5.2.3.Market size and forecast, by Material of Construction

7.2.5.3.Mexico

7.2.5.3.1.Market size and forecast, by type
7.2.5.3.2.Market size and forecast, by End-User Industry
7.2.5.3.3.Market size and forecast, by Material of Construction

7.3.Europe

7.3.1.Key market trends, growth factors, and opportunities
7.3.2.Market size and forecast, by type
7.3.3.Market size and forecast, by End-User Industry
7.3.4.Market size and forecast, by Material of Construction
7.3.5.Market size and forecast, by country

7.3.5.1.Germany

7.3.5.1.1.Market size and forecast, by type
7.3.5.1.2.Market size and forecast, by End-User Industry
7.3.5.1.3.Market size and forecast, by Material of Construction

7.3.5.2.France

7.3.5.2.1.Market size and forecast, by type
7.3.5.2.2.Market size and forecast, by End-User Industry
7.3.5.2.3.Market size and forecast, by Material of Construction

7.3.5.3.Italy

7.3.5.3.1.Market size and forecast, by type
7.3.5.3.2.Market size and forecast, by End-User Industry
7.3.5.3.3.Market size and forecast, by Material of Construction

7.3.5.4.Spain

7.3.5.4.1.Market size and forecast, by type
7.3.5.4.2.Market size and forecast, by End-User Industry
7.3.5.4.3.Market size and forecast, by Material of Construction

7.3.5.5.UK

7.3.5.5.1.Market size and forecast, by type
7.3.5.5.2.Market size and forecast, by End-User Industry
7.3.5.5.3.Market size and forecast, by Material of Construction

7.3.5.6.Rest of Europe

7.3.5.6.1.Market size and forecast, by type
7.3.5.6.2.Market size and forecast, by End-User Industry
7.3.5.6.3.Market size and forecast, by Material of Construction

7.4.Asia-Pacific

7.4.1.Key market trends, growth factors, and opportunities
7.4.2.Market size and forecast, by type
7.4.3.Market size and forecast, by End-User Industry
7.4.4.Market size and forecast, by Material of Construction
7.4.5.Market size and forecast, by country

7.4.5.1.China

7.4.5.1.1.Market size and forecast, by type
7.4.5.1.2.Market size and forecast, by End-User Industry
7.4.5.1.3.Market size and forecast, by Material of Construction

7.4.5.2.India

7.4.5.2.1.Market size and forecast, by type
7.4.5.2.2.Market size and forecast, by End-User Industry
7.4.5.2.3.Market size and forecast, by Material of Construction

7.4.5.3.Japan

7.4.5.3.1.Market size and forecast, by type
7.4.5.3.2.Market size and forecast, by End-User Industry
7.4.5.3.3.Market size and forecast, by Material of Construction

7.4.5.4.South Korea

7.4.5.4.1.Market size and forecast, by type
7.4.5.4.2.Market size and forecast, by End-User Industry
7.4.5.4.3.Market size and forecast, by Material of Construction

7.4.5.5.Australia

7.4.5.5.1.Market size and forecast, by type
7.4.5.5.2.Market size and forecast, by End-User Industry
7.4.5.5.3.Market size and forecast, by Material of Construction

7.4.5.6.Rest of Asia-Pacific

7.4.5.6.1.Market size and forecast, by type
7.4.5.6.2.Market size and forecast, by End-User Industry
7.4.5.6.3.Market size and forecast, by Material of Construction

7.5.LAMEA

7.5.1.Key market trends, growth factors, and opportunities
7.5.2.Market size and forecast, by type
7.5.3.Market size and forecast, by End-User Industry
7.5.4.Market size and forecast, by Material of Construction
7.5.5.Market size and forecast, by country

7.5.5.1.Brazil

7.5.5.1.1.Market size and forecast, by type
7.5.5.1.2.Market size and forecast, by End-User Industry
7.5.5.1.3.Market size and forecast, by Material of Construction

7.5.5.2.Saudi Arabia

7.5.5.2.1.Market size and forecast, by type
7.5.5.2.2.Market size and forecast, by End-User Industry
7.5.5.2.3.Market size and forecast, by Material of Construction

7.5.5.3.South Africa

7.5.5.3.1.Market size and forecast, by type
7.5.5.3.2.Market size and forecast, by End-User Industry
7.5.5.3.3.Market size and forecast, by Material of Construction

7.5.5.4.Rest of LAMEA

7.5.5.4.1.Market size and forecast, by type
7.5.5.4.2.Market size and forecast, by End-User Industry
7.5.5.4.3.Market size and forecast, by Material of Construction

CHAPTER 8:COMPETITIVE LANDSCAPE

8.1.Introduction

8.1.1.Market player positioning, 2020
8.1.2.Company share analysis, 2020

8.2.Top winning strategies

8.2.1.Top winning strategies, by year
8.2.2.Top winning strategies, by development
8.2.3.Top winning strategies, by company

8.3.Product mapping of top 10 players
8.4.Competitive heatmap
8.5.Key developments

8.5.1.New product launches
8.5.2.Expansions

CHAPTER 9:COMPANY PROFILES

9.1.ACCESSEN GROUP

9.1.1.Company overview
9.1.2.Company snapshot
9.1.3.Key executives
9.1.4.Operating business segments
9.1.5.Product portfolio
9.1.6.Business performance
9.1.7.Key strategic moves and developments
9.1.8.ACCESSEN GROUP- SWOT Analysis

9.2.ALFA LAVAL

9.2.1.Company overview
9.2.2.Company snapshot
9.2.3.Product portfolio
9.2.4.Alfa Laval - SWOT Analysis

9.3.API HEAT TRANSFER

9.3.1.Company overview
9.3.2.Company snapshot
9.3.3.Key executives
9.3.4.Product portfolio
9.3.5.Business performance
9.3.6.API Heat Transfer - SWOT Analysis

9.4.CHART INDUSTRIES.

9.4.1.Company overview
9.4.2.Company snapshot
9.4.3.Key executives
9.4.4.Operating business segments
9.4.5.Product portfolio
9.4.6.Business performance
9.4.7.Chart Industries. - SWOT Analysis

9.5.DANFOSS A/S

9.5.1.Company overview
9.5.2.Company snapshot
9.5.3.Key executives
9.5.4.Operating business segments
9.5.5.Product portfolio
9.5.6.Business performance
9.5.7.Key strategic moves and developments
9.5.8.Danfoss A/S - SWOT Analysis

9.6.HISAKA WORKS. LTD.

9.6.1.Company overview
9.6.2.Company snapshot
9.6.3.Key executives
9.6.4.Operating business segments
9.6.5.Product portfolio
9.6.6.Business performance
9.6.7.Key strategic moves and developments
9.6.8.Hisaka Works. Ltd. - SWOT Analysis

9.7.EXCHANGER INDUSTRIES LIMITED

9.7.1.Company overview
9.7.2.Company snapshot
9.7.3.Key executives
9.7.4.Operating business segments
9.7.5.Product portfolio
9.7.6.Business performance
9.7.7.Exchanger Industries Limited - SWOT Analysis

9.8.KOCH INDUSTRIES, INC

9.8.1.Company overview
9.8.2.Company snapshot
9.8.3.Key executives
9.8.4.Product portfolio
9.8.5.Koch Industries, INC - SWOT Analysis

9.9.THERMOFIN GMBH

9.9.1.Company overview
9.9.2.Company snapshot
9.9.3.Key executives
9.9.4.Operating business segments
9.9.5.Product portfolio
9.9.6.Business performance
9.9.7.Key strategic moves and developments
9.9.8.Thermofin Gmbh - SWOT Analysis

9.10.XYLEM

9.10.1.Company overview
9.10.2.Company snapshot
9.10.3.Key executives
9.10.4.Operating business segments
9.10.5.Product portfolio
9.10.6.Business performance
9.10.7.Key strategic moves and developments
9.10.8.Xylem - SWOT Analysis

LIST OF TABLES

TABLE 01.GLOBAL HEAT EXCHANGER, BY TYPE 2020–2030 ($MILLION)
TABLE 02.GLOBAL HEAT EXCHANGER, BY END-USER INDUSTRY 2020–2030 ($MILLION)
TABLE 03.GLOBAL HEAT EXCHANGER, BY MATERIAL OF CONSTRUCTION 2020–2030 ($MILLION)
TABLE 04.GLOBAL HEAT EXCHANGER MARKET, BY REGION 2020–2030 ($MILLION)
TABLE 05.NORTH AMERICA HEAT EXCHANGER MARKET, BY TYPE, 2020–2030 ($MILLION)
TABLE 06.NORTH AMERICA HEAT EXCHANGER MARKET, BY END-USER INDUSTRY, 2020–2030 ($MILLION)
TABLE 07.NORTH AMERICA HEAT EXCHANGER MARKET, BY MATERIAL OF CONSTRUCTION, 2020–2030 ($MILLION)
TABLE 08.NORTH AMERICA HEAT EXCHANGER MARKET, BY COUNTRY 2020–2030 ($MILLION)
TABLE 09.U.S. HEAT EXCHANGER MARKET, BY TYPE, 2020–2030 ($MILLION)
TABLE 10.U.S. HEAT EXCHANGER MARKET, BY END-USER INDUSTRY, 2020–2030 ($MILLION)
TABLE 11.U.S. HEAT EXCHANGER MARKET, BY MATERIAL OF CONSTRUCTION, 2020–2030 ($MILLION)
TABLE 12.CANADA HEAT EXCHANGER MARKET, BY TYPE, 2020–2030 ($MILLION)
TABLE 13.CANADA HEAT EXCHANGER MARKET, BY END-USER INDUSTRY, 2020–2030 ($MILLION)
TABLE 14.CANADA HEAT EXCHANGER MARKET, BY MATERIAL OF CONSTRUCTION, 2020–2030 ($MILLION)
TABLE 15.MEXICO HEAT EXCHANGER MARKET, BY TYPE, 2020–2030 ($MILLION)
TABLE 16.MEXICO HEAT EXCHANGER MARKET, BY END-USER INDUSTRY, 2020–2030 ($MILLION)
TABLE 17.MEXICO HEAT EXCHANGER MARKET, BY MATERIAL OF CONSTRUCTION, 2020–2030 ($MILLION)
TABLE 18.EUROPE HEAT EXCHANGER MARKET, BY TYPE, 2020–2030 ($MILLION)
TABLE 19.EUROPE HEAT EXCHANGER MARKET, BY END-USER INDUSTRY, 2020–2030 ($MILLION)
TABLE 20.EUROPE HEAT EXCHANGER MARKET, BY MATERIAL OF CONSTRUCTION, 2020–2030 ($MILLION)
TABLE 21.EUROPE HEAT EXCHANGER MARKET, BY COUNTRY 2020–2030 ($MILLION)
TABLE 22.GERMANY HEAT EXCHANGER MARKET, BY TYPE, 2020–2030 ($MILLION)
TABLE 23.GERMANY HEAT EXCHANGER MARKET, BY END-USER INDUSTRY, 2020–2030 ($MILLION)
TABLE 24.GERMANY HEAT EXCHANGER MARKET, BY MATERIAL OF CONSTRUCTION, 2020–2030 ($MILLION)
TABLE 25.FRANCE HEAT EXCHANGER MARKET, BY TYPE, 2020–2030 ($MILLION)
TABLE 26.FRANCE HEAT EXCHANGER MARKET, BY END-USER INDUSTRY, 2020–2030 ($MILLION)
TABLE 27.FRANCE HEAT EXCHANGER MARKET, BY MATERIAL OF CONSTRUCTION, 2020–2030 ($MILLION)
TABLE 28.ITALY HEAT EXCHANGER MARKET, BY TYPE, 2020–2030 ($MILLION)
TABLE 29.ITALY HEAT EXCHANGER MARKET, BY END-USER INDUSTRY, 2020–2030 ($MILLION)
TABLE 30.ITALY HEAT EXCHANGER MARKET, BY MATERIAL OF CONSTRUCTION, 2020–2030 ($MILLION)
TABLE 31.SPAIN HEAT EXCHANGER MARKET, BY TYPE, 2020–2030 ($MILLION)
TABLE 32.SPAIN HEAT EXCHANGER MARKET, BY END-USER INDUSTRY, 2020–2030 ($MILLION)
TABLE 33.SPAIN HEAT EXCHANGER MARKET, BY MATERIAL OF CONSTRUCTION, 2020–2030 ($MILLION)
TABLE 34.UK HEAT EXCHANGER MARKET, BY TYPE, 2020–2030 ($MILLION)
TABLE 35.UK HEAT EXCHANGER MARKET, BY END-USER INDUSTRY, 2020–2030 ($MILLION)
TABLE 36.UK HEAT EXCHANGER MARKET, BY MATERIAL OF CONSTRUCTION, 2020–2030 ($MILLION)
TABLE 37.REST OF EUROPE HEAT EXCHANGER MARKET, BY TYPE, 2020–2030 ($MILLION)
TABLE 38.REST OF EUROPE HEAT EXCHANGER MARKET, BY END-USER INDUSTRY, 2020–2030 ($MILLION)
TABLE 39.REST OF EUROPE HEAT EXCHANGER MARKET, BY MATERIAL OF CONSTRUCTION, 2020–2030 ($MILLION)
TABLE 40.ASIA-PACIFIC HEAT EXCHANGER MARKET, BY TYPE, 2020–2030 ($MILLION)
TABLE 41.ASIA-PACIFIC HEAT EXCHANGER MARKET, BY END-USER INDUSTRY, 2020–2030 ($MILLION)
TABLE 42.ASIA-PACIFIC HEAT EXCHANGER MARKET, BY MATERIAL OF CONSTRUCTION, 2020–2030 ($MILLION)
TABLE 43.ASIA-PACIFIC HEAT EXCHANGER MARKET, BY COUNTRY 2020–2030 ($MILLION)
TABLE 44.CHINA HEAT EXCHANGER MARKET, BY TYPE, 2020–2030 ($MILLION)
TABLE 45.CHINA HEAT EXCHANGER MARKET, BY END-USER INDUSTRY, 2020–2030 ($MILLION)
TABLE 46.CHINA HEAT EXCHANGER MARKET, BY MATERIAL OF CONSTRUCTION, 2020–2030 ($MILLION)
TABLE 47.INDIA HEAT EXCHANGER MARKET, BY TYPE, 2020–2030 ($MILLION)
TABLE 48.INDIA HEAT EXCHANGER MARKET, BY END-USER INDUSTRY, 2020–2030 ($MILLION)
TABLE 49.INDIA HEAT EXCHANGER MARKET, BY MATERIAL OF CONSTRUCTION, 2020–2030 ($MILLION)
TABLE 50.JAPAN HEAT EXCHANGER MARKET, BY TYPE, 2020–2030 ($MILLION)
TABLE 51.JAPAN HEAT EXCHANGER MARKET, BY END-USER INDUSTRY, 2020–2030 ($MILLION)
TABLE 52.JAPAN HEAT EXCHANGER MARKET, BY MATERIAL OF CONSTRUCTION, 2020–2030 ($MILLION)
TABLE 53.SOUTH KOREA HEAT EXCHANGER MARKET, BY TYPE, 2020–2030 ($MILLION)
TABLE 54.SOUTH KOREA HEAT EXCHANGER MARKET, BY END-USER INDUSTRY, 2020–2030 ($MILLION)
TABLE 55.SOUTH KOREA HEAT EXCHANGER MARKET, BY MATERIAL OF CONSTRUCTION, 2020–2030 ($MILLION)
TABLE 56.AUSTRALIA HEAT EXCHANGER MARKET, BY TYPE, 2020–2030 ($MILLION)
TABLE 57.AUSTRALIA HEAT EXCHANGER MARKET, BY END-USER INDUSTRY, 2020–2030 ($MILLION)
TABLE 58.AUSTRALIA HEAT EXCHANGER MARKET, BY MATERIAL OF CONSTRUCTION, 2020–2030 ($MILLION)
TABLE 59.REST OF ASIA-PACIFIC HEAT EXCHANGER MARKET, BY TYPE, 2020–2030 ($MILLION)
TABLE 60.REST OF ASIA-PACIFIC HEAT EXCHANGER MARKET, BY END-USER INDUSTRY, 2020–2030 ($MILLION)
TABLE 61.REST OF ASIA-PACIFIC HEAT EXCHANGER MARKET, BY MATERIAL OF CONSTRUCTION, 2020–2030 ($MILLION)
TABLE 62.LAMEA HEAT EXCHANGER MARKET, BY TYPE, 2020–2030 ($MILLION)
TABLE 63.LAMEA HEAT EXCHANGER MARKET, BY END-USER INDUSTRY, 2020–2030 ($MILLION)
TABLE 64.LAMEA HEAT EXCHANGER MARKET, BY MATERIAL OF CONSTRUCTION, 2020–2030 ($MILLION)
TABLE 65.LAMEA HEAT EXCHANGER MARKET, BY COUNTRY 2020–2030 ($MILLION)
TABLE 66.BRAZIL HEAT EXCHANGER MARKET, BY TYPE, 2020–2030 ($MILLION)
TABLE 67.BRAZIL HEAT EXCHANGER MARKET, BY END-USER INDUSTRY, 2020–2030 ($MILLION)
TABLE 68.BRAZIL HEAT EXCHANGER MARKET, BY MATERIAL OF CONSTRUCTION, 2020–2030 ($MILLION)
TABLE 69.SAUDI ARABIA HEAT EXCHANGER MARKET, BY TYPE, 2020–2030 ($MILLION)
TABLE 70.SAUDI ARABIA HEAT EXCHANGER MARKET, BY END-USER INDUSTRY, 2020–2030 ($MILLION)
TABLE 71.SAUDI ARABIA HEAT EXCHANGER MARKET, BY MATERIAL OF CONSTRUCTION, 2020–2030 ($MILLION)
TABLE 72.SOUTH AFRICA HEAT EXCHANGER MARKET, BY TYPE, 2020–2030 ($MILLION)
TABLE 73.SOUTH AFRICA HEAT EXCHANGER MARKET, BY END-USER INDUSTRY, 2020–2030 ($MILLION)
TABLE 74.SOUTH AFRICA HEAT EXCHANGER MARKET, BY MATERIAL OF CONSTRUCTION, 2020–2030 ($MILLION)
TABLE 75.REST OF LAMEA HEAT EXCHANGER MARKET, BY TYPE, 2020–2030 ($MILLION)
TABLE 76.REST OF LAMEA HEAT EXCHANGER MARKET, BY END-USER INDUSTRY, 2020–2030 ($MILLION)
TABLE 77.REST OF LAMEA HEAT EXCHANGER MARKET, BY MATERIAL OF CONSTRUCTION, 2020–2030 ($MILLION)
TABLE 78.KEY NEW PRODUCT LAUNCHES (2017–2021)
TABLE 79.KEY EXPANSIONS (2017–2021)
TABLE 80.ACCESSEN GROUP: COMPANY SNAPSHOT
TABLE 81.ACCESSEN GROUP: KEY EXECUTIVES
TABLE 82.ACCESSEN GROUP: OPERATING SEGMENTS
TABLE 83.ACCESSEN GROUP: PRODUCT PORTFOLIO
TABLE 84.OVERALL FINANCIAL STATUS ($MILLION)
TABLE 85.ACCESSEN GROUP: KEY STRATEGIC MOVES AND DEVELOPMENTS
TABLE 86.ACCESSEN GROUP: SWOT ANALYSIS
TABLE 87.ALFA LAVAL.: COMPANY SNAPSHOT
TABLE 88.ALFA LAVAL.: PRODUCT PORTFOLIO
TABLE 89.ALFA LAVAL.: SWOT ANALYSIS
TABLE 90.API HEAT TRANSFER: COMPANY SNAPSHOT
TABLE 91.API HEAT TRANSFER: KEY EXECUTIVES
TABLE 92.API HEAT TRANSFER: PRODUCT PORTFOLIO
TABLE 93.OVERALL FINANCIAL STATUS ($MILLION)
TABLE 94.API HEAT TRANSFER: SWOT ANALYSIS
TABLE 95.CHART INDUSTRIES.: COMPANY SNAPSHOT
TABLE 96.CHART INDUSTRIES.: KEY EXECUTIVES
TABLE 97.CHART INDUSTRIES..: OPERATING SEGMENTS
TABLE 98.CHART INDUSTRIES.: PRODUCT PORTFOLIO
TABLE 99.OVERALL FINANCIAL STATUS ($MILLION)
TABLE 100.CHART INDUSTRIES.: SWOT ANALYSIS
TABLE 101.DANFOSS A/S: COMPANY SNAPSHOT
TABLE 102.DANFOSS A/S: KEY EXECUTIVES
TABLE 103.DANFOSS A/S: OPERATING SEGMENTS
TABLE 104.DANFOSS A/S: PRODUCT PORTFOLIO
TABLE 105.OVERALL FINANCIAL STATUS ($MILLION)
TABLE 106.DANFOSS A/S: KEY STRATEGIC MOVES AND DEVELOPMENTS
TABLE 107.DANFOSS A/S: SWOT ANALYSIS
TABLE 108.HISAKA WORKS. LTD.: COMPANY SNAPSHOT
TABLE 109.HISAKA WORKS. LTD.: KEY EXECUTIVES
TABLE 110.HISAKA WORKS. LTD.: OPERATING SEGMENTS
TABLE 111.HISAKA WORKS. LTD.: PRODUCT PORTFOLIO
TABLE 112.OVERALL FINANCIAL STATUS ($MILLION)
TABLE 113.HISAKA WORKS. LTD.: KEY STRATEGIC MOVES AND DEVELOPMENTS
TABLE 114.HISAKA WORKS. LTD.: SWOT ANALYSIS
TABLE 115.EXCHANGER INDUSTRIES LIMITED: COMPANY SNAPSHOT
TABLE 116.EXCHANGER INDUSTRIES LIMITED: KEY EXECUTIVES
TABLE 117.EXCHANGER INDUSTRIES LIMITED.: OPERATING SEGMENTS
TABLE 118.EXCHANGER INDUSTRIES LIMITED: PRODUCT PORTFOLIO
TABLE 119.OVERALL FINANCIAL STATUS ($MILLION)
TABLE 120.EXCHANGER INDUSTRIES LIMITED: SWOT ANALYSIS
TABLE 121.KOCH INDUSTRIES, INC: COMPANY SNAPSHOT
TABLE 122.KOCH INDUSTRIES, INC: KEY EXECUTIVES
TABLE 123.KOCH INDUSTRIES, INC: PRODUCT PORTFOLIO
TABLE 124.KOCH INDUSTRIES, INC: SWOT ANALYSIS
TABLE 125.THERMOFIN GMBH: COMPANY SNAPSHOT
TABLE 126.THERMOFIN GMBH: KEY EXECUTIVES
TABLE 127.THERMOFIN GMBH: OPERATING SEGMENTS
TABLE 128.THERMOFIN GMBH: PRODUCT PORTFOLIO
TABLE 129.OVERALL FINANCIAL STATUS ($MILLION)
TABLE 130.THERMOFIN GMBH: KEY STRATEGIC MOVES AND DEVELOPMENTS
TABLE 131.THERMOFIN GMBH: SWOT ANALYSIS
TABLE 132.XYLEM: COMPANY SNAPSHOT
TABLE 133.XYLEM: KEY EXECUTIVES
TABLE 134.XYLEM: OPERATING SEGMENTS
TABLE 135.XYLEM: PRODUCT PORTFOLIO
TABLE 136.OVERALL FINANCIAL STATUS ($MILLION)
TABLE 137.XYLEM: KEY STRATEGIC MOVES AND DEVELOPMENTS
TABLE 138.XYLEM: SWOT ANALYSIS

LIST OF FIGURES

FIGURE 01.GLOBAL HEAT EXCHANGER MARKET SNAPSHOT, BY SEGMENTATION, 2021–2030
FIGURE 02.GLOBAL HEAT EXCHANGER MARKET SNAPSHOT, BY REGION, 2021–2030
FIGURE 03.GLOBAL HEAT EXCHANGER MARKET SEGMENTATION
FIGURE 04.TOP INVESTMENT POCKETS
FIGURE 05.MODERATE BARGAINING POWER OF SUPPLIERS
FIGURE 06.HIGH THREAT OF NEW ENTRANTS
FIGURE 07.LOW THREAT OF SUBSTITUTES
FIGURE 08.MODERATE INTENSITY OF COMPETITIVE RIVALRY
FIGURE 09.MODERATE BARGAINING POWER OF BUYERS
FIGURE 10.GLOBAL HEAT EXCHANGER DYNAMICS
FIGURE 11.PRICING ANALYSIS
FIGURE 12.VALUE CHAIN ANALYSIS
FIGURE 13.GLOBAL HEAT EXCHANGER REVENUE, BY TYPE ($MILLION)
FIGURE 14.MARKET SIZE AND FORECAST, 2020-2030 ($MILLION)
FIGURE 15.MARKET SIZE AND FORECAST, 2020-2030 ($MILLION)
FIGURE 16.MARKET SIZE AND FORECAST, 2020-2030 ($MILLION)
FIGURE 17.MARKET SIZE AND FORECAST, 2020-2030 ($MILLION)
FIGURE 18.MARKET SIZE AND FORECAST, 2020-2030 ($MILLION)
FIGURE 19.GLOBAL HEAT EXCHANGER REVENUE, BY END-USER INDUSTRY ($MILLION)
FIGURE 20.MARKET SIZE AND FORECAST, 2020-2030 ($MILLION)
FIGURE 21.MARKET SIZE AND FORECAST, 2020-2030 ($MILLION)
FIGURE 22.MARKET SIZE AND FORECAST, 2020-2030 ($MILLION)
FIGURE 23.MARKET SIZE AND FORECAST, 2020-2030 ($MILLION)
FIGURE 24.MARKET SIZE AND FORECAST, 2020-2030 ($MILLION)
FIGURE 25.MARKET SIZE AND FORECAST, 2020-2030 ($MILLION)
FIGURE 26.MARKET SIZE AND FORECAST, 2020-2030 ($MILLION)
FIGURE 27.GLOBAL HEAT EXCHANGER MARKET REVENUE, BY MATERIAL OF CONSTRUCTION ($MILLION)
FIGURE 28.MARKET SIZE AND FORECAST, 2020-2030 ($MILLION)
FIGURE 29.MARKET SIZE AND FORECAST, 2020-2030 ($MILLION)
FIGURE 30.MARKET SIZE AND FORECAST, 2020-2030 ($MILLION)
FIGURE 31.MARKET SIZE AND FORECAST, 2020-2030 ($MILLION)
FIGURE 32.GLOBAL HEAT EXCHANGER MARKET REVENUE, BY REGION ($MILLION)
FIGURE 33.U.S. HEAT EXCHANGER MARKET REVENUE, 2020–2030, ($MILLION)
FIGURE 34.CANADA HEAT EXCHANGER MARKET REVENUE, 2020–2030, ($MILLION)
FIGURE 35.MEXICO HEAT EXCHANGER MARKET REVENUE, 2020–2030, ($MILLION)
FIGURE 36.GERMANY HEAT EXCHANGER MARKET REVENUE, 2020–2030, ($MILLION)
FIGURE 37.FRANCE HEAT EXCHANGER MARKET REVENUE, 2020–2030, ($MILLION)
FIGURE 38.ITALY HEAT EXCHANGER MARKET REVENUE, 2020–2030, ($MILLION)
FIGURE 39.SPAIN HEAT EXCHANGER MARKET REVENUE, 2020–2030, ($MILLION)
FIGURE 40.UK HEAT EXCHANGER MARKET REVENUE, 2020–2030, ($MILLION)
FIGURE 41.REST OF EUROPE HEAT EXCHANGER MARKET REVENUE, 2020–2030, ($MILLION)
FIGURE 42.CHINA HEAT EXCHANGER MARKET REVENUE, 2020–2030, ($MILLION)
FIGURE 43.INDIA HEAT EXCHANGER MARKET REVENUE, 2020–2030, ($MILLION)
FIGURE 44.JAPAN HEAT EXCHANGER MARKET REVENUE, 2020–2030, ($MILLION)
FIGURE 45.SOUTH KOREA HEAT EXCHANGER MARKET REVENUE, 2020–2030, ($MILLION)
FIGURE 46.AUSTRALIA HEAT EXCHANGER MARKET REVENUE, 2020–2030, ($MILLION)
FIGURE 47.REST OF ASIA-PACIFIC HEAT EXCHANGER MARKET REVENUE, 2020–2030, ($MILLION)
FIGURE 48.BRAZIL HEAT EXCHANGER MARKET REVENUE, 2020–2030, ($MILLION)
FIGURE 49.SAUDI ARABIA HEAT EXCHANGER MARKET REVENUE, 2020–2030, ($MILLION)
FIGURE 50.SOUTH AFRICA HEAT EXCHANGER MARKET REVENUE, 2020–2030, ($MILLION)
FIGURE 51.REST OF LAMEA HEAT EXCHANGER MARKET REVENUE, 2020–2030, ($MILLION)
FIGURE 52.MARKET PLAYER POSITIONING, 2020
FIGURE 53.COMPANY SHARE ANALYSIS, 2020
FIGURE 54.TOP WINNING STRATEGIES, BY YEAR, 2017–2021
FIGURE 55.TOP WINNING STRATEGIES, BY DEVELOPMENT, 2017–2021 (%)
FIGURE 56.TOP WINNING STRATEGIES, BY COMPANY, 2017–2021
FIGURE 57.PRODUCT MAPPING OF TOP 10 PLAYERS
FIGURE 58.COMPETITIVE HEATMAP OF KEY PLAYERS
FIGURE 59.ACCESSEN GROUP: REVENUE, 2018-2020 ($MILLION)
FIGURE 60.ACCESSEN GROUP: REVENUE SHARE BY SEGMENT, 2020 (%)
FIGURE 61.ACCESSEN GROUP: REVENUE SHARE BY REGION, 2020 (%)
FIGURE 62.API HEAT TRANSFER: REVENUE, 2018-2020 ($MILLION)
FIGURE 63.API HEAT TRANSFER: REVENUE SHARE BY SEGMENT, 2020 (%)
FIGURE 64.API HEAT TRANSFER: REVENUE SHARE BY REGION, 2020 (%)
FIGURE 65.CHART INDUSTRIES.: NET SALES, 2018–2020 ($MILLION)
FIGURE 66.CHART INDUSTRIES.: REVENUE SHARE, BY SEGMENT, 2020 (%)
FIGURE 67.CHART INDUSTRIES.: REVENUE SHARE, BY REGION, 2020 (%)
FIGURE 68.DANFOSS A/S: NET SALES, 2018–2020 ($MILLION)
FIGURE 69.DANFOSS A/S: REVENUE SHARE BY SEGMENT, 2020 (%)
FIGURE 70.DANFOSS A/S: REVENUE SHARE BY REGION, 2020 (%)
FIGURE 71.HISAKA WORKS. LTD.: REVENUE, 2018-2020 ($MILLION)
FIGURE 72.HISAKA WORKS. LTD.: REVENUE SHARE BY SEGMENT, 2020 (%)
FIGURE 73.HISAKA WORKS. LTD.: REVENUE SHARE BY REGION, 2020 (%)
FIGURE 74.EXCHANGER INDUSTRIES LIMITED: NET SALES, 2018–2020 ($MILLION)
FIGURE 75.EXCHANGER INDUSTRIES LIMITED: REVENUE SHARE, BY SEGMENT, 2020 (%)
FIGURE 76.EXCHANGER INDUSTRIES LIMITED: REVENUE SHARE, BY REGION, 2020 (%)
FIGURE 77.THERMOFIN GMBH.: NET SALES, 2018–2020 ($MILLION)
FIGURE 78.THERMOFIN GMBH: REVENUE SHARE BY SEGMENT, 2020 (%)
FIGURE 79.XYLEM: REVENUE, 2018–2020 ($MILLION)
FIGURE 80.XYLEM: REVENUE SHARE BY SEGMENT, 2020(%)
FIGURE 81.XYLEM: REVENUE SHARE BY REGION, 2020 (%)


The global heat exchanger market has registered a dynamic growth over the past few years, owing to drastic growth in automotive, pharmaceutical, oil & gas, chemical, petrochemical, and food & beverages industries. In addition, huge investment plans with respect to oil & gas upstream activities led to rise in demand for heat exchangers across the globe. Moreover, heat exchanger plays a vital role in the automotive industry and rise in demand for radiator in automobiles may led to increase in demand for heat exchanger. This is expected to act as the major driving factor for the market. Furthermore, heat exchanger can operate in the long term and are energy-efficient with low maintenance costs. Heat exchanger has high working pressure & temperatures with high security in aseptic processes and it is easy to inspect and disassemble & enlarge. However, rise in industrialization & infrastructure development also led to increase in demand for heat exchanger system. According to the U.S. Energy Information Administration (EIA), the U.S. produced an average of around 11.3 million barrels per day of crude oil in 2021 and 4.3 million barrels per day of other non-crude petroleum liquids. The U.S. government and businesses have heavily invested to increase the extraction of crude oil, which in turn is anticipated to fuel the demand for heat exchanger in the oil & gas industry, thus driving the growth of the heat exchanger market during the forecast period.

PURCHASE OPTIONS

Call or Email us

U.S.-Canada Toll-free: +1-800-792-5285
Int'l : +1-503-894-6022
Europe : +44-845-528-1300
Email : help@alliedmarketresearch.com
 
FREQUENTLY ASKED QUESTIONS?

A. Agreement, business expansion and product launch are the key growth strategy of global heat exchanger market players.

A. North America and LAMEA will provide more business opportunities for global heat exchanger in future

A. To get latest version of heat exchanger market report can be obtained on demand from the website.

A. Chemical segment holds the maximum share of the global heat exchanger market

A. Chemical, petrochemical, oil & gas, HVACR, food & beverage and power generation industries are the major customers of global heat exchanger market.

A. The top ten market players are selected based on two key attributes - competitive strength and market positioning

A. Growth in oil & gas demand and rising industrialization in developing economies are the major driving factors for the global heat exchanger market. In addition, rapid expansion of nuclear power plants and rising demand of petrochemicals creates the ample of opportunities for the Heat Exchanger Market.

A. Accessen Group, Alfa Laval, API Heat Transfer, Chart Industries., Danfoss A/S, Hisaka Works. Ltd., Exchanger Industries Limited, Koch Industries, Inc, Thermofin Gmbh, and Xylem are the leading market players active in the heat exchanger market.

A. Need for refurbishing HVAC systems and increasing adoption of heat transfer equipment for heat recovery, process cooling are key applications to drive the adoption of heat exchanger

A. Technological evolution of heat exchangers, increasing cooling and heating needs and rise in Heating, ventilation, air conditioning and refrigeration (HVACR) deployment and other industrial activities, surging energy prices, and rapid industrial expansion are the current trend expected to influence the global heat exchanger market in the next few years

Looking for Customization?

 Customization Request

Have a Question?

 Speak with Analyst

Any Confusion?

 Inquire Before Buying

Have a glance of the Report

  Request Sample
RELATED TAGS

Purchase Full Report of
Heat Exchanger Market

Start reading instantly.
This Report and over 67,404+ more Reports, Available with Avenue Library. T&C*.

  • Online Only
  • $3,456
  • Online cloud access only
  • Restricted print, copy, paste & download
  • Read only
  • Free industry update
    (Within 180 days)
  • Free report update in next update cycle
    (Feb 2023 - Feb 2024)
  • Data Pack
  • $3,840
  • Restricted to one authorized user
  • One print only
  • Available in
    Excel
  • Free industry update
    (Within 180 days)
  •   Free report update in next update cycle
    (Feb 2023 - Feb 2024)
  • Single User
  • $5,769
  • Restricted to one authorized user
  • One print only
  • Available in
    PDF
  • Free industry update
    (Within 180 days)
  •   Free report update in next update cycle
    (Feb 2023 - Feb 2024)
  • Five Users
  • $6,450
  • Limited to five authorized users
  • Print upto five copies
  • Available in
    PDF
  • Free industry update
    (Within 180 days)
  •   Free report update in next update cycle
    (Feb 2023 - Feb 2024)
  • Enterprise
    License/PDF

  • $10,995
  • Unlimited
    within
    company/enterprise
  • Available in Excel & PDF
  • Free industry update
    (Within 180 days)
  •   Free report update in next update cycle
    (Feb 2023 - Feb 2024)
  • Library
    Membership

  • $999 $ 1,175
    Per User/ Per month/ Billed annually
  • Published Content
    E-access
  • Company Profiles
    E-access
  • Newly Added Content Access
  • 10 PDF
    Downloads
  • 5 Excel Data
    Pack Downloads
  • 250 Company Profiles PDF Downloads
  • Buy Now

*Taxes/Fees, if applicable will be added during checkout. All prices in USD

RELATED REPORTS
 

Why Allied Market Research?


Infallible Methodology

To ensure high-level data integrity, accurate analysis, and impeccable forecasts

Analyst Support

For complete satisfaction

Customization

On-demand customization of scope of the report to exactly meet your needs

TARGETED MARKET VIEW

Targeted market view to provide pertinent information and save time of readers

Get fresh content delivered

Get insights on topics that are crucial for your business. Stay abreast of your interest areas.

Get Industry Data Alerts

Why Allied Market Research?

Infallible Methodology

To ensure high-level data integrity, accurate analysis, and impeccable forecasts

Analyst Support

For complete satisfaction

Customization

On-demand customization of scope of the report to exactly meet your needs

TARGETED MARKET VIEW

Targeted market view to provide pertinent information and save time of readers