0
2022
Ice Cream Market

Ice Cream Market

by Product Type (Impulse Ice Cream, Take Home Ice Cream, Artisanal Ice Cream), by Flavor (Vanilla, Chocolate, Fruit, Others), by Distribution Channel (Supermarkets And Hypermarkets, Convenience Stores, Specialty Stores, Online Sales Channel): Global Opportunity Analysis and Industry Forecast, 2020-2031

✷  Report Code: A02041
Mar 2022 | Pages: 220
Tables: 147
Charts: 60
  • Formats*:

  • pdf

    Single User License, Five User
    License & Enterprise User License

  • xls

    Data Pack Excel License

  • ppt

    It comes with the additional cost
    of $2500.00 contact sales.


Ice Cream Market Research, 2031

The global ice cream market was valued at $68,052.20 million in 2020, and is projected to reach $122,051.10 million by 2031, growing at a CAGR of 5% from 2022 to 2031.

Ice cream is a dairy product, which is sweetened with either natural sugar or artificial sweeteners. Various ice creams are provided by the companies present in the market, including hard ice cream, soft ice cream, light ice cream, low-fat ice cream, and others. Summer is an undisputed season for the consumption of ice cream and related products. The growth of the ice cream industry is driven by the availability of various flavored ice creams. As a result, the ice cream consumers pay a premium price for these products, which in turn increases the revenue of the market.

The impact of COVID-19 on the growth of the ice cream market was quite negative, owing to supply chain disruptions and lockdown restrictions.

Manufacturers are increasing their product range by including functional ingredients, organic herbal fillings, and exotic flavors in product formulations to meet the changing consumers’ demands. For instance, companies are including other exotic flavors such as tropical fruits, lemons, and coconuts to cater to changing taste of consumers. In addition, health-conscious customers prefer a low-calorie and low-fat ice cream called Skinny Cow. In this way, product innovation in ice cream products drives the growth and development of the market globally. Apart from this, retail channels such as hypermarkets, supermarkets, convenience stores, discounters, forecourt retailers, and grocery stores act as global marketing tool that assist in building an impressive premium image and increase brand exposure of wide variety of ice cream products. Expansion of these retail channels contributes to the growth of ice cream market size. However, the health concerns associated with ice creams restrain the ice cream market growth. Furthermore, rise in demand for innovative products and development of lactose-free ice cream provide growth opportunities for ice cream market size expansion.

The global ice cream market is segmented on the basis of product type, flavor, distribution channel, and region. On the basis of product type, the ice cream market is categorized into impulse ice cream, take-home ice cream, and artisanal ice cream. On the basis of flavor, the market is divided into vanilla, chocolate, fruit, and others. On the basis of distribution channel, it is categorized into supermarkets and hypermarkets, convenience stores, specialty stores, and online sales channel. On the basis of region, the market is analyzed across North America, Europe, Asia-Pacific, and LAMEA.
Ice Cream Market

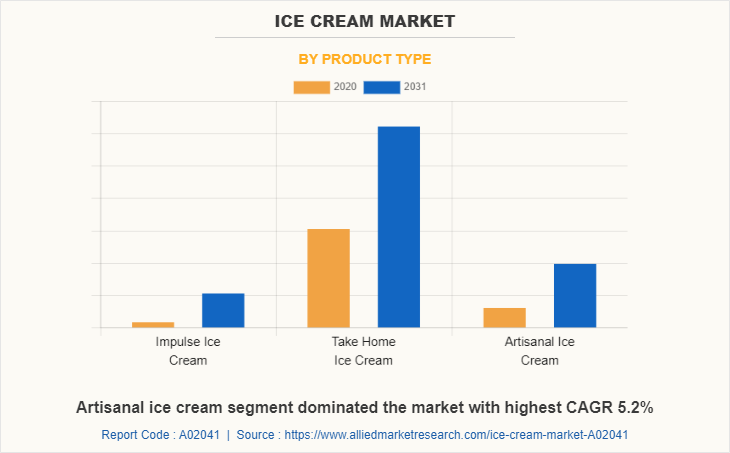
By product type, the impulse ice cream segment is the most lucrative in the global ice cream market, as it is easy to carry and owing to rising popularity of impulse ice cream globally. This kind of ice cream is in high demand, especially by children and teenagers.
Ice Cream Market

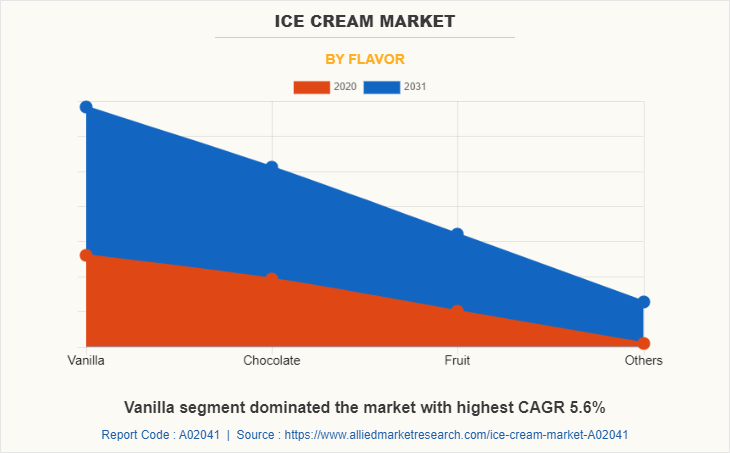
By flavor, the vanilla segment is dominating the market with the largest market share. This is attributed to surge in demand for vanilla ice creams. The vanilla ice cream is a traditional form of ice cream liked by people of all age groups.
Ice Cream Market

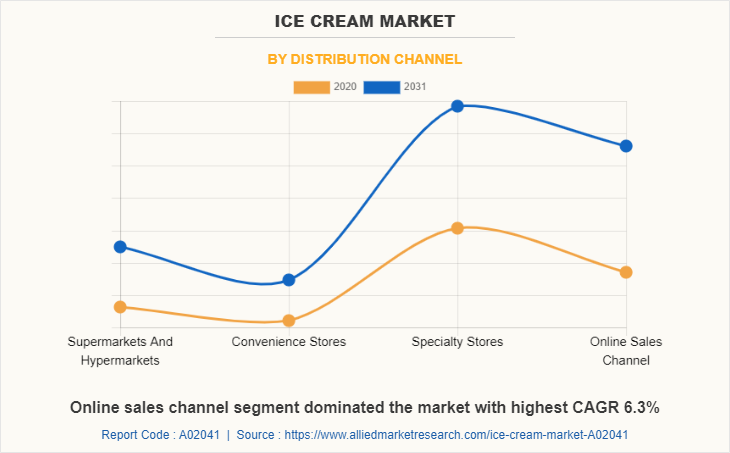
The online sales channel is the fastest growing segment in the global ice cream market. This is due to increase in internet penetration and rise in usage of smartphones. In addition, online sales channel provides benefits such as discounts and free home delivery.
Ice Cream Market

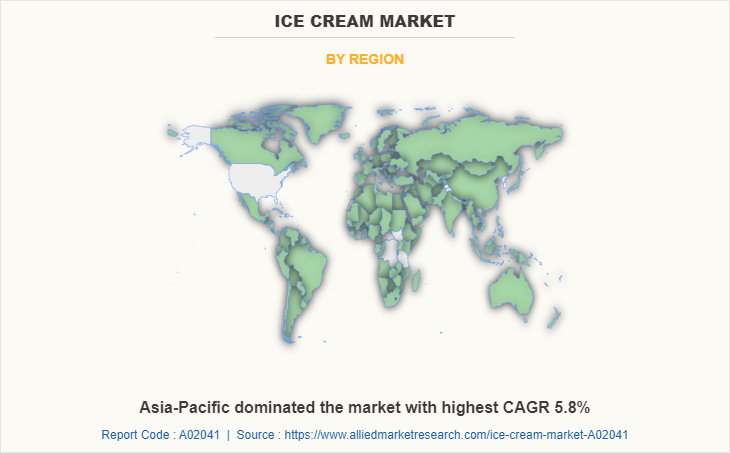
Asia-Pacific is expected to witness the highest growth rate, owing to rise in demand from the emerging economies such as India, China, Indonesia, and others. Moreover, increased disposable income and rise in standard of living boost the growth of market. India and China are projected to witness significant growth during the ice cream market forecast period.

Australia is the most attractive market for ice cream manufactures. Ice cream market in Australia is approximately 10% of the overall country’s food industry. Sweden and the UK are the attractive markets for ice cream from European region, owing to growing regional demand.

Product innovation, economic growth, rise in disposable income, and retail market expansion are expected to have high impact on ice cream market. Product innovation will diversify the offerings and assist in meeting varying consumer demands while economic growth will continue to increase the spending power of customers.

Consumers consider ice cream as snack and it is one of the main reasons for the growing consumption of take-home segment. In 2020, the take-home segment accounted for the highest share, growing at a CAGR of 4.9% from 2022 to 2031. The growth is also projected because of increased disposable income, the introduction of new flavors from the manufacturers, and increased consumption of ice-cream as a snack option boosts the market for ice cream products.

LAMEA is also expected to show decent growth over the forecast period owing to rising demand for ice creams from younger demographics and emerging middle class. The LAMEA region accounted for one-sixth of the global ice cream market in 2020 and is projected to witness a CAGR of 5.3% from 2022 to 2031. Brazil accounted for approximately 50% of the LAMEA ice cream market share. The prolonged summer season in the LAMEA region is also expected to drive the demand for ice creams in countries such as South Africa, Saudi Arabia and others.

The key players profiled in the ice cream market report include Unilever Group Nestle S.A., General Mills, Inc., Mars, Blue Bell Creameries, Lotte Confectionery, Wells Dairy Inc., Turkey Hill, Mihan Dairy Inc., and Meiji Holdings Co. Ltd.

The other key market players (not profiled in this report) in the value chain include United Kaipara Dairies Company, Pure Ice Cream Company, International Foodstuffs Co., Baskin-Robbins, Cold Stone Creamery, and International Dairy Queen, Inc.

Key Benefits For Stakeholders

  • This report provides a quantitative analysis of the market segments, current trends, estimations, and dynamics of the ice cream market analysis from 2020 to 2031 to identify the prevailing ice cream market opportunities.
  • The market research is offered along with information related to key drivers, restraints, and opportunities.
  • Porter's five forces analysis highlights the potency of buyers and suppliers to enable stakeholders make profit-oriented business decisions and strengthen their supplier-buyer network.
  • In-depth analysis of the ice cream market segmentation assists to determine the prevailing market opportunities.
  • Major countries in each region are mapped according to their revenue contribution to the global market.
  • Market player positioning facilitates benchmarking and provides a clear understanding of the present position of the market players.
  • The report includes the analysis of the regional as well as global ice cream market trends, key players, market segments, application areas, and market growth strategies.

Ice Cream Market Report Highlights

Aspects Details
By Product Type
  • Impulse Ice Cream
  • Take Home Ice Cream
  • Artisanal Ice Cream
By Flavor
  • Vanilla
  • Chocolate
  • Fruit
  • Others
By Distribution Channel
  • Supermarkets And Hypermarkets
  • Convenience Stores
  • Specialty Stores
  • Online Sales Channel
By Region
  • North America  (U.S., Canada, Mexico)
  • Europe  (Finland, Sweden, Ireland, Denmark, Italy, U.K., Rest of Europe)
  • Asia-Pacific  (New Zealand, Australia, Rest of Asia-Pacific)
  • LAMEA  (Brazil, Argentina, South Africa, UAE, Rest of LAMEA)
Key Market Players Mars, Turkey Hill, Mihan Dairy Inc., Wells Dairy Inc., Blue Bell Creameries, Meiji Holdings Co. Ltd, Nestle S.A., Unilever Group, General Mills, Inc., Lotte Confectionery
 
  • CHAPTER 1:INTRODUCTION

    • 1.1.Report description

    • 1.2.Key market segments

    • 1.3.Key benefits to the stakeholders

    • 1.4.Research Methodology

      • 1.4.1.Secondary research

      • 1.4.2.Primary research

      • 1.4.3.Analyst tools and models

  • CHAPTER 2:EXECUTIVE SUMMARY

    • 2.1.Key findings of the study

    • 2.2.CXO Perspective

  • CHAPTER 3:MARKET OVERVIEW

    • 3.1.Market definition and scope

    • 3.2.Key findings

      • 3.2.1.Top investment pockets

    • 3.3.Porter’s five forces analysis

    • 3.4.Top player positioning

    • 3.5.Market dynamics

      • 3.5.1.Drivers

      • 3.5.2.Restraints

      • 3.5.3.Opportunities

    • 3.6.COVID-19 Impact Analysis on the market

    • 3.7.Regulatory Guidelines

  • CHAPTER 4: ICE CREAM MARKET, BY PRODUCT TYPE

    • 4.1 Overview

      • 4.1.1 Market size and forecast

    • 4.2 Impulse Ice Cream

      • 4.2.1 Key market trends, growth factors and opportunities

      • 4.2.2 Market size and forecast, by region

      • 4.2.3 Market analysis by country

    • 4.3 Take Home Ice Cream

      • 4.3.1 Key market trends, growth factors and opportunities

      • 4.3.2 Market size and forecast, by region

      • 4.3.3 Market analysis by country

    • 4.4 Artisanal Ice Cream

      • 4.4.1 Key market trends, growth factors and opportunities

      • 4.4.2 Market size and forecast, by region

      • 4.4.3 Market analysis by country

  • CHAPTER 5: ICE CREAM MARKET, BY FLAVOR

    • 5.1 Overview

      • 5.1.1 Market size and forecast

    • 5.2 Vanilla

      • 5.2.1 Key market trends, growth factors and opportunities

      • 5.2.2 Market size and forecast, by region

      • 5.2.3 Market analysis by country

    • 5.3 Chocolate

      • 5.3.1 Key market trends, growth factors and opportunities

      • 5.3.2 Market size and forecast, by region

      • 5.3.3 Market analysis by country

    • 5.4 Fruit

      • 5.4.1 Key market trends, growth factors and opportunities

      • 5.4.2 Market size and forecast, by region

      • 5.4.3 Market analysis by country

    • 5.5 Others

      • 5.5.1 Key market trends, growth factors and opportunities

      • 5.5.2 Market size and forecast, by region

      • 5.5.3 Market analysis by country

  • CHAPTER 6: ICE CREAM MARKET, BY DISTRIBUTION CHANNEL

    • 6.1 Overview

      • 6.1.1 Market size and forecast

    • 6.2 Supermarkets And Hypermarkets

      • 6.2.1 Key market trends, growth factors and opportunities

      • 6.2.2 Market size and forecast, by region

      • 6.2.3 Market analysis by country

    • 6.3 Convenience Stores

      • 6.3.1 Key market trends, growth factors and opportunities

      • 6.3.2 Market size and forecast, by region

      • 6.3.3 Market analysis by country

    • 6.4 Specialty Stores

      • 6.4.1 Key market trends, growth factors and opportunities

      • 6.4.2 Market size and forecast, by region

      • 6.4.3 Market analysis by country

    • 6.5 Online Sales Channel

      • 6.5.1 Key market trends, growth factors and opportunities

      • 6.5.2 Market size and forecast, by region

      • 6.5.3 Market analysis by country

  • CHAPTER 7: ICE CREAM MARKET, BY REGION

    • 7.1 Overview

      • 7.1.1 Market size and forecast

    • 7.2 North America

      • 7.2.1 Key trends and opportunities

      • 7.2.2 North America Market size and forecast, by Product Type

      • 7.2.3 North America Market size and forecast, by Flavor

      • 7.2.4 North America Market size and forecast, by Distribution Channel

      • 7.2.5 North America Market size and forecast, by country

        • 7.2.5.1 U.S.
          • 7.2.5.1.1 Market size and forecast, by Product Type
          • 7.2.5.1.2 Market size and forecast, by Flavor
          • 7.2.5.1.3 Market size and forecast, by Distribution Channel
        • 7.2.5.2 Canada
          • 7.2.5.2.1 Market size and forecast, by Product Type
          • 7.2.5.2.2 Market size and forecast, by Flavor
          • 7.2.5.2.3 Market size and forecast, by Distribution Channel
        • 7.2.5.3 Mexico
          • 7.2.5.3.1 Market size and forecast, by Product Type
          • 7.2.5.3.2 Market size and forecast, by Flavor
          • 7.2.5.3.3 Market size and forecast, by Distribution Channel
    • 7.3 Europe

      • 7.3.1 Key trends and opportunities

      • 7.3.2 Europe Market size and forecast, by Product Type

      • 7.3.3 Europe Market size and forecast, by Flavor

      • 7.3.4 Europe Market size and forecast, by Distribution Channel

      • 7.3.5 Europe Market size and forecast, by country

        • 7.3.5.1 Finland
          • 7.3.5.1.1 Market size and forecast, by Product Type
          • 7.3.5.1.2 Market size and forecast, by Flavor
          • 7.3.5.1.3 Market size and forecast, by Distribution Channel
        • 7.3.5.2 Sweden
          • 7.3.5.2.1 Market size and forecast, by Product Type
          • 7.3.5.2.2 Market size and forecast, by Flavor
          • 7.3.5.2.3 Market size and forecast, by Distribution Channel
        • 7.3.5.3 Ireland
          • 7.3.5.3.1 Market size and forecast, by Product Type
          • 7.3.5.3.2 Market size and forecast, by Flavor
          • 7.3.5.3.3 Market size and forecast, by Distribution Channel
        • 7.3.5.4 Denmark
          • 7.3.5.4.1 Market size and forecast, by Product Type
          • 7.3.5.4.2 Market size and forecast, by Flavor
          • 7.3.5.4.3 Market size and forecast, by Distribution Channel
        • 7.3.5.5 Italy
          • 7.3.5.5.1 Market size and forecast, by Product Type
          • 7.3.5.5.2 Market size and forecast, by Flavor
          • 7.3.5.5.3 Market size and forecast, by Distribution Channel
        • 7.3.5.6 U.K.
          • 7.3.5.6.1 Market size and forecast, by Product Type
          • 7.3.5.6.2 Market size and forecast, by Flavor
          • 7.3.5.6.3 Market size and forecast, by Distribution Channel
        • 7.3.5.7 Rest of Europe
          • 7.3.5.7.1 Market size and forecast, by Product Type
          • 7.3.5.7.2 Market size and forecast, by Flavor
          • 7.3.5.7.3 Market size and forecast, by Distribution Channel
    • 7.4 Asia-Pacific

      • 7.4.1 Key trends and opportunities

      • 7.4.2 Asia-Pacific Market size and forecast, by Product Type

      • 7.4.3 Asia-Pacific Market size and forecast, by Flavor

      • 7.4.4 Asia-Pacific Market size and forecast, by Distribution Channel

      • 7.4.5 Asia-Pacific Market size and forecast, by country

        • 7.4.5.1 New Zealand
          • 7.4.5.1.1 Market size and forecast, by Product Type
          • 7.4.5.1.2 Market size and forecast, by Flavor
          • 7.4.5.1.3 Market size and forecast, by Distribution Channel
        • 7.4.5.2 Australia
          • 7.4.5.2.1 Market size and forecast, by Product Type
          • 7.4.5.2.2 Market size and forecast, by Flavor
          • 7.4.5.2.3 Market size and forecast, by Distribution Channel
        • 7.4.5.3 Rest of Asia-Pacific
          • 7.4.5.3.1 Market size and forecast, by Product Type
          • 7.4.5.3.2 Market size and forecast, by Flavor
          • 7.4.5.3.3 Market size and forecast, by Distribution Channel
    • 7.5 LAMEA

      • 7.5.1 Key trends and opportunities

      • 7.5.2 LAMEA Market size and forecast, by Product Type

      • 7.5.3 LAMEA Market size and forecast, by Flavor

      • 7.5.4 LAMEA Market size and forecast, by Distribution Channel

      • 7.5.5 LAMEA Market size and forecast, by country

        • 7.5.5.1 Brazil
          • 7.5.5.1.1 Market size and forecast, by Product Type
          • 7.5.5.1.2 Market size and forecast, by Flavor
          • 7.5.5.1.3 Market size and forecast, by Distribution Channel
        • 7.5.5.2 Argentina
          • 7.5.5.2.1 Market size and forecast, by Product Type
          • 7.5.5.2.2 Market size and forecast, by Flavor
          • 7.5.5.2.3 Market size and forecast, by Distribution Channel
        • 7.5.5.3 South Africa
          • 7.5.5.3.1 Market size and forecast, by Product Type
          • 7.5.5.3.2 Market size and forecast, by Flavor
          • 7.5.5.3.3 Market size and forecast, by Distribution Channel
        • 7.5.5.4 UAE
          • 7.5.5.4.1 Market size and forecast, by Product Type
          • 7.5.5.4.2 Market size and forecast, by Flavor
          • 7.5.5.4.3 Market size and forecast, by Distribution Channel
        • 7.5.5.5 Rest of LAMEA
          • 7.5.5.5.1 Market size and forecast, by Product Type
          • 7.5.5.5.2 Market size and forecast, by Flavor
          • 7.5.5.5.3 Market size and forecast, by Distribution Channel
  • CHAPTER 8: COMPANY LANDSCAPE

    • 8.1. Introduction

    • 8.2. Top winning strategies

    • 8.3. Product Mapping of Top 10 Player

    • 8.4. Competitive Dashboard

    • 8.5. Competitive Heatmap

    • 8.6. Key developments

  • CHAPTER 9: COMPANY PROFILES

    • 9.1 Unilever Group

      • 9.1.1 Company overview

      • 9.1.2 Company snapshot

      • 9.1.3 Operating business segments

      • 9.1.4 Product portfolio

      • 9.1.5 Business performance

      • 9.1.6 Key strategic moves and developments

    • 9.2 Nestle S.A.

      • 9.2.1 Company overview

      • 9.2.2 Company snapshot

      • 9.2.3 Operating business segments

      • 9.2.4 Product portfolio

      • 9.2.5 Business performance

      • 9.2.6 Key strategic moves and developments

    • 9.3 General Mills, Inc.

      • 9.3.1 Company overview

      • 9.3.2 Company snapshot

      • 9.3.3 Operating business segments

      • 9.3.4 Product portfolio

      • 9.3.5 Business performance

      • 9.3.6 Key strategic moves and developments

    • 9.4 Mars

      • 9.4.1 Company overview

      • 9.4.2 Company snapshot

      • 9.4.3 Operating business segments

      • 9.4.4 Product portfolio

      • 9.4.5 Business performance

      • 9.4.6 Key strategic moves and developments

    • 9.5 Blue Bell Creameries

      • 9.5.1 Company overview

      • 9.5.2 Company snapshot

      • 9.5.3 Operating business segments

      • 9.5.4 Product portfolio

      • 9.5.5 Business performance

      • 9.5.6 Key strategic moves and developments

    • 9.6 Lotte Confectionery

      • 9.6.1 Company overview

      • 9.6.2 Company snapshot

      • 9.6.3 Operating business segments

      • 9.6.4 Product portfolio

      • 9.6.5 Business performance

      • 9.6.6 Key strategic moves and developments

    • 9.7 Wells Dairy Inc.

      • 9.7.1 Company overview

      • 9.7.2 Company snapshot

      • 9.7.3 Operating business segments

      • 9.7.4 Product portfolio

      • 9.7.5 Business performance

      • 9.7.6 Key strategic moves and developments

    • 9.8 Turkey Hill

      • 9.8.1 Company overview

      • 9.8.2 Company snapshot

      • 9.8.3 Operating business segments

      • 9.8.4 Product portfolio

      • 9.8.5 Business performance

      • 9.8.6 Key strategic moves and developments

    • 9.9 Mihan Dairy Inc.

      • 9.9.1 Company overview

      • 9.9.2 Company snapshot

      • 9.9.3 Operating business segments

      • 9.9.4 Product portfolio

      • 9.9.5 Business performance

      • 9.9.6 Key strategic moves and developments

    • 9.10 Meiji Holdings Co. Ltd

      • 9.10.1 Company overview

      • 9.10.2 Company snapshot

      • 9.10.3 Operating business segments

      • 9.10.4 Product portfolio

      • 9.10.5 Business performance

      • 9.10.6 Key strategic moves and developments

  • LIST OF TABLES

    • TABLE 1. GLOBAL ICE CREAM MARKET, BY PRODUCT TYPE, 2020-2031,($MILLION)
    • TABLE 2. ICE CREAM MARKET REVENUE, FOR IMPULSE ICE CREAM, BY REGION , 2020-2031,($MILLION)
    • TABLE 3. ICE CREAM MARKET IMPULSE ICE CREAM BY COUNTRY, 2020-2031,($MILLION)
    • TABLE 4. ICE CREAM MARKET REVENUE, FOR TAKE HOME ICE CREAM, BY REGION , 2020-2031,($MILLION)
    • TABLE 5. ICE CREAM MARKET TAKE HOME ICE CREAM BY COUNTRY, 2020-2031,($MILLION)
    • TABLE 6. ICE CREAM MARKET REVENUE, FOR ARTISANAL ICE CREAM, BY REGION , 2020-2031,($MILLION)
    • TABLE 7. ICE CREAM MARKET ARTISANAL ICE CREAM BY COUNTRY, 2020-2031,($MILLION)
    • TABLE 8. GLOBAL ICE CREAM MARKET, BY FLAVOR, 2020-2031,($MILLION)
    • TABLE 9. ICE CREAM MARKET REVENUE, FOR VANILLA, BY REGION , 2020-2031,($MILLION)
    • TABLE 10. ICE CREAM MARKET VANILLA BY COUNTRY, 2020-2031,($MILLION)
    • TABLE 11. ICE CREAM MARKET REVENUE, FOR CHOCOLATE, BY REGION , 2020-2031,($MILLION)
    • TABLE 12. ICE CREAM MARKET CHOCOLATE BY COUNTRY, 2020-2031,($MILLION)
    • TABLE 13. ICE CREAM MARKET REVENUE, FOR FRUIT, BY REGION , 2020-2031,($MILLION)
    • TABLE 14. ICE CREAM MARKET FRUIT BY COUNTRY, 2020-2031,($MILLION)
    • TABLE 15. ICE CREAM MARKET REVENUE, FOR OTHERS, BY REGION , 2020-2031,($MILLION)
    • TABLE 16. ICE CREAM MARKET OTHERS BY COUNTRY, 2020-2031,($MILLION)
    • TABLE 17. GLOBAL ICE CREAM MARKET, BY DISTRIBUTION CHANNEL, 2020-2031,($MILLION)
    • TABLE 18. ICE CREAM MARKET REVENUE, FOR SUPERMARKETS AND HYPERMARKETS, BY REGION , 2020-2031,($MILLION)
    • TABLE 19. ICE CREAM MARKET SUPERMARKETS AND HYPERMARKETS BY COUNTRY, 2020-2031,($MILLION)
    • TABLE 20. ICE CREAM MARKET REVENUE, FOR CONVENIENCE STORES, BY REGION , 2020-2031,($MILLION)
    • TABLE 21. ICE CREAM MARKET CONVENIENCE STORES BY COUNTRY, 2020-2031,($MILLION)
    • TABLE 22. ICE CREAM MARKET REVENUE, FOR SPECIALTY STORES, BY REGION , 2020-2031,($MILLION)
    • TABLE 23. ICE CREAM MARKET SPECIALTY STORES BY COUNTRY, 2020-2031,($MILLION)
    • TABLE 24. ICE CREAM MARKET REVENUE, FOR ONLINE SALES CHANNEL, BY REGION , 2020-2031,($MILLION)
    • TABLE 25. ICE CREAM MARKET ONLINE SALES CHANNEL BY COUNTRY, 2020-2031,($MILLION)
    • TABLE 26. ICE CREAM MARKET, BY REGION, 2020-2031,($MILLION)
    • TABLE 27. NORTH AMERICA ICE CREAM MARKET, BY PRODUCT TYPE, 2020-2031,($MILLION)
    • TABLE 28. NORTH AMERICA ICE CREAM MARKET, BY FLAVOR, 2020-2031,($MILLION)
    • TABLE 29. NORTH AMERICA ICE CREAM MARKET, BY DISTRIBUTION CHANNEL, 2020-2031,($MILLION)
    • TABLE 30. NORTH AMERICA ICE CREAM MARKET, BY COUNTRY, 2020-2031,($MILLION)
    • TABLE 31. U.S. ICE CREAM MARKET BY PRODUCT TYPE 2020-2031,($MILLION)
    • TABLE 32. U.S. ICE CREAM MARKET BY FLAVOR 2020-2031,($MILLION)
    • TABLE 33. U.S. ICE CREAM MARKET BY DISTRIBUTION CHANNEL 2020-2031,($MILLION)
    • TABLE 34. CANADA ICE CREAM MARKET BY PRODUCT TYPE 2020-2031,($MILLION)
    • TABLE 35. CANADA ICE CREAM MARKET BY FLAVOR 2020-2031,($MILLION)
    • TABLE 36. CANADA ICE CREAM MARKET BY DISTRIBUTION CHANNEL 2020-2031,($MILLION)
    • TABLE 37. MEXICO ICE CREAM MARKET BY PRODUCT TYPE 2020-2031,($MILLION)
    • TABLE 38. MEXICO ICE CREAM MARKET BY FLAVOR 2020-2031,($MILLION)
    • TABLE 39. MEXICO ICE CREAM MARKET BY DISTRIBUTION CHANNEL 2020-2031,($MILLION)
    • TABLE 40. EUROPE ICE CREAM MARKET, BY PRODUCT TYPE, 2020-2031,($MILLION)
    • TABLE 41. EUROPE ICE CREAM MARKET, BY FLAVOR, 2020-2031,($MILLION)
    • TABLE 42. EUROPE ICE CREAM MARKET, BY DISTRIBUTION CHANNEL, 2020-2031,($MILLION)
    • TABLE 43. EUROPE ICE CREAM MARKET, BY COUNTRY, 2020-2031,($MILLION)
    • TABLE 44. FINLAND ICE CREAM MARKET BY PRODUCT TYPE 2020-2031,($MILLION)
    • TABLE 45. FINLAND ICE CREAM MARKET BY FLAVOR 2020-2031,($MILLION)
    • TABLE 46. FINLAND ICE CREAM MARKET BY DISTRIBUTION CHANNEL 2020-2031,($MILLION)
    • TABLE 47. SWEDEN ICE CREAM MARKET BY PRODUCT TYPE 2020-2031,($MILLION)
    • TABLE 48. SWEDEN ICE CREAM MARKET BY FLAVOR 2020-2031,($MILLION)
    • TABLE 49. SWEDEN ICE CREAM MARKET BY DISTRIBUTION CHANNEL 2020-2031,($MILLION)
    • TABLE 50. IRELAND ICE CREAM MARKET BY PRODUCT TYPE 2020-2031,($MILLION)
    • TABLE 51. IRELAND ICE CREAM MARKET BY FLAVOR 2020-2031,($MILLION)
    • TABLE 52. IRELAND ICE CREAM MARKET BY DISTRIBUTION CHANNEL 2020-2031,($MILLION)
    • TABLE 53. DENMARK ICE CREAM MARKET BY PRODUCT TYPE 2020-2031,($MILLION)
    • TABLE 54. DENMARK ICE CREAM MARKET BY FLAVOR 2020-2031,($MILLION)
    • TABLE 55. DENMARK ICE CREAM MARKET BY DISTRIBUTION CHANNEL 2020-2031,($MILLION)
    • TABLE 56. ITALY ICE CREAM MARKET BY PRODUCT TYPE 2020-2031,($MILLION)
    • TABLE 57. ITALY ICE CREAM MARKET BY FLAVOR 2020-2031,($MILLION)
    • TABLE 58. ITALY ICE CREAM MARKET BY DISTRIBUTION CHANNEL 2020-2031,($MILLION)
    • TABLE 59. U.K. ICE CREAM MARKET BY PRODUCT TYPE 2020-2031,($MILLION)
    • TABLE 60. U.K. ICE CREAM MARKET BY FLAVOR 2020-2031,($MILLION)
    • TABLE 61. U.K. ICE CREAM MARKET BY DISTRIBUTION CHANNEL 2020-2031,($MILLION)
    • TABLE 62. REST OF EUROPE ICE CREAM MARKET BY PRODUCT TYPE 2020-2031,($MILLION)
    • TABLE 63. REST OF EUROPE ICE CREAM MARKET BY FLAVOR 2020-2031,($MILLION)
    • TABLE 64. REST OF EUROPE ICE CREAM MARKET BY DISTRIBUTION CHANNEL 2020-2031,($MILLION)
    • TABLE 65. ASIA-PACIFIC ICE CREAM MARKET, BY PRODUCT TYPE, 2020-2031,($MILLION)
    • TABLE 66. ASIA-PACIFIC ICE CREAM MARKET, BY FLAVOR, 2020-2031,($MILLION)
    • TABLE 67. ASIA-PACIFIC ICE CREAM MARKET, BY DISTRIBUTION CHANNEL, 2020-2031,($MILLION)
    • TABLE 68. ASIA-PACIFIC ICE CREAM MARKET, BY COUNTRY, 2020-2031,($MILLION)
    • TABLE 69. NEW ZEALAND ICE CREAM MARKET BY PRODUCT TYPE 2020-2031,($MILLION)
    • TABLE 70. NEW ZEALAND ICE CREAM MARKET BY FLAVOR 2020-2031,($MILLION)
    • TABLE 71. NEW ZEALAND ICE CREAM MARKET BY DISTRIBUTION CHANNEL 2020-2031,($MILLION)
    • TABLE 72. AUSTRALIA ICE CREAM MARKET BY PRODUCT TYPE 2020-2031,($MILLION)
    • TABLE 73. AUSTRALIA ICE CREAM MARKET BY FLAVOR 2020-2031,($MILLION)
    • TABLE 74. AUSTRALIA ICE CREAM MARKET BY DISTRIBUTION CHANNEL 2020-2031,($MILLION)
    • TABLE 75. REST OF ASIA-PACIFIC ICE CREAM MARKET BY PRODUCT TYPE 2020-2031,($MILLION)
    • TABLE 76. REST OF ASIA-PACIFIC ICE CREAM MARKET BY FLAVOR 2020-2031,($MILLION)
    • TABLE 77. REST OF ASIA-PACIFIC ICE CREAM MARKET BY DISTRIBUTION CHANNEL 2020-2031,($MILLION)
    • TABLE 78. LAMEA ICE CREAM MARKET, BY PRODUCT TYPE, 2020-2031,($MILLION)
    • TABLE 79. LAMEA ICE CREAM MARKET, BY FLAVOR, 2020-2031,($MILLION)
    • TABLE 80. LAMEA ICE CREAM MARKET, BY DISTRIBUTION CHANNEL, 2020-2031,($MILLION)
    • TABLE 81. LAMEA ICE CREAM MARKET, BY COUNTRY, 2020-2031,($MILLION)
    • TABLE 82. BRAZIL ICE CREAM MARKET BY PRODUCT TYPE 2020-2031,($MILLION)
    • TABLE 83. BRAZIL ICE CREAM MARKET BY FLAVOR 2020-2031,($MILLION)
    • TABLE 84. BRAZIL ICE CREAM MARKET BY DISTRIBUTION CHANNEL 2020-2031,($MILLION)
    • TABLE 85. ARGENTINA ICE CREAM MARKET BY PRODUCT TYPE 2020-2031,($MILLION)
    • TABLE 86. ARGENTINA ICE CREAM MARKET BY FLAVOR 2020-2031,($MILLION)
    • TABLE 87. ARGENTINA ICE CREAM MARKET BY DISTRIBUTION CHANNEL 2020-2031,($MILLION)
    • TABLE 88. SOUTH AFRICA ICE CREAM MARKET BY PRODUCT TYPE 2020-2031,($MILLION)
    • TABLE 89. SOUTH AFRICA ICE CREAM MARKET BY FLAVOR 2020-2031,($MILLION)
    • TABLE 90. SOUTH AFRICA ICE CREAM MARKET BY DISTRIBUTION CHANNEL 2020-2031,($MILLION)
    • TABLE 91. UAE ICE CREAM MARKET BY PRODUCT TYPE 2020-2031,($MILLION)
    • TABLE 92. UAE ICE CREAM MARKET BY FLAVOR 2020-2031,($MILLION)
    • TABLE 93. UAE ICE CREAM MARKET BY DISTRIBUTION CHANNEL 2020-2031,($MILLION)
    • TABLE 94. REST OF LAMEA ICE CREAM MARKET BY PRODUCT TYPE 2020-2031,($MILLION)
    • TABLE 95. REST OF LAMEA ICE CREAM MARKET BY FLAVOR 2020-2031,($MILLION)
    • TABLE 96. REST OF LAMEA ICE CREAM MARKET BY DISTRIBUTION CHANNEL 2020-2031,($MILLION)
    • TABLE 97.UNILEVER GROUP: COMPANY SNAPSHOT
    • TABLE 98.UNILEVER GROUP: OPERATING SEGMENTS
    • TABLE 99.UNILEVER GROUP: PRODUCT PORTFOLIO
    • TABLE 100.UNILEVER GROUP: NET SALES,
    • TABLE 101.UNILEVER GROUP: KEY STRATERGIES
    • TABLE 102.NESTLE S.A.: COMPANY SNAPSHOT
    • TABLE 103.NESTLE S.A.: OPERATING SEGMENTS
    • TABLE 104.NESTLE S.A.: PRODUCT PORTFOLIO
    • TABLE 105.NESTLE S.A.: NET SALES,
    • TABLE 106.NESTLE S.A.: KEY STRATERGIES
    • TABLE 107.GENERAL MILLS, INC.: COMPANY SNAPSHOT
    • TABLE 108.GENERAL MILLS, INC.: OPERATING SEGMENTS
    • TABLE 109.GENERAL MILLS, INC.: PRODUCT PORTFOLIO
    • TABLE 110.GENERAL MILLS, INC.: NET SALES,
    • TABLE 111.GENERAL MILLS, INC.: KEY STRATERGIES
    • TABLE 112.MARS: COMPANY SNAPSHOT
    • TABLE 113.MARS: OPERATING SEGMENTS
    • TABLE 114.MARS: PRODUCT PORTFOLIO
    • TABLE 115.MARS: NET SALES,
    • TABLE 116.MARS: KEY STRATERGIES
    • TABLE 117.BLUE BELL CREAMERIES: COMPANY SNAPSHOT
    • TABLE 118.BLUE BELL CREAMERIES: OPERATING SEGMENTS
    • TABLE 119.BLUE BELL CREAMERIES: PRODUCT PORTFOLIO
    • TABLE 120.BLUE BELL CREAMERIES: NET SALES,
    • TABLE 121.BLUE BELL CREAMERIES: KEY STRATERGIES
    • TABLE 122.LOTTE CONFECTIONERY: COMPANY SNAPSHOT
    • TABLE 123.LOTTE CONFECTIONERY: OPERATING SEGMENTS
    • TABLE 124.LOTTE CONFECTIONERY: PRODUCT PORTFOLIO
    • TABLE 125.LOTTE CONFECTIONERY: NET SALES,
    • TABLE 126.LOTTE CONFECTIONERY: KEY STRATERGIES
    • TABLE 127.WELLS DAIRY INC.: COMPANY SNAPSHOT
    • TABLE 128.WELLS DAIRY INC.: OPERATING SEGMENTS
    • TABLE 129.WELLS DAIRY INC.: PRODUCT PORTFOLIO
    • TABLE 130.WELLS DAIRY INC.: NET SALES,
    • TABLE 131.WELLS DAIRY INC.: KEY STRATERGIES
    • TABLE 132.TURKEY HILL: COMPANY SNAPSHOT
    • TABLE 133.TURKEY HILL: OPERATING SEGMENTS
    • TABLE 134.TURKEY HILL: PRODUCT PORTFOLIO
    • TABLE 135.TURKEY HILL: NET SALES,
    • TABLE 136.TURKEY HILL: KEY STRATERGIES
    • TABLE 137.MIHAN DAIRY INC.: COMPANY SNAPSHOT
    • TABLE 138.MIHAN DAIRY INC.: OPERATING SEGMENTS
    • TABLE 139.MIHAN DAIRY INC.: PRODUCT PORTFOLIO
    • TABLE 140.MIHAN DAIRY INC.: NET SALES,
    • TABLE 141.MIHAN DAIRY INC.: KEY STRATERGIES
    • TABLE 142.MEIJI HOLDINGS CO. LTD: COMPANY SNAPSHOT
    • TABLE 143.MEIJI HOLDINGS CO. LTD: OPERATING SEGMENTS
    • TABLE 144.MEIJI HOLDINGS CO. LTD: PRODUCT PORTFOLIO
    • TABLE 145.MEIJI HOLDINGS CO. LTD: NET SALES,
    • TABLE 146.MEIJI HOLDINGS CO. LTD: KEY STRATERGIES
  • LIST OF FIGURES

    • FIGURE 1.ICE CREAM MARKET SEGMENTATION
    • FIGURE 2.ICE CREAM MARKET,2020-2031
    • FIGURE 3.ICE CREAM MARKET,2020-2031
    • FIGURE 4. TOP INVESTMENT POCKETS, BY REGION
    • FIGURE 5.PORTER FIVE-1
    • FIGURE 6.PORTER FIVE-2
    • FIGURE 7.PORTER FIVE-3
    • FIGURE 8.PORTER FIVE-4
    • FIGURE 9.PORTER FIVE-5
    • FIGURE 10.TOP PLAYER POSITIONING
    • FIGURE 11.ICE CREAM MARKET:DRIVERS, RESTRAINTS AND OPPORTUNITIES
    • FIGURE 12.ICE CREAM MARKET,BY PRODUCT TYPE,2020(%)
    • FIGURE 13.COMPARATIVE SHARE ANALYSIS OF IMPULSE ICE CREAM ICE CREAM MARKET,2020-2031(%)
    • FIGURE 14.COMPARATIVE SHARE ANALYSIS OF TAKE HOME ICE CREAM ICE CREAM MARKET,2020-2031(%)
    • FIGURE 15.COMPARATIVE SHARE ANALYSIS OF ARTISANAL ICE CREAM ICE CREAM MARKET,2020-2031(%)
    • FIGURE 16.ICE CREAM MARKET,BY FLAVOR,2020(%)
    • FIGURE 17.COMPARATIVE SHARE ANALYSIS OF VANILLA ICE CREAM MARKET,2020-2031(%)
    • FIGURE 18.COMPARATIVE SHARE ANALYSIS OF CHOCOLATE ICE CREAM MARKET,2020-2031(%)
    • FIGURE 19.COMPARATIVE SHARE ANALYSIS OF FRUIT ICE CREAM MARKET,2020-2031(%)
    • FIGURE 20.COMPARATIVE SHARE ANALYSIS OF OTHERS ICE CREAM MARKET,2020-2031(%)
    • FIGURE 21.ICE CREAM MARKET,BY DISTRIBUTION CHANNEL,2020(%)
    • FIGURE 22.COMPARATIVE SHARE ANALYSIS OF SUPERMARKETS AND HYPERMARKETS ICE CREAM MARKET,2020-2031(%)
    • FIGURE 23.COMPARATIVE SHARE ANALYSIS OF CONVENIENCE STORES ICE CREAM MARKET,2020-2031(%)
    • FIGURE 24.COMPARATIVE SHARE ANALYSIS OF SPECIALTY STORES ICE CREAM MARKET,2020-2031(%)
    • FIGURE 25.COMPARATIVE SHARE ANALYSIS OF ONLINE SALES CHANNEL ICE CREAM MARKET,2020-2031(%)
    • FIGURE 26.ICE CREAM MARKET BY REGION,2020
    • FIGURE 27.U.S. ICE CREAM MARKET,2020-2031($MILLION)
    • FIGURE 28.CANADA ICE CREAM MARKET,2020-2031($MILLION)
    • FIGURE 29.MEXICO ICE CREAM MARKET,2020-2031($MILLION)
    • FIGURE 30.FINLAND ICE CREAM MARKET,2020-2031($MILLION)
    • FIGURE 31.SWEDEN ICE CREAM MARKET,2020-2031($MILLION)
    • FIGURE 32.IRELAND ICE CREAM MARKET,2020-2031($MILLION)
    • FIGURE 33.DENMARK ICE CREAM MARKET,2020-2031($MILLION)
    • FIGURE 34.ITALY ICE CREAM MARKET,2020-2031($MILLION)
    • FIGURE 35.U.K. ICE CREAM MARKET,2020-2031($MILLION)
    • FIGURE 36.REST OF EUROPE ICE CREAM MARKET,2020-2031($MILLION)
    • FIGURE 37.NEW ZEALAND ICE CREAM MARKET,2020-2031($MILLION)
    • FIGURE 38.AUSTRALIA ICE CREAM MARKET,2020-2031($MILLION)
    • FIGURE 39.REST OF ASIA-PACIFIC ICE CREAM MARKET,2020-2031($MILLION)
    • FIGURE 40.BRAZIL ICE CREAM MARKET,2020-2031($MILLION)
    • FIGURE 41.ARGENTINA ICE CREAM MARKET,2020-2031($MILLION)
    • FIGURE 42.SOUTH AFRICA ICE CREAM MARKET,2020-2031($MILLION)
    • FIGURE 43.UAE ICE CREAM MARKET,2020-2031($MILLION)
    • FIGURE 44.REST OF LAMEA ICE CREAM MARKET,2020-2031($MILLION)
    • FIGURE 45. TOP WINNING STRATEGIES, BY YEAR
    • FIGURE 46. TOP WINNING STRATEGIES, BY DEVELOPMENT
    • FIGURE 47. TOP WINNING STRATEGIES, BY COMPANY
    • FIGURE 48.PRODUCT MAPPING OF TOP 10 PLAYERS
    • FIGURE 49.COMPETITIVE DASHBOARD
    • FIGURE 50.COMPETITIVE HEATMAP OF TOP 10 KEY PLAYERS
    • FIGURE 51.UNILEVER GROUP.: NET SALES ,($MILLION)
    • FIGURE 52.NESTLE S.A..: NET SALES ,($MILLION)
    • FIGURE 53.GENERAL MILLS, INC..: NET SALES ,($MILLION)
    • FIGURE 54.MARS.: NET SALES ,($MILLION)
    • FIGURE 55.BLUE BELL CREAMERIES.: NET SALES ,($MILLION)
    • FIGURE 56.LOTTE CONFECTIONERY.: NET SALES ,($MILLION)
    • FIGURE 57.WELLS DAIRY INC..: NET SALES ,($MILLION)
    • FIGURE 58.TURKEY HILL.: NET SALES ,($MILLION)
    • FIGURE 59.MIHAN DAIRY INC..: NET SALES ,($MILLION)
    • FIGURE 60.MEIJI HOLDINGS CO. LTD.: NET SALES ,($MILLION)


Ice creams are made up of dairy items such as milk and cream combined with dry fruits, flavors, and other ingredients. Chocolate, vanilla, and others are the traditional flavors of ice cream. However, companies are launching new flavors such as tropical fruits, lemons, and coconuts to attract large number of consumers. Rise in disposable income majorly drives the growth of the global ice cream market, especially in the developing economies. In addition, increase in number of convenience stores and increased preference for different flavors fuel the market growth.

The market for ice creams is developing in the emerging economies such as India, Indonesia, Thailand, Malaysia, Brazil, Argentina, and Philippines. An increase of approximately 1% in the per capita consumption of ice cream has been observed in these countries. New Zealand is estimated to be the largest consumer of ice creams, followed by the U.S. and Australia. The impulse segment accounted for the largest share in 2020, owing to spontaneous craving of the consumer to indulge in ice cream and upsurge in demand for snacking options.

In addition, the rising demand for premium products is creating lucrative opportunities for the expansion of the global ice cream market. The premium ice creams can be customized with unique flavors and textures. Moreover, the demand for ice creams made with natural ingredients is growing at a rapid pace, which is boosting the growth of the market.

PURCHASE OPTIONS

Call or Email us

U.S.-Canada Toll-free: +1-800-792-5285
Int'l : +1-503-894-6022
Europe : +44-845-528-1300
Email : help@alliedmarketresearch.com
 
FREQUENTLY ASKED QUESTIONS?

A. The global ice cream market was valued at $68,052.2 million in 2020 and is projected to reach $122,051.1 million by 2031, registering a CAGR of 5.0% from 2022 to 2031.

A. The forecast period in the ice cream market report is 2022 to 2031.

A. The base year calculated in the ice cream market report is 2020.

A. The market value of the ice cream market in 2020 was $122,051.1 million.

A. The top companies analyzed for global ice cream market report are Unilever Group Nestle S.A., General Mills, Inc., Mars, Blue Bell Creameries, Lotte Confectionery, Wells Dairy Inc., Turkey Hill, Mihan Dairy Inc., and Meiji Holdings Co. Ltd.

A. The impulse ice cream segment is the most influential segment in the ice cream market report.

A. Asia-Pacific holds the maximum market share of the ice cream market.

A. The company profile has been selected on the basis of key developments such as partnership, product launch, merger and acquisition.

Looking for Customization?

 Customization Request

Have a Question?

 Speak with Analyst

Any Confusion?

 Inquire Before Buying

Have a glance of the Report

  Request Sample
RELATED TAGS

Purchase Full Report of
Ice Cream Market

Start reading instantly.
This Report and over 67,112+ more Reports, Available with Avenue Library. T&C*.

  • Online Only
  • $3,456
  • Online cloud access only
  • Restricted print, copy, paste & download
  • Read only
  • Free industry update
    (Within 180 days)
  • Free report update in next update cycle
    (Mar 2023 - Mar 2024)
  • Data Pack
  • $3,840
  • Restricted to one authorized user
  • One print only
  • Available in
    Excel
  • Free industry update
    (Within 180 days)
  •   Free report update in next update cycle
    (Mar 2023 - Mar 2024)
  • Single User
  • $5,769
  • Restricted to one authorized user
  • One print only
  • Available in
    PDF
  • Free industry update
    (Within 180 days)
  •   Free report update in next update cycle
    (Mar 2023 - Mar 2024)
  • Five Users
  • $6,450
  • Limited to five authorized users
  • Print upto five copies
  • Available in
    PDF
  • Free industry update
    (Within 180 days)
  •   Free report update in next update cycle
    (Mar 2023 - Mar 2024)
  • Enterprise
    License/PDF

  • $10,995
  • Unlimited
    within
    company/enterprise
  • Available in Excel & PDF
  • Free industry update
    (Within 180 days)
  •   Free report update in next update cycle
    (Mar 2023 - Mar 2024)
  • Library
    Membership

  • $999 $ 1,175
    Per User/ Per month/ Billed annually
  • Published Content
    E-access
  • Company Profiles
    E-access
  • Newly Added Content Access
  • 10 PDF
    Downloads
  • 5 Excel Data
    Pack Downloads
  • 250 Company Profiles PDF Downloads
  • Buy Now

*Taxes/Fees, if applicable will be added during checkout. All prices in USD

RELATED REPORTS
 

Why Allied Market Research?


Infallible Methodology

To ensure high-level data integrity, accurate analysis, and impeccable forecasts

Analyst Support

For complete satisfaction

Customization

On-demand customization of scope of the report to exactly meet your needs

TARGETED MARKET VIEW

Targeted market view to provide pertinent information and save time of readers

Get fresh content delivered

Get insights on topics that are crucial for your business. Stay abreast of your interest areas.

Get Industry Data Alerts

Why Allied Market Research?

Infallible Methodology

To ensure high-level data integrity, accurate analysis, and impeccable forecasts

Analyst Support

For complete satisfaction

Customization

On-demand customization of scope of the report to exactly meet your needs

TARGETED MARKET VIEW

Targeted market view to provide pertinent information and save time of readers