0
2018
Industrial Internet Of Things (iiot) Market

Industrial Internet of Things (IIoT) Market

by Component (Hardware, Software, Services, and Connectivity) and Application (Manufacturing, Energy & Power, Oil & Gas, Healthcare, Transportation & Logistics, and Others) - Opportunity Analysis and Industry Forecast, 2017-2023

Report Code: A04202
Feb 2018 | Pages: 140
Tables: 83
Charts: 46
  • Formats*:

  • pdf

    Single User License, Five User
    License & Enterprise User License

  • xls

    Data Pack Excel License

  • ppt

    It comes with the additional cost
    of $2500.00 contact sales.


COVID-19

Pandemic disrupted the entire world and affected many industries.

Get detailed COVID-19 impact analysis on the Industrial Internet Of Things (iiot) Market

Request Now !

Industrial Internet of Things Market Outlook - 2023

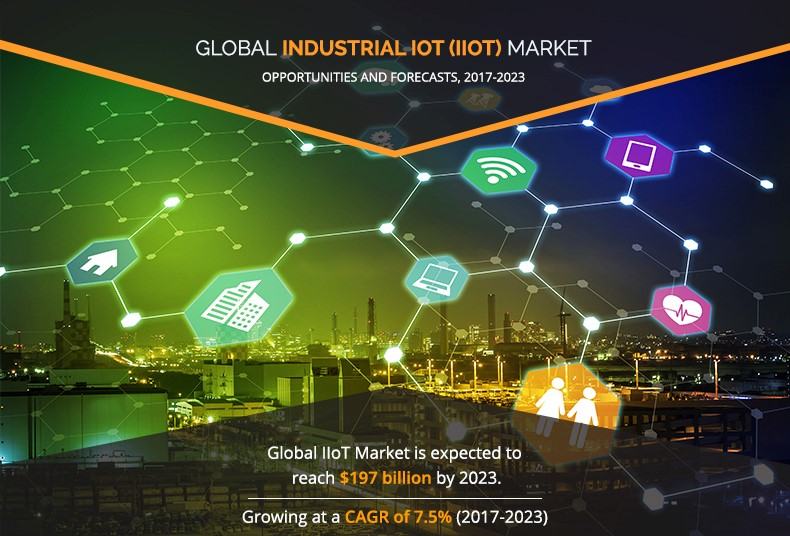
The IIoT market size was valued at $115 billion in 2016, and is projected to reach at $197 billion by 2023, growing at a CAGR of 7.5% from 2017 to 2023. Advancement in technologies has helped key players to offer enhanced Industrial Internet of Things offerings to their end users. Integration of smart sensors into industrial machines encouraged the manufacturers to reduce the operational cost by 50% and is expected to decrease further during the forecast period. 

Increase in technological investments in the developing regions coupled with the emergence of big data analytics has widely driven the global industrial internet of things market growth of Industrial Internet of Things. Further, rise in demand from the healthcare industry and the initiation of industry-specific platforms in the developed region is expected to fuel the growth of the IIoT market.

Industrial Internet of Things Market

The industrial internet of things market size witnesses a continuous rise in adoption of Internet of Things (IoT) due to presence of factors such as high penetration of Wi-Fi connectivity, technological enhancements in wireless network technologies, and rise in adoption of cloud platform. Furthermore, growth in development of smart transportation and smart cities leads to increased adoption of IoT . This in turns propels the growth of the Industrial Internet of Things industry.

Various communication technologies are well known among people due to smart phones tablets, TVs and other electronic appliances because these are highly adopted by people on daily basis. Such technologies are WIFI, Bluetooth, ZigBee, 2G/3G/4G and cellular technology. But few new technologies have been emerged and integrated with Industrial Internet of Things like Thread for home automation appliances, and Whitespace Tv technologies for wider area in major cities. For instance, in smart phones IoT chip work like it allow phones to connect with all other devices and sensors through any technology. It is an internetworking of physical and virtual objects which relates each other with the help of cloud technology. IoT technology demands in various areas such as electronics, automotive, thermostats, vending machines, speakers system and security systems because it follows real time monitoring process and made easy to access information and communication.

The market for the IIoT chips is expected to have growth in subsequent years from 2019-2026 due to high growth, demanded in health care and automotive industry. Expansion of investments have been made by IoT industry to develop new IoT based products because IoT is used in numerous devices and applications of various industries such as Wearable devices, healthcare, consumer electronics and others as these enables devices to improve efficiency, safety and helps in decision- making which increases productivity. Hence these factors contribute positively to the industrial internet of things market to boost across the globe. Moreover, new domain in transportation and automotive sector driving the IIoT market i.e. Intelligent Transportation System (ITS) integrated with advancement of IOT technology. Retail a leading industry vertical in IoT usage can also drive IIoT market growth.

Some of the significant players that operate in the industrial internet of things market and are profiled in the report include Cisco Systems, Inc., General Electric, Intel Corporation, Rockwell Automation, Inc., ABB, Texas Instruments Inc., Dassault Systèmes, Honeywell International Inc., Huawei Technology Co., Ltd., and International Business Machines Corporation (IBM).

Industrial Internet of Things Market by Geography

The industrial internet of things market is segmented based on component, application, and region. The components covered in this report include hardware, software, services, and connectivity. The applications discussed in this study are manufacturing, energy & power, oil & gas, healthcare, transportation & logistics, and others.

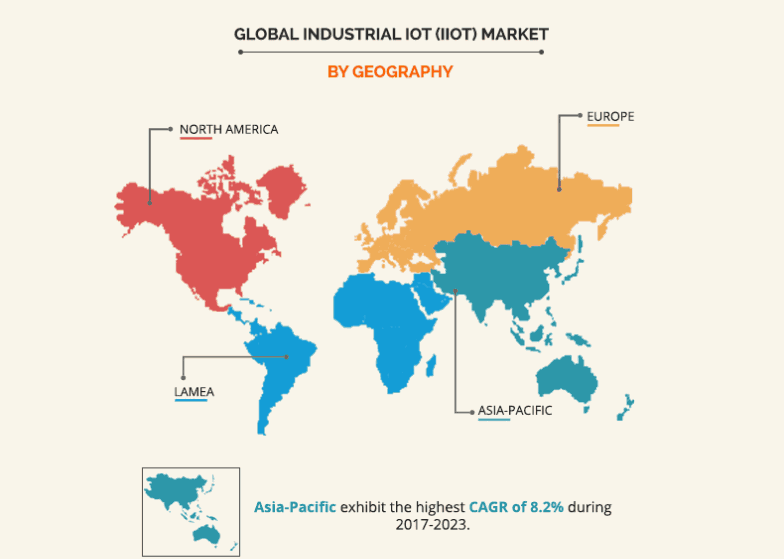
Furthermore, the IIoT market share is analyzed across North America, Europe, Asia–Pacific, and LAMEA.

Top Impacting Factors

Low operational cost

Smart and connected products are critical components in the connected supply chain and smart manufacturing processes. Further, the advent of low cost connected devices has enabled manufacturers to adopt IoT technologies to lower resource consumption and increase the overall productivity. Moreover, due to low operational cost, several manufacturers prefer to implement IoT applications in machines to maximize the efficiency with reduced cost.

Growth in adoption of cloud-based deployment model

Demand of low-cost data storage, backup, and data protection are major opportunities for small & medium enterprises (SMEs). Implementation of cloud helps enterprises to provide better IoT services to various industry verticals.

Growth in adoption of Industrial Internet of Things 

Advancement in technologies has helped key players to offer enhanced IIoT offerings to their end users. Integration of smart sensors into industrial machines has encouraged the manufacturers to reduce the operational cost by 50%, and this is expected to decrease further during the forecast period. Further, virtual and augmented reality offers end users a 360-degree of an object before manufacturing it in real.

Increase in technological advancements

Advancement in technologies has helped key players to offer enhanced IIoT offerings to their end users. Integration of smart sensors into industrial machines has encouraged the manufacturers to reduce the operational cost by 50%, and this is expected to decrease further during the forecast period. Further, virtual and augmented reality offers end users a 360-degree of an object before manufacturing it in real.

Inadequate IT infrastructure

Poor internet architecture and lack of skilled labors majorly limit the growth of the IoT in manufacturing market. Many of the developing countries lack basic IT infrastructure, which is pre-requisite for reliable connectivity. Further, power supply systems have to be stable and reliable to ensure high quality exchange of data between sensors and control systems. Therefore, poor internet connectivity in countries such as Africa, Malaysia, Chile, and Brazil is expected to hinder the industrial internet of things market growth in the coming years.

Surge in predictive maintenance

Predictive maintenance techniques are designed to determine the condition of in-service equipment to predict when maintenance is required. The application of predictive maintenance is based on actual condition of the equipment rather than time or age factors. Rise in adoption of predictive maintenance has encouraged key players to install such techniques into their existing machines.

Key Benefits For Stakeholders

  • The overall market potential is determined to understand the profitable trends to gain a stronger foothold.
  • The report presents information related to key drivers, restraints, and opportunities with a detailed impact analysis.
  • The current industrial internet of things market size is quantitatively analyzed from 2017 to 2023 to highlight the financial competency of the market.
  • Porter’s Five Forces analysis illustrates the potency of the buyers and suppliers in the IIoT industry.

Industrial Internet of Things (IIoT) Market Report Highlights

Aspects Details
By Component Type
  • Hardware
  • Software
  • Services
  • Connectivity
By Application
  • Manufacturing
  • Energy & Power
  • Oil & Gas
  • Healthcare
  • Transportation & Logistics
  • Others
By Geography
  • North America
    • U.S.
    • Canada
    • Mexico
  • Europe
    • UK
    • Germany
    • France
    • Rest of Europe
  • Asia-Pacific
    • China
    • India
    • Japan
    • Rest of Asia-Pacific
  • LAMEA
    • Latin America
    • Middle East
    • Africa
Key Market Players HUAWEI TECHNOLOGY CO., LTD.,, INTEL CORPORATION, GENERAL ELECTRIC, TEXAS INSTRUMENTS, INC., DASSAULT SYSTEMES, ABB GROUP, CISCO SYSTEMS, INC., IBM CORPORATION, HONEYWELL INTERNATIONAL, INC., ROCKWELL AUTOMATION, INC.
 

CHAPTER 1: INTRODUCTION

1.1. REPORT DESCRIPTION
1.2. KEY BENEFITS FOR STAKEHOLDERS
1.3. KEY MARKET SEGMENTS
1.4. RESEARCH METHODOLOGY

1.4.1. Primary research
1.4.2. Secondary research
1.4.3. Analyst tools and models

CHAPTER 2: EXECUTIVE SUMMARY

2.1. CXO PERSPECTIVE

CHAPTER 3: MARKET OVERVIEW

3.1. MARKET DEFINITION AND SCOPE
3.2. KEY FINDINGS

3.2.1. Top impacting factors
3.2.2. Top investment pockets
3.2.3. Top winning strategies

3.2.3.1. Competitive intelligence and strategies of companies

3.3. PORTER’S FIVE FORCES ANALYSIS

3.3.1. Moderate-to-high bargaining power of suppliers
3.3.2. Moderate threat of new entrants
3.3.3. Low-to-moderate threat of substitutes
3.3.4. High intensity of rivalry
3.3.5. Moderate bargaining power of buyers

3.4. MARKET SHARE ANALYSIS (2016)
3.5. MARKET DYNAMICS

3.5.1. Drivers

3.5.1.1. Advancement in technologies
3.5.1.2. Low operational cost
3.5.1.3. Rising adoption of IoT

3.5.2. Restraint

3.5.2.1. Inadequate IT infrastructure

3.5.3. Opportunity

3.5.3.1. Surge in predictive maintenance
3.5.3.2. Growth in adoption of cloud-based deployment model

CHAPTER 4: IIOT MARKET, BY COMPONENT

4.1. OVERVIEW
4.2. HARDWARE

4.2.1. Key market trends, growth factors, and opportunities
4.2.2. Market size and forecast, by region
4.2.3. Market analysis by country

4.3. SOFTWARE

4.3.1. Key market trends, growth factors, and opportunities
4.3.2. Market size and forecast, by region
4.3.3. Market analysis by country

4.4. SERVICES

4.4.1. Key market trends, growth factors, and opportunities
4.4.2. Market size and forecast, by region
4.4.3. Market analysis by country

4.5. CONNECTIVITY

4.5.1. Key market trends, growth factors, and opportunities
4.5.2. Market size and forecast, by region
4.5.3. Market analysis by country

CHAPTER 5: IIOT MARKET, BY APPLICATION

5.1. OVERVIEW
5.2. MANUFACTURING

5.2.1. Key market trends, growth factors, and opportunities
5.2.2. Market size and forecast, by region
5.2.3. Market analysis by country

5.3. ENERGY & POWER

5.3.1. Key market trends, growth factors, and opportunities
5.3.2. Market size and forecast, by region
5.3.3. Market analysis by country

5.4. OIL & GAS

5.4.1. Key market trends, growth factors, and opportunities
5.4.2. Market size and forecast, by region
5.4.3. Market analysis by country

5.5. HEALTHCARE

5.5.1. Key market trends, growth factors, and opportunities
5.5.2. Market size and forecast, by region
5.5.3. Market analysis by country

5.6. TRANSPORTATION & LOGISTICS

5.6.1. Key market trends, growth factors, and opportunities
5.6.2. Market size and forecast, by region
5.6.3. Market analysis by country

5.7. OTHERS

5.7.1. Key market trends, growth factors, and opportunities
5.7.2. Market size and forecast, by region
5.7.3. Market analysis by country

CHAPTER 6: IIOT MARKET BY GEOGRAPHY

6.1. OVERVIEW
6.2. NORTH AMERICA

6.2.1. Key market trends and opportunities
6.2.2. Market size and forecast by component
6.2.3. Market size and forecast by application
6.2.4. Market analysis by country

6.2.4.1. U.S.

6.2.4.1.1. Market size and forecast, by component
6.2.4.1.2. Market size and forecast, by application

6.2.4.2. Canada

6.2.4.2.1. Market size and forecast, by component
6.2.4.2.2. Market size and forecast, by application

6.2.4.3. Mexico

6.2.4.3.1. Market size and forecast, by component
6.2.4.3.2. Market size and forecast, by application

6.3. EUROPE

6.3.1. Key market trends and opportunities
6.3.2. Market size and forecast by component
6.3.3. Market size and forecast by application
6.3.4. Market analysis by country

6.3.4.1. UK

6.3.4.1.1. Market size and forecast, by component
6.3.4.1.2. Market size and forecast, by application

6.3.4.2. Germany

6.3.4.2.1. Market size and forecast, by component
6.3.4.2.2. Market size and forecast, by application

6.3.4.3. France

6.3.4.3.1. Market size and forecast, by component
6.3.4.3.2. Market size and forecast, by application

6.3.4.4. Rest of Europe

6.3.4.4.1. Market size and forecast, by component
6.3.4.4.2. Market size and forecast, by application

6.4. ASIA-PACIFIC

6.4.1. Key market trends and opportunities
6.4.2. Market size and forecast by component
6.4.3. Market size and forecast by application
6.4.4. Market analysis by country

6.4.4.1. China

6.4.4.1.1. Market size and forecast, by component
6.4.4.1.2. Market size and forecast, by application

6.4.4.2. India

6.4.4.2.1. Market size and forecast, by component
6.4.4.2.2. Market size and forecast, by application

6.4.4.3. Japan

6.4.4.3.1. Market size and forecast, by component
6.4.4.3.2. Market size and forecast, by application

6.4.4.4. Rest of Asia-Pacific

6.4.4.4.1. Market size and forecast, by component
6.4.4.4.2. Market size and forecast, by application

6.5. LAMEA

6.5.1. Key market trends and opportunities
6.5.2. Market size and forecast by component
6.5.3. Market size and forecast by application
6.5.4. Market analysis by sub-region

6.5.4.1. Latin America

6.5.4.1.1. Market size and forecast, by component
6.5.4.1.2. Market size and forecast, by application

6.5.4.2. Middle East

6.5.4.2.1. Market size and forecast, by component
6.5.4.2.2. Market size and forecast, by application

6.5.4.3. Africa

6.5.4.3.1. Market size and forecast, by component
6.5.4.3.2. Market size and forecast, by application

CHAPTER 7: COMPANY PROFILES

7.1. CISCO SYSTEMS, INC.

7.1.1. Company overview
7.1.2. Company Snapshot
7.1.3. Operating business segments
7.1.4. Business performance
7.1.5. Key strategic moves & developments

7.2. GENERAL ELECTRIC

7.2.1. Company overview
7.2.2. Company Snapshot
7.2.3. Operating business segments
7.2.4. Business performance
7.2.5. Key strategic moves & developments

7.3. INTEL CORPORATION

7.3.1. Company overview
7.3.2. Company Snapshot
7.3.3. Operating business segments
7.3.4. Business performance
7.3.5. Key strategic moves & developments

7.4. ROCKWELL AUTOMATION, INC.

7.4.1. Company overview
7.4.2. Company Snapshot
7.4.3. Operating business segments
7.4.4. Business performance
7.4.5. Key strategic moves & developments

7.5. ABB GROUP

7.5.1. Company overview
7.5.2. Company Snapshot
7.5.3. Operating business segments
7.5.4. Business performance
7.5.5. Key strategic moves & developments

7.6. TEXAS INSTRUMENTS, INC.

7.6.1. Company overview
7.6.2. Company Snapshot
7.6.3. Operating business segments
7.6.4. Business performance
7.6.5. Key strategic moves & developments

7.7. DASSAULT SYSTEMES

7.7.1. Company overview
7.7.2. Company Snapshot
7.7.3. Operating business segments
7.7.4. Business performance
7.7.5. Key strategic moves & developments

7.8. HONEYWELL INTERNATIONAL, INC.

7.8.1. Company overview
7.8.2. Company Snapshot
7.8.3. Operating business segments
7.8.4. Business performance
7.8.5. Key strategic moves & developments

7.9. HUAWEI TECHNOLOGY CO., LTD.,

7.9.1. Company overview
7.9.2. Company Snapshot
7.9.3. Operating business segments
7.9.4. Business performance
7.9.5. Key strategic moves & developments

7.10. IBM CORPORATION

7.10.1. Company overview
7.10.2. Company Snapshot
7.10.3. Operating business segments
7.10.4. Business performance
7.10.5. Key strategic moves & developments

LIST OF TABLES

TABLE 01. GLOBAL IIOT MARKET REVENUE, BY COMPONENT, 2016-2023 ($MILLION)
TABLE 02. IIOT MARKET REVENUE FOR HARDWARE, BY REGION 2016-2023 ($MILLION)
TABLE 03. IIOT MARKET REVENUE FOR SOFTWARE, BY REGION 2016-2023 ($MILLION)
TABLE 04. IIOT MARKET REVENUE FOR SERVICES, BY REGION 2016-2023 ($MILLION)
TABLE 05. IIOT MARKET REVENUE FOR CONNECTIVITY, BY REGION 2016-2023 ($MILLION)
TABLE 06. GLOBAL IIOT MARKET REVENUE, BY APPLICATION, 2016-2023 ($MILLION)
TABLE 07. IIOT MARKET REVENUE FOR MANUFACTURING APPLICATION, BY REGION 2016-2023 ($MILLION)
TABLE 08. IIOT MARKET REVENUE FOR ENERGY & POWER APPLICATION, BY REGION 2016-2023 ($MILLION)
TABLE 09. IIOT MARKET REVENUE FOR OIL & GAS APPLICATION, BY REGION 2016-2023 ($MILLION)
TABLE 10. IIOT MARKET REVENUE FOR HEALTHCARE APPLICATION, BY REGION 2016-2023 ($MILLION)
TABLE 11. IIOT MARKET REVENUE FOR TRANSPORTATION & LOGISTICS APPLICATION, BY REGION 2016-2023 ($MILLION)
TABLE 12. IIOT MARKET REVENUE FOR OTHER APPLICATIONS, BY REGION 2016-2023 ($MILLION)
TABLE 13. GLOBAL IIOT MARKET REVENUE, BY GEOGRAPHY, 2016-2023 ($MILLION)
TABLE 14. NORTH AMERICA IIOT MARKET REVENUE FOR COMPONENT, 2016-2023 ($MILLION)
TABLE 15. NORTH AMERICA IIOT MARKET REVENUE FOR APPLICATION, 2016-2023 ($MILLION)
TABLE 16. NORTH AMERICA IIOT MARKET REVENUE, BY COUNTRY 2016-2023 ($MILLION)
TABLE 17. U.S. IIOT MARKET REVENUE, BY COMPONENT, 2016-2023 ($MILLION)
TABLE 18. U.S. IIOT MARKET REVENUE, BY APPLICATION, 2016-2023 ($MILLION)
TABLE 19. CANADA IIOT MARKET REVENUE, BY COMPONENT, 2016-2023 ($MILLION)
TABLE 20. CANADA IIOT MARKET REVENUE, BY APPLICATION, 2016-2023 ($MILLION)
TABLE 21. MEXICO IIOT MARKET REVENUE, BY COMPONENT, 2016-2023 ($MILLION)
TABLE 22. MEXICO IIOT MARKET REVENUE, BY APPLICATION, 2016-2023 ($MILLION)
TABLE 23. EUROPE IIOT MARKET REVENUE FOR COMPONENT, 2016-2023 ($MILLION)
TABLE 24. EUROPE IIOT MARKET REVENUE FOR APPLICATION, 2016-2023 ($MILLION)
TABLE 25. EUROPE IIOT MARKET REVENUE, BY COUNTRY 2016-2023 ($MILLION)
TABLE 26. UK IIOT MARKET REVENUE, BY COMPONENT, 2016-2023 ($MILLION)
TABLE 27. UK IIOT MARKET REVENUE, BY APPLICATION, 2016-2023 ($MILLION)
TABLE 28. GERMANY IIOT MARKET REVENUE, BY COMPONENT, 2016-2023 ($MILLION)
TABLE 29. GERMANY IIOT MARKET REVENUE, BY APPLICATION, 2016-2023 ($MILLION)
TABLE 30. FRANCE IIOT MARKET REVENUE, BY COMPONENT, 2016-2023 ($MILLION)
TABLE 31. FRANCE IIOT MARKET REVENUE, BY APPLICATION, 2016-2023 ($MILLION)
TABLE 32. REST OF EUROPE IIOT MARKET REVENUE, BY COMPONENT, 2016-2023 ($MILLION)
TABLE 33. REST OF EUROPE IIOT MARKET REVENUE, BY APPLICATION, 2016-2023 ($MILLION)
TABLE 34. ASIA-PACIFIC IIOT MARKET REVENUE FOR COMPONENT, 2016-2023 ($MILLION)
TABLE 35. ASIA-PACIFIC IIOT MARKET REVENUE FOR APPLICATION, 2016-2023 ($MILLION)
TABLE 36. ASIA-PACIFIC IIOT MARKET REVENUE, BY COUNTRY 2016-2023 ($MILLION)
TABLE 37. CHINA IIOT MARKET REVENUE, BY COMPONENT, 2016-2023 ($MILLION)
TABLE 38. CHINA IIOT MARKET REVENUE, BY APPLICATION, 2016-2023 ($MILLION)
TABLE 39. INDIA IIOT MARKET REVENUE, BY COMPONENT, 2016-2023 ($MILLION)
TABLE 40. INDIA IIOT MARKET REVENUE, BY APPLICATION, 2016-2023 ($MILLION)
TABLE 41. JAPAN IIOT MARKET REVENUE, BY COMPONENT, 2016-2023 ($MILLION)
TABLE 42. JAPAN IIOT MARKET REVENUE, BY APPLICATION, 2016-2023 ($MILLION)
TABLE 43. REST OF ASIA-PACIFIC IIOT MARKET REVENUE, BY COMPONENT, 2016-2023 ($MILLION)
TABLE 44. REST OF ASIA-PACIFIC IIOT MARKET REVENUE, BY APPLICATION, 2016-2023 ($MILLION)
TABLE 45. LAMEA IIOT MARKET REVENUE FOR COMPONENT, 2016-2023 ($MILLION)
TABLE 46. LAMEA IIOT MARKET REVENUE FOR APPLICATION, 2016-2023 ($MILLION)
TABLE 47. LAMEA IIOT MARKET REVENUE, BY SUB-REGION 2016-2023 ($MILLION)
TABLE 48. LATIN AMERICA IIOT MARKET REVENUE, BY COMPONENT, 2016-2023 ($MILLION)
TABLE 49. LATIN AMERICA IIOT MARKET REVENUE, BY APPLICATION, 2016-2023 ($MILLION)
TABLE 50. MIDDLE EAST IIOT MARKET REVENUE, BY COMPONENT, 2016-2023 ($MILLION)
TABLE 51. MIDDLE EAST IIOT MARKET REVENUE, BY APPLICATION, 2016-2023 ($MILLION)
TABLE 52. AFRICA IIOT MARKET REVENUE, BY COMPONENT, 2016-2023 ($MILLION)
TABLE 53. AFRICA IIOT MARKET REVENUE, BY APPLICATION, 2016-2023 ($MILLION)
TABLE 54. CISCO: COMPANY SNAPSHOT
TABLE 55. CISCO: OPERATING SEGMENTS
TABLE 56. CISCO: STRATEGIC MOVES & DEVELOPMENTS
TABLE 57. GE: COMPANY SNAPSHOT
TABLE 58. GE: OPERATING SEGMENTS
TABLE 59. GE: STRATEGIC MOVES & DEVELOPMENTS
TABLE 60. INTEL: COMPANY SNAPSHOT
TABLE 61. INTEL: OPERATING SEGMENTS
TABLE 62. INTEL: STRATEGIC MOVES & DEVELOPMENTS
TABLE 63. ROCKWELL: COMPANY SNAPSHOT
TABLE 64. ROCKWELL: OPERATING SEGMENTS
TABLE 65. ROCKWELL: STRATEGIC MOVES & DEVELOPMENTS
TABLE 66. ABB: COMPANY SNAPSHOT
TABLE 67. ABB: OPERATING SEGMENTS
TABLE 68. ABB: STRATEGIC MOVES & DEVELOPMENTS
TABLE 69. TEXAS INSTRUMENTS: COMPANY SNAPSHOT
TABLE 70. TEXAS INSTRUMENTS: OPERATING SEGMENTS
TABLE 71. TEXAS INSTRUMENTS: STRATEGIC MOVES & DEVELOPMENTS
TABLE 72. DASSAULT: COMPANY SNAPSHOT
TABLE 73. DASSAULT: OPERATING SEGMENTS
TABLE 74. DASSAULT: STRATEGIC MOVES & DEVELOPMENTS
TABLE 75. HONEYWELL: COMPANY SNAPSHOT
TABLE 76. HONEYWELL: OPERATING SEGMENTS
TABLE 77. HONEYWELL: STRATEGIC MOVES & DEVELOPMENTS
TABLE 78. HUAWEI: COMPANY SNAPSHOT
TABLE 79. HUAWEI: OPERATING SEGMENTS
TABLE 80. HUAWEI: STRATEGIC MOVES & DEVELOPMENTS
TABLE 81. IBM: COMPANY SNAPSHOT
TABLE 82. IBM: OPERATING SEGMENTS
TABLE 83. IBM: STRATEGIC MOVES & DEVELOPMENTS

LIST OF FIGURES

FIGURE 01. KEY MARKET SEGMENTS
FIGURE 02. EXECUTIVE SUMMARY
FIGURE 03. TOP INVESTMENT POCKETS
FIGURE 04. TOP WINNING STRATEGIES, 2016-2023 (%)
FIGURE 05. TOP COMPANIES AND THEIR STRATEGIES
FIGURE 06. MARKET SHARE ANALYSIS
FIGURE 07. COMPARATIVE SHARE ANALYSIS OF HARDWARE MARKET, BY COUNTRY, 2016 & 2023 (%)
FIGURE 08. COMPARATIVE SHARE ANALYSIS OF SOFTWARE MARKET, BY COUNTRY, 2016 & 2023 (%)
FIGURE 09. COMPARATIVE SHARE ANALYSIS OF SERVICES MARKET, BY COUNTRY, 2016 & 2023 (%)
FIGURE 10. COMPARATIVE SHARE ANALYSIS OF CONNECTIVITY MARKET, BY COUNTRY, 2016 & 2023 (%)
FIGURE 11. COMPARATIVE SHARE ANALYSIS OF MANUFACTURING APPLICATION MARKET, BY COUNTRY, 2016 & 2023 (%)
FIGURE 12. COMPARATIVE SHARE ANALYSIS OF ENERGY & POWER MARKET, BY COUNTRY, 2016 & 2023 (%)
FIGURE 13. COMPARATIVE SHARE ANALYSIS OF AVIATION MARKET, BY COUNTRY, 2016 & 2023 (%)
FIGURE 14. COMPARATIVE SHARE ANALYSIS OF HEALTHCARE MARKET, BY COUNTRY, 2016 & 2023 (%)
FIGURE 15. COMPARATIVE SHARE ANALYSIS OF TRANSPORTATION & LOGISTICS MARKET, BY COUNTRY, 2016 & 2023 (%)
FIGURE 16. COMPARATIVE SHARE ANALYSIS OF OTHERS MARKET, BY COUNTRY, 2016 & 2023 (%)
FIGURE 17. CISCO: NET SALES, 2014-2016 ($MILLION)
FIGURE 18. CISCO: REVENUE SHARE BY SEGMENT, 2016 (%)
FIGURE 19. CISCO: REVENUE SHARE BY GEOGRAPHY, 2016(%)
FIGURE 20. GE: NET SALES, 2014-2016 ($MILLION)
FIGURE 21. GE: REVENUE SHARE BY SEGMENT, 2016 (%)
FIGURE 22. GE: REVENUE SHARE BY GEOGRAPHY, 2016(%)
FIGURE 23. INTEL: NET SALES, 2014-2016 ($MILLION)
FIGURE 24. INTEL: REVENUE SHARE BY SEGMENT, 2016 (%)
FIGURE 25. INTEL: REVENUE SHARE BY GEOGRAPHY, 2016(%)
FIGURE 26. ROCKWELL: NET SALES, 2014-2016 ($MILLION)
FIGURE 27. ROCKWELL: REVENUE SHARE BY SEGMENT, 2016 (%)
FIGURE 28. ROCKWELL: REVENUE SHARE BY GEOGRAPHY, 2016(%)
FIGURE 29. ABB: NET SALES, 2014-2016 ($MILLION)
FIGURE 30. ABB: REVENUE SHARE BY SEGMENT, 2016 (%)
FIGURE 31. ABB: REVENUE SHARE BY GEOGRAPHY, 2016(%)
FIGURE 32. TEXAS INSTRUMENTS: NET SALES, 2014-2016 ($MILLION)
FIGURE 33. TEXAS INSTRUMENTS: REVENUE SHARE BY SEGMENT, 2016 (%)
FIGURE 34. TEXAS INSTRUMENTS: REVENUE SHARE BY GEOGRAPHY, 2016(%)
FIGURE 35. DASSAULT: NET SALES, 2014-2016 ($MILLION)
FIGURE 36. DASSAULT: REVENUE SHARE BY SEGMENT, 2016 (%)
FIGURE 37. DASSAULT: REVENUE SHARE BY GEOGRAPHY, 2016(%)
FIGURE 38. HONEYWELL: NET SALES, 2014-2016 ($MILLION)
FIGURE 39. HONEYWELL: REVENUE SHARE BY SEGMENT, 2016 (%)
FIGURE 40. HONEYWELL: REVENUE SHARE BY GEOGRAPHY, 2016(%)
FIGURE 41. HUAWEI: NET SALES, 2014-2016 ($MILLION)
FIGURE 42. HUAWEI: REVENUE SHARE BY SEGMENT, 2016 (%)
FIGURE 43. HUAWEI: REVENUE SHARE BY GEOGRAPHY, 2016(%)
FIGURE 44. IBM: NET SALES, 2014-2016 ($MILLION)
FIGURE 45. IBM: REVENUE SHARE BY SEGMENT, 2016 (%)
FIGURE 46. IBM: REVENUE SHARE BY GEOGRAPHY, 2016(%)


The IIoT market holds high potential for the semiconductor industry. The current business scenario is witnessing an increase in the demand for IIoT, particularly in the developing regions. Companies in this industry adopt various innovative techniques to provide customers with advanced and innovative offerings.

Among the analyzed geographical regions, North America is expected to account for the highest revenue in the global market throughout the forecast period (2017-2023) due to innovation in advanced manufacturing technologies such as predictive maintenance, asset performance management, and real time asset monitoring. However, Asia-Pacific is expected to grow at a higher growth rate, due to lucrative opportunities offered by countries such as China, India, Singapore, South Korea, and Japan. Further, government initiatives such as Make in India and Smart Cities Mission enable manufacturers to adopt IoT technologies to improve shop floor operational efficiency, improve quality, and reduce asset downtime in Asia-Pacific.

Some of the significant players that operate in the market and are profiled in the report include Cisco Systems, Inc., General Electric, Intel Corporation, Rockwell Automation, Inc., ABB, Texas Instruments Inc., Dassault Systèmes, Honeywell International Inc., Huawei Technology Co., Ltd., and International Business Machines Corporation (IBM).

PURCHASE OPTIONS

Call or Email us

U.S.-Canada Toll-free: +1-800-792-5285
Int'l : +1-503-894-6022
Europe : +44-845-528-1300
Email : help@alliedmarketresearch.com

Looking for Customization?

 Customization Request

Have a Question?

 Speak with Analyst

Any Confusion?

 Inquire Before Buying

Have a glance of the Report

  Request Sample

Purchase Full Report of
Industrial Internet Of Things (iiot) Market

Start reading instantly.
This Report and over 68,113+ more Reports, Available with Avenue Library. T&C*.

  • Online Only
  • $3,456
  • Online cloud access only
  • Restricted print, copy, paste & download
  • Read only
  • Free industry update
    (Within 180 days)
  • Free report update in next update cycle
    (Feb 2019 - Feb 2020)
  • Data Pack
  • $3,840
  • Restricted to one authorized user
  • One print only
  • Available in
    Excel
  • Free industry update
    (Within 180 days)
  •   Free report update in next update cycle
    (Feb 2019 - Feb 2020)
  • Single User
  • $5,769
  • Restricted to one authorized user
  • One print only
  • Available in
    PDF
  • Free industry update
    (Within 180 days)
  •   Free report update in next update cycle
    (Feb 2019 - Feb 2020)
  • Five Users
  • $6,450
  • Limited to five authorized users
  • Print upto five copies
  • Available in
    PDF
  • Free industry update
    (Within 180 days)
  •   Free report update in next update cycle
    (Feb 2019 - Feb 2020)
  • Enterprise
    License/PDF

  • $10,995
  • Unlimited
    within
    company/enterprise
  • Available in Excel & PDF
  • Free industry update
    (Within 180 days)
  •   Free report update in next update cycle
    (Feb 2019 - Feb 2020)
  • Library
    Membership

  • $999 $ 1,175
    Per User/ Per month/ Billed annually
  • Published Content
    E-access
  • Company Profiles
    E-access
  • Newly Added Content Access
  • 10 PDF
    Downloads
  • 5 Excel Data
    Pack Downloads
  • 250 Company Profiles PDF Downloads
  • Buy Now

*Taxes/Fees, if applicable will be added during checkout. All prices in USD

RELATED REPORTS
 

Why Allied Market Research?


Infallible Methodology

To ensure high-level data integrity, accurate analysis, and impeccable forecasts

Analyst Support

For complete satisfaction

Customization

On-demand customization of scope of the report to exactly meet your needs

TARGETED MARKET VIEW

Targeted market view to provide pertinent information and save time of readers

Get fresh content delivered

Get insights on topics that are crucial for your business. Stay abreast of your interest areas.

Get Industry Data Alerts

Why Allied Market Research?

Infallible Methodology

To ensure high-level data integrity, accurate analysis, and impeccable forecasts

Analyst Support

For complete satisfaction

Customization

On-demand customization of scope of the report to exactly meet your needs

TARGETED MARKET VIEW

Targeted market view to provide pertinent information and save time of readers