0
2018
Industrial Smart Motors Market

Industrial Smart Motors Market

by Offering (Products and Services), End User (Pumps, Fans, Compressors, and Others), and Market Vertical (Power & Energy, Manufacturing, Automotive, Healthcare, and Others): Global Opportunity Analysis and Industry Forecast, 2018 - 2025

Report Code: A04114
Sep 2018 | Pages: 211
Tables: 101
Charts: 43
  • Formats*:

  • pdf

    Single User License, Five User
    License & Enterprise User License

  • xls

    Data Pack Excel License

  • ppt

    It comes with the additional cost
    of $2500.00 contact sales.


COVID-19

Pandemic disrupted the entire world and affected many industries.

Get detailed COVID-19 impact analysis on the Industrial Smart Motors Market

Request Now !

Industrial Smart Motors Market Overview:

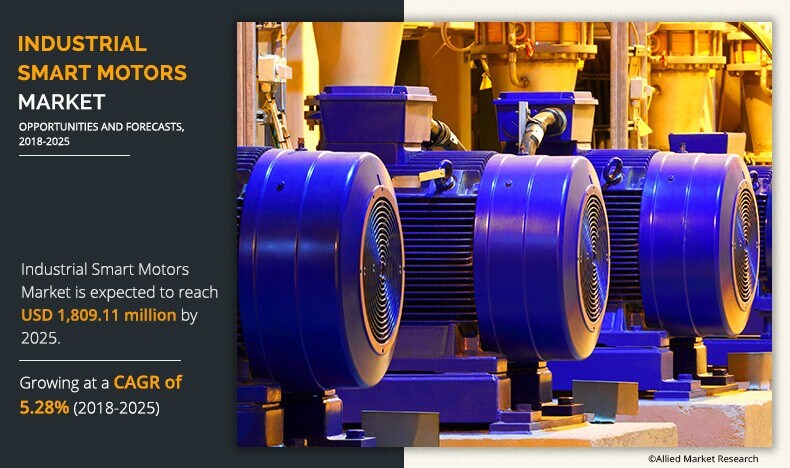
The global industrial smart motors market size was valued at $1,207.9 million in 2017 and is expected to reach $1,809.1 million by 2025, growing at a CAGR of 5.28% during the forecast period (2018‐2025). These specialized motors through the integration of Industrial Internet of Things (IIoT)-enabled services offer a superior performance to the end users.

The mechanical power transmission capabilities enable and provide huge scope for application of electric motors in numerous industrial activities and processes. Thus, these motors play a crucial role in various tasks such as material handling, pumps, compressors, conveyor systems, automation processes, and controllers. Among these, smart motors can be defined as specialized industrial motors that through the integration of sensors, processors, or electronic components offer services such as superior machine control, predictive maintenance, and advanced process control among others. Subsequently, these types of motors find substantial applications in smart manufacturing, motor driven equipment, processing equipment, material handling & packaging equipment, and original equipment manufacturer (OEM)-based products among others.

industrial smart motors market


Factors such as rise in demand for motors with superior process control and increase in emphasis on reducing downtime drive the industrial smart motors market. Further, the integration of IIoT services has enabled services such as predictive maintenance, superior machine control, improvement in motor efficiency, and downtime reduction during maintenance are expected to fuel the demand for industrial smart motors in the coming years. In addition, continuous technological advancements influence the efficiency of smart motors that boost their adoption across different end users. This is anticipated to provide numerous profitable opportunities for the market players.

However, high cost of continuous predictive maintenance is expected to negatively influence the market growth of industrial smart motors market in small and medium enterprises (SMEs) during the forecast period.

The manufacturers of smart motors offer numerous products and services, such as periodic maintenance, services, repairs, and upgradation of applications for maintaining the efficiency of smart motors. Based on offering, the market is bifurcated into products, and services. The industrial smart motor can be used across different industrial processes as well as equipment and machinery such as pumps, material handling, conveyor systems, processing equipment, controllers, industrial process instrumentation, smart manufacturing, and industrial equipment & machineries. Thus, based on end user, the market is segmented into pumps, fans, compressors, and others. Moreover, by market vertical, the market is broadly categorized into power & energy, manufacturing, automotive, healthcare, and others. In addition, to gain diverse insights based on region, the market is analyzed across North America, Europe, Asia-Pacific, and LAMEA. 

industrial smart motors market by target area


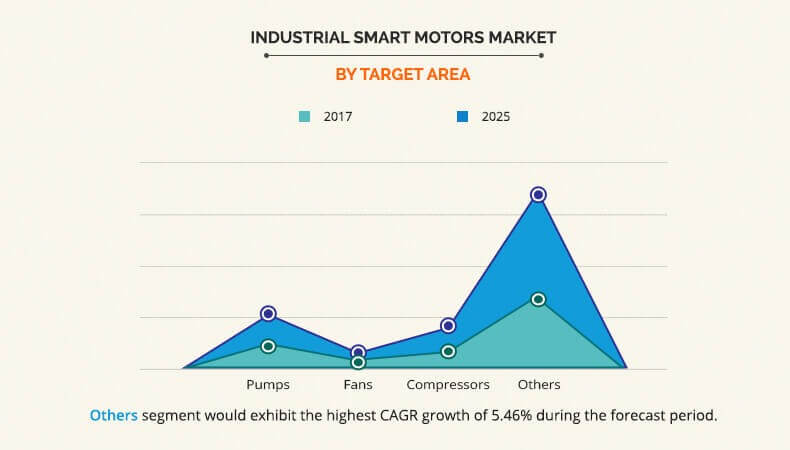
Increase in demand for energy efficiency and superior machine control of pumps drive the adoption of smart motors in pumps. However, increase in adoption of smart motors in material handling, process equipment, conveyor belts, and machinery among others has gained traction in the past few years. Thus, the others segment is expected to witness high growth at a CAGR of 5.46% from 2018 to 2025 and provide numerous profitable business opportunities for key players in the global industrial smart motors market. Moreover, based on market vertical, the manufacturing sector accounted for the highest share by revenue due to its large scope of application across different discrete manufacturing processes, equipment, machineries, and industrial tools. 

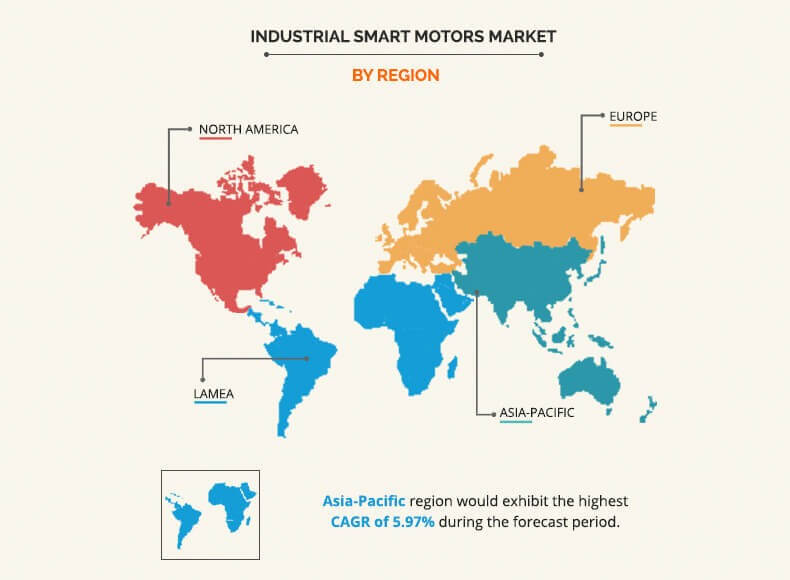
By region, Asia-Pacific dominates the industrial smart motors market due to high demand from manufacturing industries present in China and India. Increase in need to improve efficiency of manufacturing plants through superior smart motors application and integration of smart manufacturing practices are the major factors driving the growth of industrial smart motors market in this region. Further, upgrading and maintaining the existing smart motors are expected to drive the market growth of industrial smart motors market during the forecast period. Whereas, in developed regions such as North America and Europe, the integration of smart motors to improve efficiency and reduce the cost of energy are fueling the demand for smart motors across different market verticals. In addition, the investment toward aerospace and industrial robotics related projects is projected to propel the demand for the smart motors in the coming years in developed region. However, from a growth perspective, the LAMEA region is expected to witness the most lucrative CAGR growth rate of 5.97% from 2018 to 2025 due to high demand for superior motors in Middle East region.

industrial smart motors market by region


The report details a competitive analysis and profiles of the major players, such as CG Global, Dunkermotoren GmbH, HSD SpA, Nidec Corporation, Reliance Precision Limited, Rockwell Automation Inc., Schneider Electric, Somfy Systems Inc., TECHNOSOFT SA, and USAutomation in the industrial smart motors market.

Key Benefits For Industrial Smart Motors Market :

  • The report provides an extensive analysis of the current as well as emerging trends and dynamics in the global industrial smart motors market.

  • An in-depth analysis is presented by constructing market estimations for the key market segments between 2017 and 2025. 

  • An extensive analysis by following the key product positioning and monitoring of the top competitors within the market framework is conducted.

  • A comprehensive analysis of all regions is provided to determine the prevailing opportunities in these geographies.

  • The key market players are profiled, and their strategies are analyzed thoroughly to understand the competitive outlook of the industrial smart motors market.

Industrial Smart Motors  Key Market Segments :

By Offering

  • Products

  • Services

 By End User

  • Pumps

  • Fans

  • Compressors 

  • Others 

By Market Vertical 

  • Power & Energy

  • Manufacturing

  • Automotive 

  • Healthcare 

  • Others 

Key Market Players

  • CG Global

  • Dunkermotoren GmbH

  • HSD SpA

  • Nidec Corporation

  • Reliance Precision Limited

  • Rockwell Automation, Inc.

  • Schneider Electric

  • Somfy Systems, Inc

  • TECHNOSOFT SA

  • USAutomation 


Industrial Smart Motors Market Report Highlights

Aspects Details
By Offerings
  • Products
  • Services
By End-User
  • Pumps
  • Fans
  • Compressors
  • Others
By Industry Vertical
  • Power & Energy
  • Manufacturing
  • Automotive
  • Healthcare
  • Others
By Region
  • North America  (U.S., Canada, Mexico)
  • Europe  (France, Germany, Italy, Spain, UK, Russia, Rest of Europe)
  • Asia-Pacific  (China, Japan, India, South Korea, Australia, Thailand, Malaysia, Indonesia, Rest of Asia-Pacific)
  • LAMEA  (Brazil, South Africa, Saudi Arabia, UAE, Argentina, Rest of LAMEA)
Key Market Players USAutomation, CG, HSD SpA, Nidec Corporation, Rockwell Automation, Inc., Somfy Systems, Inc, Reliance Precision Limited, Technosoft SA, Dunkermotoren GmbH, Schneider Electric
 

Chapter 1: Introduction

1.1. Report description
1.2. Key benefits for stakeholders
1.3. Key market segments
1.4. Research methodology

1.4.1. Secondary research
1.4.2. Primary research
1.4.3. Analyst tools & models

Chapter 2: Executive summary

2.1. CXO perspective

Chapter 3: MARKET OVERVIEW

3.1. Market definition and scope
3.2. Key findings

3.2.1. Top impacting factors
3.2.2. Top investment pockets
3.2.3. Top winning strategies

3.3. Porter's five forces analysis
3.4. Key player positioning, 2017

3.5. Market dynamics

3.5.1. Drivers

3.5.1.1. Demand for advanced process controls in industrial motors
3.5.1.2. Increasing emphasis towards reducing the downtime during maintenance
3.5.1.3. Integration of IIoT enabled services into motor to boost performance & maintenance

3.5.2. Restraint

3.5.2.1. Challenges associated with high power rated motors
3.5.2.2. High cost of continuous predictive maintenance

3.5.3. Opportunity

3.5.3.1. Development of specialized smart industrial motors for niche market

Chapter 4: Industrial Smart Motors Market, By Offerings

4.1. Market overview

4.1.1. Market size and forecast, by type

4.2. Products

4.2.1. Key market trends, growth factors, and opportunities
4.2.2. Market size and forecast, by region
4.2.3. Market analysis, by country

4.3. Services

4.3.1. Key market trends, growth factors, and opportunities
4.3.2. Market size and forecast, by region
4.3.3. Market analysis, by country

Chapter 5: Industrial Smart Motors Market, By End-User

5.1. Market overview

5.1.1. Market size and forecast, by type

5.2. Pumps

5.2.1. Key market trends, growth factors, and opportunities
5.2.2. Market size and forecast, by region
5.2.3. Market analysis, by country

5.3. Fans

5.3.1. Key market trends, growth factors, and opportunities
5.3.2. Market size and forecast, by region
5.3.3. Market analysis, by country

5.4. Compressors

5.4.1. Key market trends, growth factors, and opportunities
5.4.2. Market size and forecast, by region
5.4.3. Market analysis, by country

5.5. Others

5.5.1. Key market trends, growth factors, and opportunities
5.5.2. Market size and forecast, by region
5.5.3. Market analysis, by country

Chapter 6: Industrial Smart Motors Market, By Industry Vertical

6.1. Market overview

6.1.1. Market size and forecast, by end-user

6.2. Power & Energy

6.2.1. Key market trends, growth factors, and opportunities
6.2.2. Market size and forecast, by region
6.2.3. Market analysis, by country

6.3. Manufacturing

6.3.1. Key market trends, growth factors, and opportunities
6.3.2. Market size and forecast, by region
6.3.3. Market analysis, by country

6.4. Automotive

6.4.1. Key market trends, growth factors, and opportunities
6.4.2. Market size and forecast, by region
6.4.3. Market analysis, by country

6.5. Healthcare

6.5.1. Key market trends, growth factors, and opportunities
6.5.2. Market size and forecast, by region
6.5.3. Market analysis, by country

6.6. Others

6.6.1. Key market trends, growth factors, and opportunities
6.6.2. Market size and forecast, by region
6.6.3. Market analysis, by country

Chapter 7: Industrial Smart Motors Market, By Region

7.1. Market overview
7.2. North America

7.2.1. Key market trends, growth factors, and opportunities
7.2.2. Market size and forecast, by offerings
7.2.3. Market size and forecast, by application
7.2.4. Market size and forecast, by market vertical
7.2.5. Market size and forecast, by country

7.2.5.1. U.S.

7.2.5.1.1. U.S. market size and forecast, by offerings
7.2.5.1.2. U.S. market size and forecast, by end-users
7.2.5.1.3. U.S. market size and forecast, by market vertical

7.2.5.2. Canada

7.2.5.2.1. Canada market size and forecast, by offerings
7.2.5.2.2. Canada market size and forecast, by end-users
7.2.5.2.3. Canada market size and forecast, by market vertical

7.2.5.3. Mexico

7.2.5.3.1. Mexico market size and forecast, by offerings
7.2.5.3.2. Mexico market size and forecast, by end-users
7.2.5.3.3. Mexico market size and forecast, by market vertical

7.3. Europe

7.3.1. Key market trends, growth factors, and opportunities
7.3.2. Market size and forecast, by offerings
7.3.3. Market size and forecast, by end-users
7.3.4. Market size and forecast, by market vertical
7.3.5. Market size and forecast, by country

7.3.5.1. UK

7.3.5.1.1. UK market size and forecast, by offerings
7.3.5.1.2. UK market size and forecast, by end-users
7.3.5.1.3. UK market size and forecast, by market vertical

7.3.5.2. Germany

7.3.5.2.1. Germany market size and forecast, by offerings
7.3.5.2.2. Germany market size and forecast, by end-users
7.3.5.2.3. Germany market size and forecast, by market vertical

7.3.5.3. France

7.3.5.3.1. France market size and forecast, by offerings
7.3.5.3.2. France market size and forecast, by end-users
7.3.5.3.3. France market size and forecast, by market vertical

7.3.5.4. Russia

7.3.5.4.1. Russia market size and forecast, by offerings
7.3.5.4.2. Russia market size and forecast, by end-users
7.3.5.4.3. Russia market size and forecast, by market vertical

7.3.5.5. Rest of Europe

7.3.5.5.1. Rest of Europe market size and forecast, by offerings
7.3.5.5.2. Rest of Europe market size and forecast, by end-users
7.3.5.5.3. Rest of Europe market size and forecast, by market vertical

7.4. Asia-Pacific

7.4.1. Key market trends, growth factors, and opportunities
7.4.2. Market size and forecast, by offerings
7.4.3. Market size and forecast, by end-users
7.4.4. Market size and forecast, by market vertical
7.4.5. Market size and forecast, by country

7.4.5.1. China

7.4.5.1.1. China market size and forecast, by offerings
7.4.5.1.2. China market size and forecast, by end-users
7.4.5.1.3. China market size and forecast, by market vertical

7.4.5.2. Japan

7.4.5.2.1. Japan market size and forecast, by offerings
7.4.5.2.2. Japan market size and forecast, by end-users
7.4.5.2.3. Japan market size and forecast, by market vertical

7.4.5.3. India

7.4.5.3.1. India market size and forecast, by offerings
7.4.5.3.2. India market size and forecast, by end-users
7.4.5.3.3. India market size and forecast, by market vertical

7.4.5.4. Rest of Asia-Pacific

7.4.5.4.1. Rest of Asia-Pacific market size and forecast, by offerings
7.4.5.4.2. Rest of Asia-Pacific market size and forecast, by end-users
7.4.5.4.3. Rest of Asia-Pacific market size and forecast, by market vertical

7.5. LAMEA

7.5.1. Key market trends, growth factors, and opportunities
7.5.2. Market size and forecast, by offerings
7.5.3. Market size and forecast, by end-users
7.5.4. Market size and forecast, by market vertical
7.5.5. Market size and forecast, by country

7.5.5.1. Latin America

7.5.5.1.1. Latin America market size and forecast, by offerings
7.5.5.1.2. Latin America market size and forecast, by end-users
7.5.5.1.3. Latin America market size and forecast, by market vertical

7.5.5.2. Middle East

7.5.5.2.1. Middle East market size and forecast, by offerings
7.5.5.2.2. Middle East market size and forecast, by end-users
7.5.5.2.3. Middle East market size and forecast, by market vertical

7.5.5.3. Africa

7.5.5.3.1. Africa market size and forecast, by offerings
7.5.5.3.2. Africa market size and forecast, by end-users
7.5.5.3.3. Africa market size and forecast, by market vertical

Chapter 8: Company profiles

8.1. CG

8.1.1. Company overview
8.1.2. Company snapshot
8.1.3. Product portfolio
8.1.4. Business performance

8.2. Dunkermotoren GmbH

8.2.1. Company overview
8.2.2. Company snapshot
8.2.3. Operating business segments
8.2.4. Product portfolio

8.3. HSD SpA

8.3.1. Company overview
8.3.2. Company snapshot
8.3.3. Product portfolio

8.4. Nidec Corporation

8.4.1. Company overview
8.4.2. Company snapshot
8.4.3. Operating business segments
8.4.4. Product portfolio
8.4.5. Business performance
8.4.6. Key strategic moves and developments

8.5. Reliance Precision Limited

8.5.1. Company overview
8.5.2. Company snapshot
8.5.3. Product portfolio
8.5.4. Business performance

8.6. Rockwell Automation, Inc.

8.6.1. Company overview
8.6.2. Company snapshot
8.6.3. Product portfolio
8.6.4. Business performance

8.7. Schneider Electric

8.7.1. Company overview
8.7.2. Company snapshot
8.7.3. Operating business segments
8.7.4. Product portfolio
8.7.5. Business performance
8.7.6. Key strategic moves and developments

8.8. Somfy Systems, Inc

8.8.1. Company overview
8.8.2. Company snapshot
8.8.3. Operating business segments
8.8.4. Product portfolio
8.8.5. Business performance

8.9. Technosoft SA

8.9.1. Company overview
8.9.2. Company snapshot
8.9.3. Operating business segments
8.9.4. Product portfolio
8.9.5. Key strategic moves and developments

8.10. USAutomation

8.10.1. Company overview
8.10.2. Company snapshot
8.10.3. Operating business segments
8.10.4. Product portfolio

LIST OF TABLES

TABLE 01. GLOBAL INDUSTRIAL SMART MOTORS MARKET REVENUE, BY OFFERINGS, 2017-2025 ($MILLION)
TABLE 02. INDUSTRIAL SMART MOTORS MARKET REVENUE FOR PRODUCTS, BY REGION, 2017-2025 ($MILLION)
TABLE 03. INDUSTRIAL SMART MOTORS MARKET REVENUE FOR SERVICES, BY REGION, 2017-2025 ($MILLION)
TABLE 04. GLOBAL INDUSTRIAL SMART MOTORS MARKET REVENUE, BY END-USERS, 2017-2025 ($MILLION)
TABLE 05. INDUSTRIAL SMART MOTORS MARKET REVENUE FOR PUMPS, BY REGION, 2017-2025 ($MILLION)
TABLE 06. INDUSTRIAL SMART MOTORS MARKET REVENUE FOR FANS, BY REGION, 2017-2025 ($MILLION)
TABLE 07. INDUSTRIAL SMART MOTORS MARKET REVENUE FOR COMPRESSORS, BY REGION, 2017-2025 ($MILLION)
TABLE 08. INDUSTRIAL SMART MOTORS MARKET REVENUE FOR OTHERS, BY REGION, 2017-2025 ($MILLION)
TABLE 09. GLOBAL INDUSTRIAL SMART MOTORS MARKET REVENUE, BY MARKET VERTICAL, 2017-2025 ($MILLION)
TABLE 10. INDUSTRIAL SMART MOTORS MARKET REVENUE FOR POWER & ENERGY, BY REGION, 2017-2025 ($MILLION)
TABLE 11. INDUSTRIAL SMART MOTORS MARKET REVENUE FOR MANUFACTURING, BY REGION, 2017-2025 ($MILLION)
TABLE 12. INDUSTRIAL SMART MOTORS MARKET REVENUE FOR AUTOMOTIVE, BY REGION, 2017-2025 ($MILLION)
TABLE 13. INDUSTRIAL SMART MOTORS MARKET REVENUE FOR HEALTHCARE, BY REGION, 2017-2025 ($MILLION)
TABLE 14. INDUSTRIAL SMART MOTORS MARKET REVENUE FOR OTHERS, BY REGION, 2017-2025 ($MILLION)
TABLE 15. NORTH AMERICA INDUSTRIAL SMART MOTORS MARKET, BY OFFERINGS, 2017-2025 ($MILLION)
TABLE 16. NORTH AMERICA INDUSTRIAL SMART MOTORS MARKET, BY APPLICAITON, 2017-2025 ($MILLION)
TABLE 17. NORTH AMERICA INDUSTRIAL SMART MOTORS MARKET, BY MARKET VERTICAL, 2017-2025 ($MILLION)
TABLE 18. NORTH AMERICA INDUSTRIAL SMART MOTORS MARKET REVENUE, BY COUNTRY, 2017-2025 ($MILLION)
TABLE 19. U.S. INDUSTRIAL SMART MOTORS MARKET, BY OFFERINGS, 2017-2025 ($MILLION)
TABLE 20. U.S. INDUSTRIAL SMART MOTORS MARKET, BY END-USERS, 2017-2025 ($MILLION)
TABLE 21. U.S. INDUSTRIAL SMART MOTORS MARKET, BY MARKET VERTICAL, 2017-2025 ($MILLION)
TABLE 22. CANADA INDUSTRIAL SMART MOTORS MARKET, BY OFFERINGS, 2017-2025 ($MILLION)
TABLE 23. CANADA INDUSTRIAL SMART MOTORS MARKET, BY END-USERS, 2017-2025 ($MILLION)
TABLE 24. CANADA INDUSTRIAL SMART MOTORS MARKET, BY MARKET VERTICAL, 2017-2025 ($MILLION)
TABLE 25. MEXICO INDUSTRIAL SMART MOTORS MARKET, BY OFFERINGS, 2017-2025 ($MILLION)
TABLE 26. MEXICO INDUSTRIAL SMART MOTORS MARKET, BY END-USERS, 2017-2025 ($MILLION)
TABLE 27. MEXICOA INDUSTRIAL SMART MOTORS MARKET, BY MARKET VERTICAL, 2017-2025 ($MILLION)
TABLE 28. EUROPE INDUSTRIAL SMART MOTORS MARKET, BY OFFERINGS, 2017-2025 ($MILLION)
TABLE 29. EUROPE INDUSTRIAL SMART MOTORS MARKET, BY END-USERS, 2017-2025 ($MILLION)
TABLE 30. EUROPE INDUSTRIAL SMART MOTORS MARKET, BY MARKET VERTICAL, 2017-2025 ($MILLION)
TABLE 31. EUROPE INDUSTRIAL SMART MOTORS MARKET REVENUE, BY COUNTRY, 2017-2025 ($MILLION)
TABLE 32. UK INDUSTRIAL SMART MOTORS MARKET, BY OFFERINGS, 2017-2025 ($MILLION)
TABLE 33. UK INDUSTRIAL SMART MOTORS MARKET, BY END-USERS, 2017-2025 ($MILLION)
TABLE 34. UK INDUSTRIAL SMART MOTORS MARKET, BY MARKET VERTICAL, 2017-2025 ($MILLION)
TABLE 35. GERMANY INDUSTRIAL SMART MOTORS MARKET, BY OFFERINGS, 2017-2025 ($MILLION)
TABLE 36. GERMANY INDUSTRIAL SMART MOTORS MARKET, BY END-USERS, 2017-2025 ($MILLION)
TABLE 37. GERMANY INDUSTRIAL SMART MOTORS MARKET, BY MARKET VERTICAL, 2017-2025 ($MILLION)
TABLE 38. FRANCE INDUSTRIAL SMART MOTORS MARKET, BY OFFERINGS, 2017-2025 ($MILLION)
TABLE 39. FRANCE INDUSTRIAL SMART MOTORS MARKET, BY END-USERS, 2017-2025 ($MILLION)
TABLE 40. FRANCE INDUSTRIAL SMART MOTORS MARKET, BY MARKET VERTICAL, 2017-2025 ($MILLION)
TABLE 41. RUSSIA INDUSTRIAL SMART MOTORS MARKET, BY OFFERINGS, 2017-2025 ($MILLION)
TABLE 42. RUSSIA INDUSTRIAL SMART MOTORS MARKET, BY END-USERS, 2017-2025 ($MILLION)
TABLE 43. RUSSIA INDUSTRIAL SMART MOTORS MARKET, BY MARKET VERTICAL, 2017-2025 ($MILLION)
TABLE 44. REST OF EUROPE INDUSTRIAL SMART MOTORS MARKET, BY OFFERINGS, 2017-2025 ($MILLION)
TABLE 45. REST OF EUROPE INDUSTRIAL SMART MOTORS MARKET, BY END-USERS, 2017-2025 ($MILLION)
TABLE 46. REST OF EUROPE INDUSTRIAL SMART MOTORS MARKET, BY MARKET VERTICAL, 2017-2025 ($MILLION)
TABLE 47. ASIA-PACIFIC INDUSTRIAL SMART MOTORS MARKET, BY OFFERINGS, 2017-2025 ($MILLION)
TABLE 48. ASIA-PACIFIC INDUSTRIAL SMART MOTORS MARKET, BY APPLICAITON, 2017-2025 ($MILLION)
TABLE 49. ASIA-PACIFIC INDUSTRIAL SMART MOTORS MARKET, BY MARKET VERTICAL, 2017-2025 ($MILLION)
TABLE 50. ASIA-PACIFIC INDUSTRIAL SMART MOTORS MARKET REVENUE, BY COUNTRY, 2017-2025 ($MILLION)
TABLE 51. CHINA INDUSTRIAL SMART MOTORS MARKET, BY OFFERINGS, 2017-2025 ($MILLION)
TABLE 52. CHINA INDUSTRIAL SMART MOTORS MARKET, BY END-USERS, 2017-2025 ($MILLION)
TABLE 53. CHINA INDUSTRIAL SMART MOTORS MARKET, BY MARKET VERTICAL, 2017-2025 ($MILLION)
TABLE 54. JAPAN INDUSTRIAL SMART MOTORS MARKET, BY OFFERINGS, 2017-2025 ($MILLION)
TABLE 55. JAPAN INDUSTRIAL SMART MOTORS MARKET, BY END-USERS, 2017-2025 ($MILLION)
TABLE 56. JAPAN INDUSTRIAL SMART MOTORS MARKET, BY MARKET VERTICAL, 2017-2025 ($MILLION)
TABLE 57. INDIA INDUSTRIAL SMART MOTORS MARKET, BY OFFERINGS, 2017-2025 ($MILLION)
TABLE 58. INDIA INDUSTRIAL SMART MOTORS MARKET, BY END-USERS, 2017-2025 ($MILLION)
TABLE 59. INDIA INDUSTRIAL SMART MOTORS MARKET, BY MARKET VERTICAL, 2017-2025 ($MILLION)
TABLE 60. REST OF ASIA-APCIFIC INDUSTRIAL SMART MOTORS MARKET, BY OFFERINGS, 2017-2025 ($MILLION)
TABLE 61. REST OF ASIA-PACIFIC INDUSTRIAL SMART MOTORS MARKET, BY END-USERS, 2017-2025 ($MILLION)
TABLE 62. REST OF ASIA-PACIFIC INDUSTRIAL SMART MOTORS MARKET, BY MARKET VERTICAL, 2017-2025 ($MILLION)
TABLE 63. LAMEA INDUSTRIAL SMART MOTORS MARKET, BY OFFERINGS, 2017-2025 ($MILLION)
TABLE 64. LAMEA INDUSTRIAL SMART MOTORS MARKET, BY APPLICAITON, 2017-2025 ($MILLION)
TABLE 65. LAMEA INDUSTRIAL SMART MOTORS MARKET, BY MARKET VERTICAL, 2017-2025 ($MILLION)
TABLE 66. LAMEA INDUSTRIAL SMART MOTORS MARKET REVENUE, BY COUNTRY, 2017-2025 ($MILLION)
TABLE 67. LATIN AMERICA INDUSTRIAL SMART MOTORS MARKET, BY OFFERINGS, 2017-2025 ($MILLION)
TABLE 68. LATIN AMERICA INDUSTRIAL SMART MOTORS MARKET, BY END-USERS, 2017-2025 ($MILLION)
TABLE 69. LATIN AMERICA INDUSTRIAL SMART MOTORS MARKET, BY MARKET VERTICAL, 2017-2025 ($MILLION)
TABLE 70. MIDDLE EAST INDUSTRIAL SMART MOTORS MARKET, BY OFFERINGS, 2017-2025 ($MILLION)
TABLE 71. MIDDLE EAST INDUSTRIAL SMART MOTORS MARKET, BY END-USERS, 2017-2025 ($MILLION)
TABLE 72. MIDDLE EAST INDUSTRIAL SMART MOTORS MARKET, BY MARKET VERTICAL, 2017-2025 ($MILLION)
TABLE 73. AFRICA INDUSTRIAL SMART MOTORS MARKET, BY OFFERINGS, 2017-2025 ($MILLION)
TABLE 74. AFRICA INDUSTRIAL SMART MOTORS MARKET, BY END-USERS, 2017-2025 ($MILLION)
TABLE 75. AFRICA INDUSTRIAL SMART MOTORS MARKET, BY MARKET VERTICAL, 2017-2025 ($MILLION)
TABLE 76. CG: COMPANY SNAPSHOT
TABLE 77. CG: PRODUCT PORTFOLIO
TABLE 78. DUNKERMOTOREN GMBH: COMPANY SNAPSHOT
TABLE 79. DUNKERMOTOREN GMBH: OPERATING DIVISION
TABLE 80. DUNKERMOTOREN GMBH: PRODUCT PORTFOLIO
TABLE 81. HSD SPA: COMPANY SNAPSHOT
TABLE 82. HSD SPA: PRODUCT PORTFOLIO
TABLE 83. NIDEC CORPORATION: COMPANY SNAPSHOT
TABLE 84. NIDEC CORPORATION: OPERATING SEGMENTS
TABLE 85. NIDEC CORPORATION: PRODUCT PORTFOLIO
TABLE 86. RELIANCE PRECISION LIMITED: COMPANY SNAPSHOT
TABLE 87. RELIANCE PRECISION LIMITED: PRODUCT PORTFOLIO
TABLE 88. ROCKWELL AUTOMATION, INC.: COMPANY SNAPSHOT
TABLE 89. ROCKWELL AUTOMATION, INC.: PRODUCT PORTFOLIO
TABLE 90. SCHNEIDER ELECTRIC: COMPANY SNAPSHOT
TABLE 91. SCHNEIDER ELECTRIC: PRODUCT CATEGORIES
TABLE 92. SCHNEIDER ELECTRIC: PRODUCT PORTFOLIO
TABLE 93. SOMFY SYSTEMS, INC: COMPANY SNAPSHOT
TABLE 94. SOMFY SYSTEMS, INC: PRODUCT CATEGORIES
TABLE 95. SOMFY SYSTEMS, INC: PRODUCT PORTFOLIO
TABLE 96. TECHNOSOFT SA: COMPANY SNAPSHOT
TABLE 97. TECHNOSOFT SA: OPERATING SEGMENTS
TABLE 98. TECHNOSOFT SA: PRODUCT PORTFOLIO
TABLE 99. USAUTOMATION: COMPANY SNAPSHOT
TABLE 100. USAUTOMATION: PRODUCT CATEGORIES
TABLE 101. USAUTOMATION: PRODUCT PORTFOLIO

LIST OF FIGURES

FIGURE 01. GLOBAL INDUSTRIAL SMART MARKET, 2017-2025
FIGURE 02. GLOBAL INDUSTRIAL SMART MOTORS MARKET: KEY PLAYERS
FIGURE 03. TOP IMPACTING FACTORS
FIGURE 04. TOP INVESTMENT POCKETS
FIGURE 05. MODERATE-TO-HIGH BARGAINING POWER OF SUPPLIERS
FIGURE 06. MODERATE BARGAINING POWER OF BUYERS
FIGURE 07. MODERATE THREAT OF SUBSTITUTES
FIGURE 08. MODERATE-TO-LOW THREAT OF NEW ENTRANTS
FIGURE 09. MODERATE COMPETITIVE RIVALRY
FIGURE 10. KEY PLAYER POSITIONING, 2017
FIGURE 11. GLOBAL INDUSTRIAL SMART MOTORS MARKET: DRIVERS, RESTRAINTS, AND OPPORTUNITIES
FIGURE 12. INDUSTRIAL SMART MOTORS MARKET SHARE FOR PRODUCTS, BY COUNTRIES 2018 & 2025 (%)
FIGURE 13. INDUSTRIAL SMART MOTORS MARKET SHARE FOR SERVICES, BY COUNTRIES 2018 & 2025 (%)
FIGURE 14. INDUSTRIAL SMART MOTORS MARKET SHARE FOR PUMPS, BY COUNTRIES 2018 & 2025 (%)
FIGURE 15. INDUSTRIAL SMART MOTORS MARKET SHARE FOR FANS, BY COUNTRIES 2018 & 2025 (%)
FIGURE 16. INDUSTRIAL SMART MOTORS MARKET SHARE FOR COMPRESSORS, BY COUNTRIES 2018 & 2025 (%)
FIGURE 17. INDUSTRIAL SMART MOTORS MARKET SHARE FOR OTHERS, BY COUNTRIES 2018 & 2025 (%)
FIGURE 18. INDUSTRIAL SMART MOTORS MARKET SHARE FOR POWER & ENERGY, BY COUNTRIES 2018 & 2025 (%)
FIGURE 19. INDUSTRIAL SMART MOTORS MARKET SHARE FOR MANUFACTURING, BY COUNTRIES 2018 & 2025 (%)
FIGURE 20. INDUSTRIAL SMART MOTORS MARKET SHARE FOR AUTOMOTIVE, BY COUNTRIES 2018 & 2025 (%)
FIGURE 21. INDUSTRIAL SMART MOTORS MARKET SHARE FOR HEALTHCARE, BY COUNTRIES 2018 & 2025 (%)
FIGURE 22. INDUSTRIAL SMART MOTORS MARKET SHARE FOR OTHERS, BY COUNTRIES 2018 & 2025 (%)
FIGURE 23. U.S. INDUSTRIAL SMART MOTORS MARKET REVENUE, 2017-2025 ($MILLION)
FIGURE 24. CANADA INDUSTRIAL SMART MOTORS MARKET REVENUE, 2017-2025 ($MILLION)
FIGURE 25. MEXICO INDUSTRIAL SMART MOTORS MARKET REVENUE, 2017-2025 ($MILLION)
FIGURE 26. UK INDUSTRIAL SMART MOTORS MARKET REVENUE, 2017-2025 ($MILLION)
FIGURE 27. GERMANY INDUSTRIAL SMART MOTORS MARKET REVENUE, 2017-2025 ($MILLION)
FIGURE 28. FRANCE INDUSTRIAL SMART MOTORS MARKET REVENUE, 2017-2025 ($MILLION)
FIGURE 29. RUSSIA INDUSTRIAL SMART MOTORS MARKET REVENUE, 2017-2025 ($MILLION)
FIGURE 30. REST OF EUROPE INDUSTRIAL SMART MOTORS MARKET REVENUE, 2017-2025 ($MILLION)
FIGURE 31. CHINA INDUSTRIAL SMART MOTORS MARKET REVENUE, 2017-2025 ($MILLION)
FIGURE 32. JAPAN INDUSTRIAL SMART MOTORS MARKET REVENUE, 2017-2025 ($MILLION)
FIGURE 33. INDIA INDUSTRIAL SMART MOTORS MARKET REVENUE, 2017-2025 ($MILLION)
FIGURE 34. REST OF ASIA-PACIFIC INDUSTRIAL SMART MOTORS MARKET REVENUE, 2017-2025 ($MILLION)
FIGURE 35. LATIN AMERICA INDUSTRIAL SMART MOTORS MARKET REVENUE, 2017-2025 ($MILLION)
FIGURE 36. MIDDLE EAST INDUSTRIAL SMART MOTORS MARKET REVENUE, 2017-2025 ($MILLION)
FIGURE 37. AFRICA INDUSTRIAL SMART MOTORS MARKET REVENUE, 2017-2025 ($MILLION)
FIGURE 38. NIDEC CORPORATION: REVENUE, 20152017 ($MILLION)
FIGURE 39. NIDEC CORPORATION: REVENUE SHARE BY SEGMENT, 2017 (%)
FIGURE 40. NIDEC CORPORATION: REVENUE SHARE BY GEOGRAPHY, 2017 (%)
FIGURE 41. SCHNEIDER ELECTRIC: REVENUE, 20152017 ($MILLION)
FIGURE 42. SPIRAX-SARCO ENGINEERING PLC: REVENUE SHARE BY DIVISION, 2017 (%)
FIGURE 43. SCHNEIDER ELECTRIC: REVENUE SHARE BY GEOGRAPHY, 2017 (%)


Smart motors constitute specialized motors that integrate sensors, microprocessor chips, and software programs to offer IoT-enabled features. The industrial smart motors improve the performance of motors and subsequently improve efficiency of the machinery or equipment. For instance, the smart motors offer reduced downtime during maintenance & services, superior machine control, predictive maintenance, and efficient energy consumption. As a result, the industrial smart motors find applications in smart manufacturing, discrete process automation, smart controllers, drives, motor driven equipment, conveyor systems, and materials handling. Subsequently, the industrial smart motors are increasingly being adopted across different market verticals such as manufacturing, power & energy, automotive, industrial robotics, aerospace, packaging industry, and healthcare among others.    

The constant upgrade of industrial machineries and equipment to achieve superior operation efficiency of the plant is expected to propel the demand for industrial smart motors in Asia-Pacific. Further, the growth in popularity of industrial internet of things (IIoT)-enabled equipment and products is increasingly gaining popularity among manufacturers owing to their versatile benefits and subsequently is expected to boost the growth of industrial smart motors market. This is also anticipated to boost the demand for industrial smart motors market in the coming years.    

PURCHASE OPTIONS

Call or Email us

U.S.-Canada Toll-free: +1-800-792-5285
Int'l : +1-503-894-6022
Europe : +44-845-528-1300
Email : help@alliedmarketresearch.com

Looking for Customization?

 Customization Request

Have a Question?

 Speak with Analyst

Any Confusion?

 Inquire Before Buying

Have a glance of the Report

  Request Sample

Purchase Full Report of
Industrial Smart Motors Market

Start reading instantly.
This Report and over 67,404+ more Reports, Available with Avenue Library. T&C*.

  • Online Only
  • $3,456
  • Online cloud access only
  • Restricted print, copy, paste & download
  • Read only
  • Free industry update
    (Within 180 days)
  • Free report update in next update cycle
    (Sep 2019 - Sep 2020)
  • Data Pack
  • $3,840
  • Restricted to one authorized user
  • One print only
  • Available in
    Excel
  • Free industry update
    (Within 180 days)
  •   Free report update in next update cycle
    (Sep 2019 - Sep 2020)
  • Single User
  • $5,769
  • Restricted to one authorized user
  • One print only
  • Available in
    PDF
  • Free industry update
    (Within 180 days)
  •   Free report update in next update cycle
    (Sep 2019 - Sep 2020)
  • Five Users
  • $6,450
  • Limited to five authorized users
  • Print upto five copies
  • Available in
    PDF
  • Free industry update
    (Within 180 days)
  •   Free report update in next update cycle
    (Sep 2019 - Sep 2020)
  • Enterprise
    License/PDF

  • $10,995
  • Unlimited
    within
    company/enterprise
  • Available in Excel & PDF
  • Free industry update
    (Within 180 days)
  •   Free report update in next update cycle
    (Sep 2019 - Sep 2020)
  • Library
    Membership

  • $999 $ 1,175
    Per User/ Per month/ Billed annually
  • Published Content
    E-access
  • Company Profiles
    E-access
  • Newly Added Content Access
  • 10 PDF
    Downloads
  • 5 Excel Data
    Pack Downloads
  • 250 Company Profiles PDF Downloads
  • Buy Now

*Taxes/Fees, if applicable will be added during checkout. All prices in USD

RELATED REPORTS
 

Why Allied Market Research?


Infallible Methodology

To ensure high-level data integrity, accurate analysis, and impeccable forecasts

Analyst Support

For complete satisfaction

Customization

On-demand customization of scope of the report to exactly meet your needs

TARGETED MARKET VIEW

Targeted market view to provide pertinent information and save time of readers

Get fresh content delivered

Get insights on topics that are crucial for your business. Stay abreast of your interest areas.

Get Industry Data Alerts

Why Allied Market Research?

Infallible Methodology

To ensure high-level data integrity, accurate analysis, and impeccable forecasts

Analyst Support

For complete satisfaction

Customization

On-demand customization of scope of the report to exactly meet your needs

TARGETED MARKET VIEW

Targeted market view to provide pertinent information and save time of readers