0
New
New
2023
Infant Nutrition Market

Infant Nutrition Market

by Product Type (Follow-on Milk, Specialty baby milk, Infant Milk, Prepared baby food, Dried baby food), by Form (Solid baby food, Liquid baby food), by Distribution Channel (E-Commerce, Offline channel): Global Opportunity Analysis and Industry Forecast, 2023-2032

Report Code: A05800
Jul 2023 | Pages: 262
Tables: 143
Charts: 75
  • Formats*:

  • pdf

    Single User License, Five User
    License & Enterprise User License

  • xls

    Data Pack Excel License

  • ppt

    It comes with the additional cost
    of $2500.00 contact sales.


Infant Nutrition Market Research, 2032

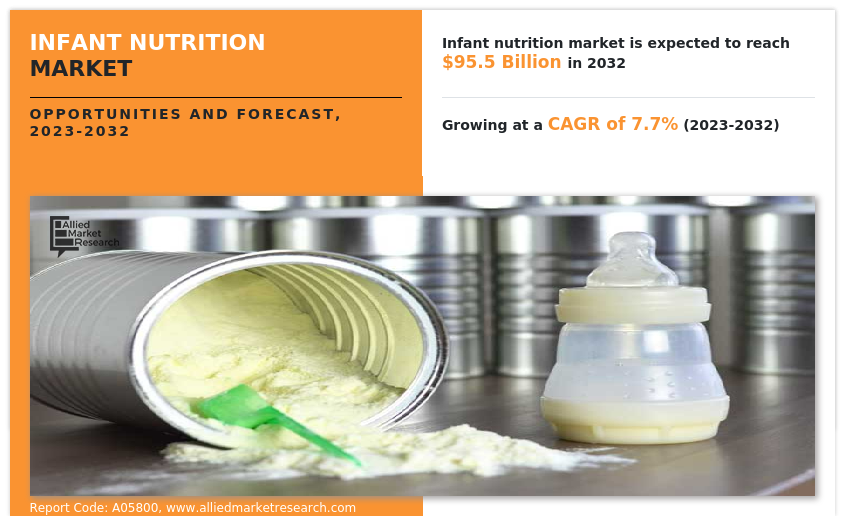
The global infant nutrition market was valued at $45.5 billion in 2022, and is projected to reach $95.5 billion by 2032, growing at a CAGR of 7.7% from 2023 to 2032.
Infant food sales are heavily reliant on customer understanding of the importance of giving their children a balanced diet. Since their populations and disposable income are both expanding on a par, the demand for infant meals is stronger in emerging nations. The baby feeding market is always expanding, and the key to survival is acquisition and new launch.

Infant Nutrition Market

One of the most important factors that affects a child's development is nutrition. A wide variety of newborn formulae and baby food products are included in the market for infant nutrition. Infant nutrition is manufactured from powdered or liquid baby food and is produced for feeding babies & infants, who are typically under the age of one year. Infant nutrition enhances cognitive function & development of babies, shields them from allergies, and boosts immune & digestive health.  

Moreover, the only other time of baby’s high development after pregnancy is during infancy. To achieve proper growth and organ development, the diet must be optimized. Maintaining optimum nutrition is one of the crucial aspects of infancy, with a great focus being placed on the developmental foundations of health and disease, a theory that was pioneered by the Barker hypothesis. Intrauterine growth restriction (IUGR), which is accompanied by poor organogenesis and lower birth weight, can result from undernutrition during the fetal stage brought on by placental, maternal, or fetal circumstances. While postnatal growth limitation in the neonatal and post-neonatal period is mostly an acquired condition due to poor food intake, fetal nutrition is typically not impaired until an excessive degree of maternal malnutrition occurs. 

Furthermore, the demand for dried baby food has considerably increased over the years due to rise in awareness about the benefit of balanced nutrition for baby. Longer shelf life of dried baby food products fosters the market to some extent. Change in socio-economic factors and improvement in living standard due to considerable increase in disposable income have led to the growth of infant nutrition market. Increase in population of women professionals, short maternity leave period, and time-constraints for home food preparation have further increased the adoption of baby food products, which has helped increase the infant nutrition market size. 

Dietary practices regarding baby food have evolved over the years. In addition, there is increase in awareness among consumers about the importance of adequate nutrition for healthy growth of infants. Owing to this, numerous brands have upgraded the nutritional components in their baby food products by adding functional & organic ingredients, which further fuels the infant nutrition market growth. 

Over time, dietary guidelines for feeding infants have changed. Moreover, customers are becoming more aware of the significance of proper nutrition for an infant's healthy development. As a result, many companies have improved the nutritional value of their infant food products by incorporating organic and useful ingredients. In addition, the government launched programmes to raise awareness about baby care. Moreover, a rise in internet advertising for baby food-related products contributes to the market's expansion. 

Over the past few years, the global per capita income has grown rapidly, especially in emerging economies. In many developing and developed markets, increase in urbanization, rising middle class consumption, and rise in rates of female labor force participation promoted the adoption of convenience-oriented lifestyles, increase in consumer demand for infant nutrition products such as baby formula and prepared baby food. Moreover, per capita income in emerging countries will rise significantly during the next ten years, as a result of which, the market will likely rise in the forecast year. 

Up until the age of six months, mother's milk is the finest source of nutrients for newborns. Women make up 39% of the global labor force, according to figures from the International Labour Organisation (ILO). In addition, many working women begin their careers soon after giving birth. As a result, prepared baby foods and formulas present an alluring alternative for working mothers, satisfying their demand for wholesome food for their newborns and supporting the market for infant nutrition. 

Major market companies are able to survive in the customer-focused market owing to consistent innovation in product functionality and performance as well as coherent tactics such customized packaging that reflect the nutritious elements of the infant food items. Moreover, appealing and practical packaging is a top priority for top manufacturers. Infant food items should be packaged in tamper-proof containers to ensure the highest level of food safety. In addition, social and environmental issues are now expected on a global scale; as a result, businesses must embrace green standards for product design, packaging, and other value chain components, which can help increase the infant nutrition market share of such companies. 

However, for the first six months after birth, breastfeeding is a requirement for babies as it provides virtually all of the nutrients needed for their overall growth. The collective efforts of various organizations, including the WHO, the Canadian Public Health Agency, and the UNICEF have raised women's awareness of breastfeeding and its advantages. These non-profit organizations’ initiatives, thereby promoting breastfeeding among lactating women, may restrain the infant nutrition market demand. 

As part of their ongoing endeavor to quantify the nutritional and functional qualities of human milk in newborn products, players in infant formula have evaluated a variety of substances. As a result, there has been a gradual increase in the number of infant formulae that are supplemented with prebiotics and probiotics. Commercial infant formulae are now supplemented with prebiotics and probiotics that have been designated as GRAS (generally recognized as safe) by the FDA. Manufacturers may see this as a chance to increase sales of their goods. 

Organic products have been gaining steady share in the retail market. Moreover, organic infant nutrition is one of the fastest growing segments in the food industry. Change in purchasing behavior pattern among the consumers creates huge opportunities for the organic baby food sector. In addition, the preference for organic and clean-labelled products increased significantly, due to increase in health consciousness among consumers. However, stringent quality checks and strict mandates by the government and food departments have posed major restraints for the infant nutrition market.  

Segmental Overview 

The Infant nutrition market is segmented on the basis of product type, form, distribution channel, and region. Depending on product type, it is categorized into follow-on milk, specialty baby milk, infant milk, prepared baby food, and dried baby food. According to form, it is bifurcated into solid baby food and liquid baby food. As per distribution channel, it is divided into e-commerce and offline channels. Moreover, the market is further classified into third-level segmentation through the distribution channel. Depending on offline channel, it is fragmented into hypermarkets/supermarkets, convenience stores, pharmacy, and others. Region wise, the market is analyzed across North America (the U.S., Canada, and Mexico), Europe (Germany, France, UK, Italy, Spain, Switzerland, and rest of Europe), Asia-Pacific (China, India, Japan, South Korea, Australia, and rest of Asia-Pacific), and LAMEA (Brazil, South Africa, UAE, and rest of LAMEA). 
Infant Nutrition Market

By Product Type 

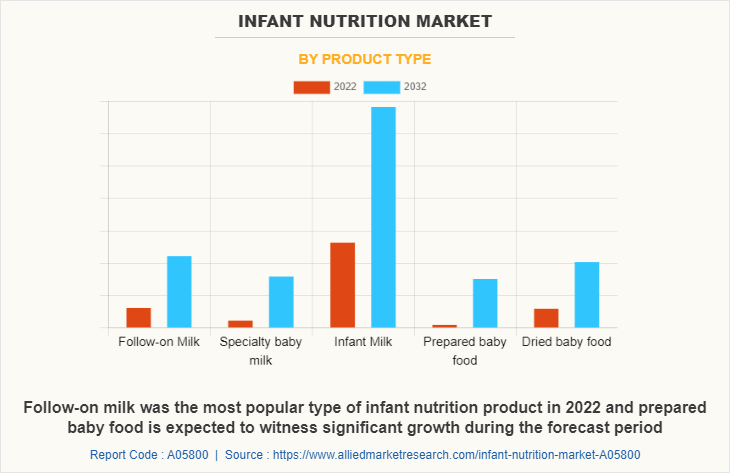
Depending on product type, the infant milk segment dominated the market in 2022, garnering around two-fifths of the market share; moreover, the prepared baby food segment is expected to grow at the highest CAGR of 8.6% from 2023 to 2032. In addition, newborn milk segment is introduced in gas-tight composites, which keeps the product fresh and extends its shelf life, contributing to the expansion of the newborn feeding business. In addition, as infant milk is intended to replace human breast milk (HBM), extra consideration is paid to the fat analogues in infant milk to imitate HMF analogues. The current trend in the newborn nutrition market is to create fat analogues by integrating palmitic acid in fatty acids through a lipase-catalyzed reaction to increase infant milk digestion and fat and mineral absorption, which can bring positive growth opportunities for the infant nutrition market forecast. 
Infant Nutrition Market

By Form 

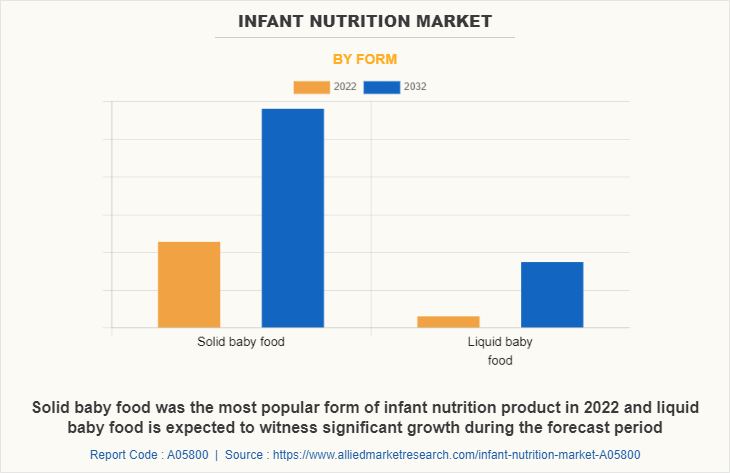
By form, the solid baby food segment dominated the market in 2022, garnering around three-fourth of the market share. Moreover, the liquid baby food segment is expected to grow at the highest CAGR of 8.0% from 2023 to 2032. In addition, major market players are able to survive in the consumer-centric market, which is the current trend in solid baby food, owing to continuous innovation in product functionality and performance along with coherent strategies such as tailored packaging that reflect the healthy ingredients of the products. Due to the fact that many working women begin their careers soon after giving birth, solid baby food is an appealing alternative for working mothers, satisfying their need for wholesome, nutritional meals for their babies, and contributing to the expansion of the infant nutrition market.   
Infant Nutrition Market

By Distribution Channel 

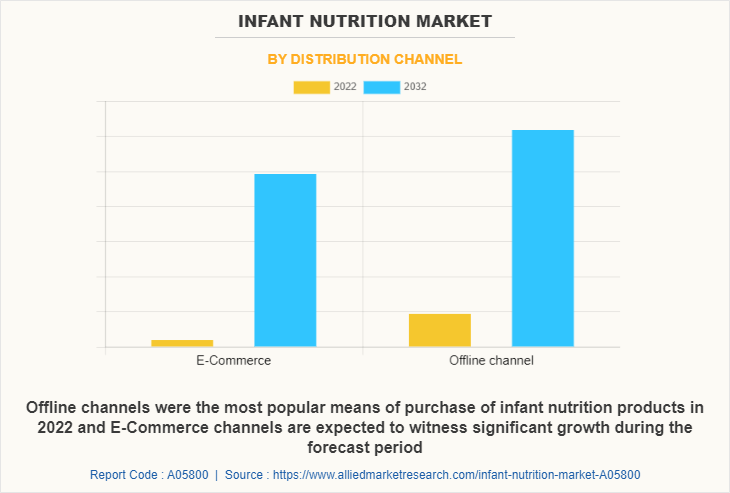
According to distribution channel, the offline channel segment dominated the market in 2022, garnering majority of the market share. Moreover, the e-commerce segment is expected to grow at the highest CAGR of 7.9% from 2023 to 2032. In addition, the offline channel provides a vast collection of product portfolios from many domains in the market; thus, making it simply accessible for the clients. It is an organized store having both domestic as well as global presence that has a vast selection of infant nutrition. These kinds of stores provide customers with access to niche products that are available on the market. As a result, the development of offline channels in numerous locations opens up lucrative prospects for the expansion of the Infant nutrition market. Through these channels, manufacturers provide special discounts and encourage hypermarket & supermarket chains to sell their own goods, which significantly increases the sale of infant nutrition products. 
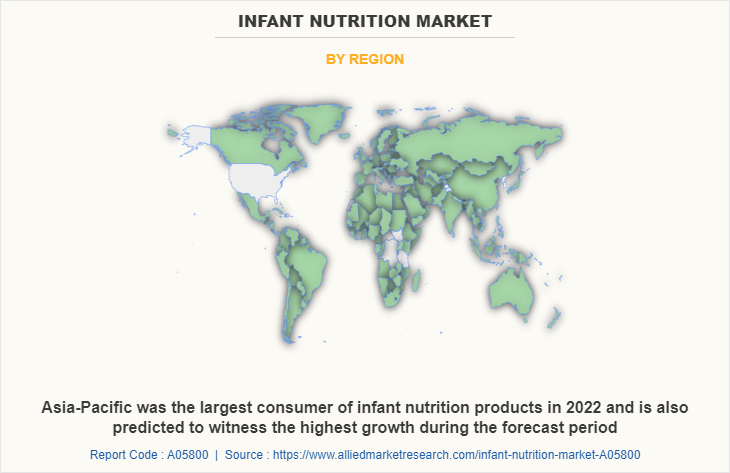
Infant Nutrition Market

By Region 

Region wise, Asia-Pacific dominated the market in 2022, garnering a market share of 44.1%. The demand for infant nourishment products in Asia-Pacific has been greatly boosted by rise in purchasing power of the region's people. Moreover, the government has launched programs to raise awareness about baby care. In addition, the expansion of the infant nutrition industry would be further aided by increase in internet advertising for health & nutritional newborn food. Further, companies established in this region are concentrating on launching cutting-edge items depending on local demand.   

Competitive Analysis 

The key players operating in the infant nutrition industry include Abbott, Arla Foods Amba, Campbell Soups, Dana Dairy Group Ltd., Danone, Nestle S.A., Reckitt Benckise (Mead Johnson & Company LLC), Perrigo Company Plc, Heinz Baby, and Gujarat Co-operative Milk Marketing Federation Ltd. (GCMMF). 

Some Examples of Product Launch in the Global Infant Nutrition Market 

  • In July 2022, Danone S.A., launched the new dairy & plants blend baby formula to meet the consumers demands for feeding options that are suitable for vegetarian, flexitarian and plant-based diets, and furthers meet their baby’s specific nutritional requirements. 

  • In November 2021, Abbott Laboratories launched the Similac 360 Total Care, which is infant formula with a blend of five different human milk oligosaccharides. This new formula provides nutrition to support the whole baby’s health and development, including the developing immune system, digestive system and brain. 

  • In November 2020, Abbott Laboratories launched the Similac Pro-Advance with 2'-Fucosyllactose Oligosaccharide, which is its first infant formula in Canada. 

Some Instances of Expansion in the Global Infant Nutrition Market 

  • In February 2022, Arla Foods amba announced to introduce its milk fractionation technology namely, ORIGIN for infant formula manufacturers. 

  • In August 2022, Abbott Laboratories announced to restart its Similac infant formula production at its Sturgis manufacturing plant in Michigan in order to overcome the nationwide infant formula shortage. 

Key Benefits For Stakeholders

  • This report provides a quantitative analysis of the market segments, current trends, estimations, and dynamics of the infant nutrition market analysis from 2022 to 2032 to identify the prevailing infant nutrition market opportunities.
  • The market research is offered along with information related to key drivers, restraints, and opportunities.
  • Porter's five forces analysis highlights the potency of buyers and suppliers to enable stakeholders make profit-oriented business decisions and strengthen their supplier-buyer network.
  • In-depth analysis of the infant nutrition market segmentation assists to determine the prevailing market opportunities.
  • Major countries in each region are mapped according to their revenue contribution to the global market.
  • Market player positioning facilitates benchmarking and provides a clear understanding of the present position of the market players.
  • The report includes the analysis of the regional as well as global infant nutrition market trends, key players, market segments, application areas, and market growth strategies.

Infant Nutrition Market Report Highlights

Aspects Details
Market Size By 2032 USD 95.5 billion
Growth Rate CAGR of 7.7%
Forecast period 2022 - 2032
Report Pages 262
By Distribution Channel
  • E-Commerce
  • Offline channel
    • Sub Type
      • Pharmacy
      • Convenience Stores
      • Hypermarkets/Supermarkets
      • Others
By Product Type
  • Follow-on Milk
  • Specialty baby milk
  • Infant Milk
  • Prepared baby food
  • Dried baby food
By Form
  • Solid baby food
  • Liquid baby food
By Region
  • North America  (U.S., Canada, Mexico)
  • Europe  (Germany, UK, France, Italy, Spain, Switzerland, Rest of Europe)
  • Asia-Pacific  (China, India, Japan, South Korea, Australia, Rest of Asia-Pacific)
  • LAMEA  (Brazil, South Africa, UAE, Rest of LAMEA)
Key Market Players Reckitt Benckiser Group PLC, Gujarat Cooperative Milk Marketing Federation Ltd., Danone S.A., Sun-Maid Growers of California, Inc., Abbott Laboratories, Perrigo Company plc, Nestle S.A., Arla Foods amba, The Kraft Heinz Company, DANA DAIRY GROUP LTD.

Analyst Review

Numerous companies under different brands in the market offer infant foods. R&D activities and innovations for improving the flavors & ingredients of infant nutrition food has helped these companies to increase their overall sale of infant food products in the market. Busy lifestyle of individuals influenced them to use prepared baby food and infant formula. People in the rural and semi-urban areas have steadily started using packaged infant foods, owing to increase visibility due to the proliferation of media & other communication channels. Evolution of online sale of infant food products further increased the overall revenue for the industry.  

The growth of infant food is highly dependent on the awareness among the consumers to provide complete nutrition to their child. Demand for infant foods is higher in the emerging countries, as they are equally growing in terms of disposable income and population.  Acquisition and product launch is the key to sustain in the ever-growing infant nutrition market. 

One of the primary drivers for the increase in demand for infant nutrition is rise in demand for nutritional food across the globe. Many new players are expected to enter the market during the forecast period, attracted by profitable growth and high-profit margins. Consequently, the demand for infant nutrition has seen a multifold increase in the past four years, especially in the developed countries of North America and Europe such as the U.S., Canada, the UK, and Germany.  

 
  • CHAPTER 1: INTRODUCTION

    • 1.1. Report description

    • 1.2. Key market segments

    • 1.3. Key benefits to the stakeholders

    • 1.4. Research Methodology

      • 1.4.1. Primary research

      • 1.4.2. Secondary research

      • 1.4.3. Analyst tools and models

  • CHAPTER 2: EXECUTIVE SUMMARY

    • 2.1. CXO Perspective

  • CHAPTER 3: MARKET OVERVIEW

    • 3.1. Market definition and scope

    • 3.2. Key findings

      • 3.2.1. Top impacting factors

      • 3.2.2. Top investment pockets

    • 3.3. Porter’s five forces analysis

      • 3.3.1. High bargaining power of suppliers

      • 3.3.2. Low threat of new entrants

      • 3.3.3. Moderate threat of substitutes

      • 3.3.4. Moderate intensity of rivalry

      • 3.3.5. Moderate bargaining power of buyers

    • 3.4. Market dynamics

      • 3.4.1. Drivers

        • 3.4.1.1. Increase in awareness on adequate nutrition
        • 3.4.1.2. Increase in awareness on adequate nutrition
        • 3.4.1.3. Consumer busy lifestyle
        • 3.4.1.4. Innovative packaging to influence buying behavior

      • 3.4.2. Restraints

        • 3.4.2.1. Increase in breastfeeding due to government initiatives

      • 3.4.3. Opportunities

        • 3.4.3.1. Organic infant food for more nutritional value
        • 3.4.3.2. Prebiotic and probiotics in infant food to cater to the nutritional demand

    • 3.5. COVID-19 Impact Analysis on the market

  • CHAPTER 4: INFANT NUTRITION MARKET, BY PRODUCT TYPE

    • 4.1. Overview

      • 4.1.1. Market size and forecast

    • 4.2. Follow-on Milk

      • 4.2.1. Key market trends, growth factors and opportunities

      • 4.2.2. Market size and forecast, by region

      • 4.2.3. Market share analysis by country

    • 4.3. Specialty baby milk

      • 4.3.1. Key market trends, growth factors and opportunities

      • 4.3.2. Market size and forecast, by region

      • 4.3.3. Market share analysis by country

    • 4.4. Infant Milk

      • 4.4.1. Key market trends, growth factors and opportunities

      • 4.4.2. Market size and forecast, by region

      • 4.4.3. Market share analysis by country

    • 4.5. Prepared baby food

      • 4.5.1. Key market trends, growth factors and opportunities

      • 4.5.2. Market size and forecast, by region

      • 4.5.3. Market share analysis by country

    • 4.6. Dried baby food

      • 4.6.1. Key market trends, growth factors and opportunities

      • 4.6.2. Market size and forecast, by region

      • 4.6.3. Market share analysis by country

  • CHAPTER 5: INFANT NUTRITION MARKET, BY FORM

    • 5.1. Overview

      • 5.1.1. Market size and forecast

    • 5.2. Solid baby food

      • 5.2.1. Key market trends, growth factors and opportunities

      • 5.2.2. Market size and forecast, by region

      • 5.2.3. Market share analysis by country

    • 5.3. Liquid baby food

      • 5.3.1. Key market trends, growth factors and opportunities

      • 5.3.2. Market size and forecast, by region

      • 5.3.3. Market share analysis by country

  • CHAPTER 6: INFANT NUTRITION MARKET, BY DISTRIBUTION CHANNEL

    • 6.1. Overview

      • 6.1.1. Market size and forecast

    • 6.2. E-Commerce

      • 6.2.1. Key market trends, growth factors and opportunities

      • 6.2.2. Market size and forecast, by region

      • 6.2.3. Market share analysis by country

    • 6.3. Offline channel

      • 6.3.1. Key market trends, growth factors and opportunities

      • 6.3.2. Market size and forecast, by region

      • 6.3.3. Market share analysis by country

      • 6.3.4. Offline channel Infant Nutrition Market by Sub Type

        • 6.3.4.1. Pharmacy Market size and forecast, by region
        • 6.3.4.2. Convenience Stores Market size and forecast, by region
        • 6.3.4.3. Hypermarkets/Supermarkets Market size and forecast, by region
        • 6.3.4.4. Others Market size and forecast, by region
  • CHAPTER 7: INFANT NUTRITION MARKET, BY REGION

    • 7.1. Overview

      • 7.1.1. Market size and forecast By Region

    • 7.2. North America

      • 7.2.1. Key trends and opportunities

      • 7.2.2. Market size and forecast, by Product Type

      • 7.2.3. Market size and forecast, by Form

      • 7.2.4. Market size and forecast, by Distribution Channel

        • 7.2.4.1. North America Offline channel Infant Nutrition Market by Sub Type
      • 7.2.5. Market size and forecast, by country

        • 7.2.5.1. U.S.
          • 7.2.5.1.1. Key market trends, growth factors and opportunities
          • 7.2.5.1.2. Market size and forecast, by Product Type
          • 7.2.5.1.3. Market size and forecast, by Form
          • 7.2.5.1.4. Market size and forecast, by Distribution Channel
        • 7.2.5.2. Canada
          • 7.2.5.2.1. Key market trends, growth factors and opportunities
          • 7.2.5.2.2. Market size and forecast, by Product Type
          • 7.2.5.2.3. Market size and forecast, by Form
          • 7.2.5.2.4. Market size and forecast, by Distribution Channel
        • 7.2.5.3. Mexico
          • 7.2.5.3.1. Key market trends, growth factors and opportunities
          • 7.2.5.3.2. Market size and forecast, by Product Type
          • 7.2.5.3.3. Market size and forecast, by Form
          • 7.2.5.3.4. Market size and forecast, by Distribution Channel
    • 7.3. Europe

      • 7.3.1. Key trends and opportunities

      • 7.3.2. Market size and forecast, by Product Type

      • 7.3.3. Market size and forecast, by Form

      • 7.3.4. Market size and forecast, by Distribution Channel

        • 7.3.4.1. Europe Offline channel Infant Nutrition Market by Sub Type
      • 7.3.5. Market size and forecast, by country

        • 7.3.5.1. Germany
          • 7.3.5.1.1. Key market trends, growth factors and opportunities
          • 7.3.5.1.2. Market size and forecast, by Product Type
          • 7.3.5.1.3. Market size and forecast, by Form
          • 7.3.5.1.4. Market size and forecast, by Distribution Channel
        • 7.3.5.2. UK
          • 7.3.5.2.1. Key market trends, growth factors and opportunities
          • 7.3.5.2.2. Market size and forecast, by Product Type
          • 7.3.5.2.3. Market size and forecast, by Form
          • 7.3.5.2.4. Market size and forecast, by Distribution Channel
        • 7.3.5.3. France
          • 7.3.5.3.1. Key market trends, growth factors and opportunities
          • 7.3.5.3.2. Market size and forecast, by Product Type
          • 7.3.5.3.3. Market size and forecast, by Form
          • 7.3.5.3.4. Market size and forecast, by Distribution Channel
        • 7.3.5.4. Italy
          • 7.3.5.4.1. Key market trends, growth factors and opportunities
          • 7.3.5.4.2. Market size and forecast, by Product Type
          • 7.3.5.4.3. Market size and forecast, by Form
          • 7.3.5.4.4. Market size and forecast, by Distribution Channel
        • 7.3.5.5. Spain
          • 7.3.5.5.1. Key market trends, growth factors and opportunities
          • 7.3.5.5.2. Market size and forecast, by Product Type
          • 7.3.5.5.3. Market size and forecast, by Form
          • 7.3.5.5.4. Market size and forecast, by Distribution Channel
        • 7.3.5.6. Switzerland
          • 7.3.5.6.1. Key market trends, growth factors and opportunities
          • 7.3.5.6.2. Market size and forecast, by Product Type
          • 7.3.5.6.3. Market size and forecast, by Form
          • 7.3.5.6.4. Market size and forecast, by Distribution Channel
        • 7.3.5.7. Rest of Europe
          • 7.3.5.7.1. Key market trends, growth factors and opportunities
          • 7.3.5.7.2. Market size and forecast, by Product Type
          • 7.3.5.7.3. Market size and forecast, by Form
          • 7.3.5.7.4. Market size and forecast, by Distribution Channel
    • 7.4. Asia-Pacific

      • 7.4.1. Key trends and opportunities

      • 7.4.2. Market size and forecast, by Product Type

      • 7.4.3. Market size and forecast, by Form

      • 7.4.4. Market size and forecast, by Distribution Channel

        • 7.4.4.1. Asia-Pacific Offline channel Infant Nutrition Market by Sub Type
      • 7.4.5. Market size and forecast, by country

        • 7.4.5.1. China
          • 7.4.5.1.1. Key market trends, growth factors and opportunities
          • 7.4.5.1.2. Market size and forecast, by Product Type
          • 7.4.5.1.3. Market size and forecast, by Form
          • 7.4.5.1.4. Market size and forecast, by Distribution Channel
        • 7.4.5.2. India
          • 7.4.5.2.1. Key market trends, growth factors and opportunities
          • 7.4.5.2.2. Market size and forecast, by Product Type
          • 7.4.5.2.3. Market size and forecast, by Form
          • 7.4.5.2.4. Market size and forecast, by Distribution Channel
        • 7.4.5.3. Japan
          • 7.4.5.3.1. Key market trends, growth factors and opportunities
          • 7.4.5.3.2. Market size and forecast, by Product Type
          • 7.4.5.3.3. Market size and forecast, by Form
          • 7.4.5.3.4. Market size and forecast, by Distribution Channel
        • 7.4.5.4. South Korea
          • 7.4.5.4.1. Key market trends, growth factors and opportunities
          • 7.4.5.4.2. Market size and forecast, by Product Type
          • 7.4.5.4.3. Market size and forecast, by Form
          • 7.4.5.4.4. Market size and forecast, by Distribution Channel
        • 7.4.5.5. Australia
          • 7.4.5.5.1. Key market trends, growth factors and opportunities
          • 7.4.5.5.2. Market size and forecast, by Product Type
          • 7.4.5.5.3. Market size and forecast, by Form
          • 7.4.5.5.4. Market size and forecast, by Distribution Channel
        • 7.4.5.6. Rest of Asia-Pacific
          • 7.4.5.6.1. Key market trends, growth factors and opportunities
          • 7.4.5.6.2. Market size and forecast, by Product Type
          • 7.4.5.6.3. Market size and forecast, by Form
          • 7.4.5.6.4. Market size and forecast, by Distribution Channel
    • 7.5. LAMEA

      • 7.5.1. Key trends and opportunities

      • 7.5.2. Market size and forecast, by Product Type

      • 7.5.3. Market size and forecast, by Form

      • 7.5.4. Market size and forecast, by Distribution Channel

        • 7.5.4.1. LAMEA Offline channel Infant Nutrition Market by Sub Type
      • 7.5.5. Market size and forecast, by country

        • 7.5.5.1. Brazil
          • 7.5.5.1.1. Key market trends, growth factors and opportunities
          • 7.5.5.1.2. Market size and forecast, by Product Type
          • 7.5.5.1.3. Market size and forecast, by Form
          • 7.5.5.1.4. Market size and forecast, by Distribution Channel
        • 7.5.5.2. South Africa
          • 7.5.5.2.1. Key market trends, growth factors and opportunities
          • 7.5.5.2.2. Market size and forecast, by Product Type
          • 7.5.5.2.3. Market size and forecast, by Form
          • 7.5.5.2.4. Market size and forecast, by Distribution Channel
        • 7.5.5.3. UAE
          • 7.5.5.3.1. Key market trends, growth factors and opportunities
          • 7.5.5.3.2. Market size and forecast, by Product Type
          • 7.5.5.3.3. Market size and forecast, by Form
          • 7.5.5.3.4. Market size and forecast, by Distribution Channel
        • 7.5.5.4. Rest of LAMEA
          • 7.5.5.4.1. Key market trends, growth factors and opportunities
          • 7.5.5.4.2. Market size and forecast, by Product Type
          • 7.5.5.4.3. Market size and forecast, by Form
          • 7.5.5.4.4. Market size and forecast, by Distribution Channel
  • CHAPTER 8: COMPETITIVE LANDSCAPE

    • 8.1. Introduction

    • 8.2. Top winning strategies

    • 8.3. Product Mapping of Top 10 Player

    • 8.4. Competitive Dashboard

    • 8.5. Competitive Heatmap

    • 8.6. Top player positioning, 2022

  • CHAPTER 9: COMPANY PROFILES

    • 9.1. Nestle S.A.

      • 9.1.1. Company overview

      • 9.1.2. Key Executives

      • 9.1.3. Company snapshot

      • 9.1.4. Operating business segments

      • 9.1.5. Product portfolio

      • 9.1.6. Business performance

    • 9.2. Perrigo Company plc

      • 9.2.1. Company overview

      • 9.2.2. Key Executives

      • 9.2.3. Company snapshot

      • 9.2.4. Operating business segments

      • 9.2.5. Product portfolio

      • 9.2.6. Business performance

      • 9.2.7. Key strategic moves and developments

    • 9.3. Abbott Laboratories

      • 9.3.1. Company overview

      • 9.3.2. Key Executives

      • 9.3.3. Company snapshot

      • 9.3.4. Operating business segments

      • 9.3.5. Product portfolio

      • 9.3.6. Business performance

      • 9.3.7. Key strategic moves and developments

    • 9.4. DANA DAIRY GROUP LTD.

      • 9.4.1. Company overview

      • 9.4.2. Key Executives

      • 9.4.3. Company snapshot

      • 9.4.4. Operating business segments

      • 9.4.5. Product portfolio

    • 9.5. Arla Foods amba

      • 9.5.1. Company overview

      • 9.5.2. Key Executives

      • 9.5.3. Company snapshot

      • 9.5.4. Operating business segments

      • 9.5.5. Product portfolio

      • 9.5.6. Business performance

      • 9.5.7. Key strategic moves and developments

    • 9.6. Danone S.A.

      • 9.6.1. Company overview

      • 9.6.2. Key Executives

      • 9.6.3. Company snapshot

      • 9.6.4. Operating business segments

      • 9.6.5. Product portfolio

      • 9.6.6. Business performance

      • 9.6.7. Key strategic moves and developments

    • 9.7. The Kraft Heinz Company

      • 9.7.1. Company overview

      • 9.7.2. Key Executives

      • 9.7.3. Company snapshot

      • 9.7.4. Operating business segments

      • 9.7.5. Product portfolio

      • 9.7.6. Business performance

    • 9.8. Sun-Maid Growers of California, Inc.

      • 9.8.1. Company overview

      • 9.8.2. Key Executives

      • 9.8.3. Company snapshot

      • 9.8.4. Operating business segments

      • 9.8.5. Product portfolio

      • 9.8.6. Key strategic moves and developments

    • 9.9. Gujarat Cooperative Milk Marketing Federation Ltd.

      • 9.9.1. Company overview

      • 9.9.2. Key Executives

      • 9.9.3. Company snapshot

      • 9.9.4. Operating business segments

      • 9.9.5. Product portfolio

      • 9.9.6. Business performance

    • 9.10. Reckitt Benckiser Group PLC

      • 9.10.1. Company overview

      • 9.10.2. Key Executives

      • 9.10.3. Company snapshot

      • 9.10.4. Operating business segments

      • 9.10.5. Product portfolio

      • 9.10.6. Business performance

  • LIST OF TABLES

  • TABLE 01. GLOBAL INFANT NUTRITION MARKET, BY PRODUCT TYPE, 2022-2032 ($MILLION)
    TABLE 02. INFANT NUTRITION MARKET FOR FOLLOW-ON MILK, BY REGION, 2022-2032 ($MILLION)
    TABLE 03. INFANT NUTRITION MARKET FOR SPECIALTY BABY MILK, BY REGION, 2022-2032 ($MILLION)
    TABLE 04. INFANT NUTRITION MARKET FOR INFANT MILK, BY REGION, 2022-2032 ($MILLION)
    TABLE 05. INFANT NUTRITION MARKET FOR PREPARED BABY FOOD, BY REGION, 2022-2032 ($MILLION)
    TABLE 06. INFANT NUTRITION MARKET FOR DRIED BABY FOOD, BY REGION, 2022-2032 ($MILLION)
    TABLE 07. GLOBAL INFANT NUTRITION MARKET, BY FORM, 2022-2032 ($MILLION)
    TABLE 08. INFANT NUTRITION MARKET FOR SOLID BABY FOOD, BY REGION, 2022-2032 ($MILLION)
    TABLE 09. INFANT NUTRITION MARKET FOR LIQUID BABY FOOD, BY REGION, 2022-2032 ($MILLION)
    TABLE 10. GLOBAL INFANT NUTRITION MARKET, BY DISTRIBUTION CHANNEL, 2022-2032 ($MILLION)
    TABLE 11. INFANT NUTRITION MARKET FOR E-COMMERCE, BY REGION, 2022-2032 ($MILLION)
    TABLE 12. INFANT NUTRITION MARKET FOR OFFLINE CHANNEL, BY REGION, 2022-2032 ($MILLION)
    TABLE 13. GLOBAL OFFLINE CHANNEL INFANT NUTRITION MARKET, BY SUB TYPE, 2022-2032 ($MILLION)
    TABLE 14. INFANT NUTRITION MARKET FOR PHARMACY, BY REGION, 2022-2032 ($MILLION)
    TABLE 15. INFANT NUTRITION MARKET FOR CONVENIENCE STORES, BY REGION, 2022-2032 ($MILLION)
    TABLE 16. INFANT NUTRITION MARKET FOR HYPERMARKETS/SUPERMARKETS, BY REGION, 2022-2032 ($MILLION)
    TABLE 17. INFANT NUTRITION MARKET FOR OTHERS, BY REGION, 2022-2032 ($MILLION)
    TABLE 18. INFANT NUTRITION MARKET, BY REGION, 2022-2032 ($MILLION)
    TABLE 19. NORTH AMERICA INFANT NUTRITION MARKET, BY PRODUCT TYPE, 2022-2032 ($MILLION)
    TABLE 20. NORTH AMERICA INFANT NUTRITION MARKET, BY FORM, 2022-2032 ($MILLION)
    TABLE 21. NORTH AMERICA INFANT NUTRITION MARKET, BY DISTRIBUTION CHANNEL, 2022-2032 ($MILLION)
    TABLE 22. NORTH AMERICA OFFLINE CHANNEL INFANT NUTRITION MARKET, BY SUB TYPE, 2022-2032 ($MILLION)
    TABLE 23. NORTH AMERICA INFANT NUTRITION MARKET, BY COUNTRY, 2022-2032 ($MILLION)
    TABLE 24. U.S. INFANT NUTRITION MARKET, BY PRODUCT TYPE, 2022-2032 ($MILLION)
    TABLE 25. U.S. INFANT NUTRITION MARKET, BY FORM, 2022-2032 ($MILLION)
    TABLE 26. U.S. INFANT NUTRITION MARKET, BY DISTRIBUTION CHANNEL, 2022-2032 ($MILLION)
    TABLE 27. CANADA INFANT NUTRITION MARKET, BY PRODUCT TYPE, 2022-2032 ($MILLION)
    TABLE 28. CANADA INFANT NUTRITION MARKET, BY FORM, 2022-2032 ($MILLION)
    TABLE 29. CANADA INFANT NUTRITION MARKET, BY DISTRIBUTION CHANNEL, 2022-2032 ($MILLION)
    TABLE 30. MEXICO INFANT NUTRITION MARKET, BY PRODUCT TYPE, 2022-2032 ($MILLION)
    TABLE 31. MEXICO INFANT NUTRITION MARKET, BY FORM, 2022-2032 ($MILLION)
    TABLE 32. MEXICO INFANT NUTRITION MARKET, BY DISTRIBUTION CHANNEL, 2022-2032 ($MILLION)
    TABLE 33. EUROPE INFANT NUTRITION MARKET, BY PRODUCT TYPE, 2022-2032 ($MILLION)
    TABLE 34. EUROPE INFANT NUTRITION MARKET, BY FORM, 2022-2032 ($MILLION)
    TABLE 35. EUROPE INFANT NUTRITION MARKET, BY DISTRIBUTION CHANNEL, 2022-2032 ($MILLION)
    TABLE 36. EUROPE OFFLINE CHANNEL INFANT NUTRITION MARKET, BY SUB TYPE, 2022-2032 ($MILLION)
    TABLE 37. EUROPE INFANT NUTRITION MARKET, BY COUNTRY, 2022-2032 ($MILLION)
    TABLE 38. GERMANY INFANT NUTRITION MARKET, BY PRODUCT TYPE, 2022-2032 ($MILLION)
    TABLE 39. GERMANY INFANT NUTRITION MARKET, BY FORM, 2022-2032 ($MILLION)
    TABLE 40. GERMANY INFANT NUTRITION MARKET, BY DISTRIBUTION CHANNEL, 2022-2032 ($MILLION)
    TABLE 41. UK INFANT NUTRITION MARKET, BY PRODUCT TYPE, 2022-2032 ($MILLION)
    TABLE 42. UK INFANT NUTRITION MARKET, BY FORM, 2022-2032 ($MILLION)
    TABLE 43. UK INFANT NUTRITION MARKET, BY DISTRIBUTION CHANNEL, 2022-2032 ($MILLION)
    TABLE 44. FRANCE INFANT NUTRITION MARKET, BY PRODUCT TYPE, 2022-2032 ($MILLION)
    TABLE 45. FRANCE INFANT NUTRITION MARKET, BY FORM, 2022-2032 ($MILLION)
    TABLE 46. FRANCE INFANT NUTRITION MARKET, BY DISTRIBUTION CHANNEL, 2022-2032 ($MILLION)
    TABLE 47. ITALY INFANT NUTRITION MARKET, BY PRODUCT TYPE, 2022-2032 ($MILLION)
    TABLE 48. ITALY INFANT NUTRITION MARKET, BY FORM, 2022-2032 ($MILLION)
    TABLE 49. ITALY INFANT NUTRITION MARKET, BY DISTRIBUTION CHANNEL, 2022-2032 ($MILLION)
    TABLE 50. SPAIN INFANT NUTRITION MARKET, BY PRODUCT TYPE, 2022-2032 ($MILLION)
    TABLE 51. SPAIN INFANT NUTRITION MARKET, BY FORM, 2022-2032 ($MILLION)
    TABLE 52. SPAIN INFANT NUTRITION MARKET, BY DISTRIBUTION CHANNEL, 2022-2032 ($MILLION)
    TABLE 53. SWITZERLAND INFANT NUTRITION MARKET, BY PRODUCT TYPE, 2022-2032 ($MILLION)
    TABLE 54. SWITZERLAND INFANT NUTRITION MARKET, BY FORM, 2022-2032 ($MILLION)
    TABLE 55. SWITZERLAND INFANT NUTRITION MARKET, BY DISTRIBUTION CHANNEL, 2022-2032 ($MILLION)
    TABLE 56. REST OF EUROPE INFANT NUTRITION MARKET, BY PRODUCT TYPE, 2022-2032 ($MILLION)
    TABLE 57. REST OF EUROPE INFANT NUTRITION MARKET, BY FORM, 2022-2032 ($MILLION)
    TABLE 58. REST OF EUROPE INFANT NUTRITION MARKET, BY DISTRIBUTION CHANNEL, 2022-2032 ($MILLION)
    TABLE 59. ASIA-PACIFIC INFANT NUTRITION MARKET, BY PRODUCT TYPE, 2022-2032 ($MILLION)
    TABLE 60. ASIA-PACIFIC INFANT NUTRITION MARKET, BY FORM, 2022-2032 ($MILLION)
    TABLE 61. ASIA-PACIFIC INFANT NUTRITION MARKET, BY DISTRIBUTION CHANNEL, 2022-2032 ($MILLION)
    TABLE 62. ASIA-PACIFIC OFFLINE CHANNEL INFANT NUTRITION MARKET, BY SUB TYPE, 2022-2032 ($MILLION)
    TABLE 63. ASIA-PACIFIC INFANT NUTRITION MARKET, BY COUNTRY, 2022-2032 ($MILLION)
    TABLE 64. CHINA INFANT NUTRITION MARKET, BY PRODUCT TYPE, 2022-2032 ($MILLION)
    TABLE 65. CHINA INFANT NUTRITION MARKET, BY FORM, 2022-2032 ($MILLION)
    TABLE 66. CHINA INFANT NUTRITION MARKET, BY DISTRIBUTION CHANNEL, 2022-2032 ($MILLION)
    TABLE 67. INDIA INFANT NUTRITION MARKET, BY PRODUCT TYPE, 2022-2032 ($MILLION)
    TABLE 68. INDIA INFANT NUTRITION MARKET, BY FORM, 2022-2032 ($MILLION)
    TABLE 69. INDIA INFANT NUTRITION MARKET, BY DISTRIBUTION CHANNEL, 2022-2032 ($MILLION)
    TABLE 70. JAPAN INFANT NUTRITION MARKET, BY PRODUCT TYPE, 2022-2032 ($MILLION)
    TABLE 71. JAPAN INFANT NUTRITION MARKET, BY FORM, 2022-2032 ($MILLION)
    TABLE 72. JAPAN INFANT NUTRITION MARKET, BY DISTRIBUTION CHANNEL, 2022-2032 ($MILLION)
    TABLE 73. SOUTH KOREA INFANT NUTRITION MARKET, BY PRODUCT TYPE, 2022-2032 ($MILLION)
    TABLE 74. SOUTH KOREA INFANT NUTRITION MARKET, BY FORM, 2022-2032 ($MILLION)
    TABLE 75. SOUTH KOREA INFANT NUTRITION MARKET, BY DISTRIBUTION CHANNEL, 2022-2032 ($MILLION)
    TABLE 76. AUSTRALIA INFANT NUTRITION MARKET, BY PRODUCT TYPE, 2022-2032 ($MILLION)
    TABLE 77. AUSTRALIA INFANT NUTRITION MARKET, BY FORM, 2022-2032 ($MILLION)
    TABLE 78. AUSTRALIA INFANT NUTRITION MARKET, BY DISTRIBUTION CHANNEL, 2022-2032 ($MILLION)
    TABLE 79. REST OF ASIA-PACIFIC INFANT NUTRITION MARKET, BY PRODUCT TYPE, 2022-2032 ($MILLION)
    TABLE 80. REST OF ASIA-PACIFIC INFANT NUTRITION MARKET, BY FORM, 2022-2032 ($MILLION)
    TABLE 81. REST OF ASIA-PACIFIC INFANT NUTRITION MARKET, BY DISTRIBUTION CHANNEL, 2022-2032 ($MILLION)
    TABLE 82. LAMEA INFANT NUTRITION MARKET, BY PRODUCT TYPE, 2022-2032 ($MILLION)
    TABLE 83. LAMEA INFANT NUTRITION MARKET, BY FORM, 2022-2032 ($MILLION)
    TABLE 84. LAMEA INFANT NUTRITION MARKET, BY DISTRIBUTION CHANNEL, 2022-2032 ($MILLION)
    TABLE 85. LAMEA OFFLINE CHANNEL INFANT NUTRITION MARKET, BY SUB TYPE, 2022-2032 ($MILLION)
    TABLE 86. LAMEA INFANT NUTRITION MARKET, BY COUNTRY, 2022-2032 ($MILLION)
    TABLE 87. BRAZIL INFANT NUTRITION MARKET, BY PRODUCT TYPE, 2022-2032 ($MILLION)
    TABLE 88. BRAZIL INFANT NUTRITION MARKET, BY FORM, 2022-2032 ($MILLION)
    TABLE 89. BRAZIL INFANT NUTRITION MARKET, BY DISTRIBUTION CHANNEL, 2022-2032 ($MILLION)
    TABLE 90. SOUTH AFRICA INFANT NUTRITION MARKET, BY PRODUCT TYPE, 2022-2032 ($MILLION)
    TABLE 91. SOUTH AFRICA INFANT NUTRITION MARKET, BY FORM, 2022-2032 ($MILLION)
    TABLE 92. SOUTH AFRICA INFANT NUTRITION MARKET, BY DISTRIBUTION CHANNEL, 2022-2032 ($MILLION)
    TABLE 93. UAE INFANT NUTRITION MARKET, BY PRODUCT TYPE, 2022-2032 ($MILLION)
    TABLE 94. UAE INFANT NUTRITION MARKET, BY FORM, 2022-2032 ($MILLION)
    TABLE 95. UAE INFANT NUTRITION MARKET, BY DISTRIBUTION CHANNEL, 2022-2032 ($MILLION)
    TABLE 96. REST OF LAMEA INFANT NUTRITION MARKET, BY PRODUCT TYPE, 2022-2032 ($MILLION)
    TABLE 97. REST OF LAMEA INFANT NUTRITION MARKET, BY FORM, 2022-2032 ($MILLION)
    TABLE 98. REST OF LAMEA INFANT NUTRITION MARKET, BY DISTRIBUTION CHANNEL, 2022-2032 ($MILLION)
    TABLE 99. NESTLE S.A.: KEY EXECUTIVES
    TABLE 100. NESTLE S.A.: COMPANY SNAPSHOT
    TABLE 101. NESTLE S.A.: PRODUCT SEGMENTS
    TABLE 102. NESTLE S.A.: PRODUCT PORTFOLIO
    TABLE 103. PERRIGO COMPANY PLC: KEY EXECUTIVES
    TABLE 104. PERRIGO COMPANY PLC: COMPANY SNAPSHOT
    TABLE 105. PERRIGO COMPANY PLC: PRODUCT SEGMENTS
    TABLE 106. PERRIGO COMPANY PLC: PRODUCT PORTFOLIO
    TABLE 107. PERRIGO COMPANY PLC: KEY STRATERGIES
    TABLE 108. ABBOTT LABORATORIES: KEY EXECUTIVES
    TABLE 109. ABBOTT LABORATORIES: COMPANY SNAPSHOT
    TABLE 110. ABBOTT LABORATORIES: PRODUCT SEGMENTS
    TABLE 111. ABBOTT LABORATORIES: PRODUCT PORTFOLIO
    TABLE 112. ABBOTT LABORATORIES: KEY STRATERGIES
    TABLE 113. DANA DAIRY GROUP LTD.: KEY EXECUTIVES
    TABLE 114. DANA DAIRY GROUP LTD.: COMPANY SNAPSHOT
    TABLE 115. DANA DAIRY GROUP LTD.: PRODUCT SEGMENTS
    TABLE 116. DANA DAIRY GROUP LTD.: PRODUCT PORTFOLIO
    TABLE 117. ARLA FOODS AMBA: KEY EXECUTIVES
    TABLE 118. ARLA FOODS AMBA: COMPANY SNAPSHOT
    TABLE 119. ARLA FOODS AMBA: PRODUCT SEGMENTS
    TABLE 120. ARLA FOODS AMBA: PRODUCT PORTFOLIO
    TABLE 121. ARLA FOODS AMBA: KEY STRATERGIES
    TABLE 122. DANONE S.A.: KEY EXECUTIVES
    TABLE 123. DANONE S.A.: COMPANY SNAPSHOT
    TABLE 124. DANONE S.A.: PRODUCT SEGMENTS
    TABLE 125. DANONE S.A.: PRODUCT PORTFOLIO
    TABLE 126. DANONE S.A.: KEY STRATERGIES
    TABLE 127. THE KRAFT HEINZ COMPANY: KEY EXECUTIVES
    TABLE 128. THE KRAFT HEINZ COMPANY: COMPANY SNAPSHOT
    TABLE 129. THE KRAFT HEINZ COMPANY: PRODUCT SEGMENTS
    TABLE 130. THE KRAFT HEINZ COMPANY: PRODUCT PORTFOLIO
    TABLE 131. SUN-MAID GROWERS OF CALIFORNIA, INC.: KEY EXECUTIVES
    TABLE 132. SUN-MAID GROWERS OF CALIFORNIA, INC.: COMPANY SNAPSHOT
    TABLE 133. SUN-MAID GROWERS OF CALIFORNIA, INC.: PRODUCT SEGMENTS
    TABLE 134. SUN-MAID GROWERS OF CALIFORNIA, INC.: PRODUCT PORTFOLIO
    TABLE 135. SUN-MAID GROWERS OF CALIFORNIA, INC.: KEY STRATERGIES
    TABLE 136. GUJARAT COOPERATIVE MILK MARKETING FEDERATION LTD.: KEY EXECUTIVES
    TABLE 137. GUJARAT COOPERATIVE MILK MARKETING FEDERATION LTD.: COMPANY SNAPSHOT
    TABLE 138. GUJARAT COOPERATIVE MILK MARKETING FEDERATION LTD.: PRODUCT SEGMENTS
    TABLE 139. GUJARAT COOPERATIVE MILK MARKETING FEDERATION LTD.: PRODUCT PORTFOLIO
    TABLE 140. RECKITT BENCKISER GROUP PLC: KEY EXECUTIVES
    TABLE 141. RECKITT BENCKISER GROUP PLC: COMPANY SNAPSHOT
    TABLE 142. RECKITT BENCKISER GROUP PLC: PRODUCT SEGMENTS
    TABLE 143. RECKITT BENCKISER GROUP PLC: PRODUCT PORTFOLIO
  • LIST OF FIGURES

  • FIGURE 01. INFANT NUTRITION MARKET, 2022-2032
    FIGURE 02. SEGMENTATION OF INFANT NUTRITION MARKET, 2022-2032
    FIGURE 03. TOP INVESTMENT POCKETS IN INFANT NUTRITION MARKET (2023-2032)
    FIGURE 04. HIGH BARGAINING POWER OF SUPPLIERS
    FIGURE 05. MODERATE BARGAINING POWER OF BUYERS
    FIGURE 06. MODERATE THREAT OF SUBSTITUTES
    FIGURE 07. LOW THREAT OF NEW ENTRANTS
    FIGURE 08. MODERATE INTENSITY OF RIVALRY
    FIGURE 09. DRIVERS, RESTRAINTS AND OPPORTUNITIES: GLOBALINFANT NUTRITION MARKET
    FIGURE 10. INFANT NUTRITION MARKET, BY PRODUCT TYPE, 2022(%)
    FIGURE 11. COMPARATIVE SHARE ANALYSIS OF INFANT NUTRITION MARKET FOR FOLLOW-ON MILK, BY COUNTRY 2022 AND 2032(%)
    FIGURE 12. COMPARATIVE SHARE ANALYSIS OF INFANT NUTRITION MARKET FOR SPECIALTY BABY MILK, BY COUNTRY 2022 AND 2032(%)
    FIGURE 13. COMPARATIVE SHARE ANALYSIS OF INFANT NUTRITION MARKET FOR INFANT MILK, BY COUNTRY 2022 AND 2032(%)
    FIGURE 14. COMPARATIVE SHARE ANALYSIS OF INFANT NUTRITION MARKET FOR PREPARED BABY FOOD, BY COUNTRY 2022 AND 2032(%)
    FIGURE 15. COMPARATIVE SHARE ANALYSIS OF INFANT NUTRITION MARKET FOR DRIED BABY FOOD, BY COUNTRY 2022 AND 2032(%)
    FIGURE 16. INFANT NUTRITION MARKET, BY FORM, 2022(%)
    FIGURE 17. COMPARATIVE SHARE ANALYSIS OF INFANT NUTRITION MARKET FOR SOLID BABY FOOD, BY COUNTRY 2022 AND 2032(%)
    FIGURE 18. COMPARATIVE SHARE ANALYSIS OF INFANT NUTRITION MARKET FOR LIQUID BABY FOOD, BY COUNTRY 2022 AND 2032(%)
    FIGURE 19. INFANT NUTRITION MARKET, BY DISTRIBUTION CHANNEL, 2022(%)
    FIGURE 20. COMPARATIVE SHARE ANALYSIS OF INFANT NUTRITION MARKET FOR E-COMMERCE, BY COUNTRY 2022 AND 2032(%)
    FIGURE 21. COMPARATIVE SHARE ANALYSIS OF INFANT NUTRITION MARKET FOR OFFLINE CHANNEL, BY COUNTRY 2022 AND 2032(%)
    FIGURE 22. INFANT NUTRITION MARKET BY REGION, 2022
    FIGURE 23. U.S. INFANT NUTRITION MARKET, 2022-2032 ($MILLION)
    FIGURE 24. CANADA INFANT NUTRITION MARKET, 2022-2032 ($MILLION)
    FIGURE 25. MEXICO INFANT NUTRITION MARKET, 2022-2032 ($MILLION)
    FIGURE 26. GERMANY INFANT NUTRITION MARKET, 2022-2032 ($MILLION)
    FIGURE 27. UK INFANT NUTRITION MARKET, 2022-2032 ($MILLION)
    FIGURE 28. FRANCE INFANT NUTRITION MARKET, 2022-2032 ($MILLION)
    FIGURE 29. ITALY INFANT NUTRITION MARKET, 2022-2032 ($MILLION)
    FIGURE 30. SPAIN INFANT NUTRITION MARKET, 2022-2032 ($MILLION)
    FIGURE 31. SWITZERLAND INFANT NUTRITION MARKET, 2022-2032 ($MILLION)
    FIGURE 32. REST OF EUROPE INFANT NUTRITION MARKET, 2022-2032 ($MILLION)
    FIGURE 33. CHINA INFANT NUTRITION MARKET, 2022-2032 ($MILLION)
    FIGURE 34. INDIA INFANT NUTRITION MARKET, 2022-2032 ($MILLION)
    FIGURE 35. JAPAN INFANT NUTRITION MARKET, 2022-2032 ($MILLION)
    FIGURE 36. SOUTH KOREA INFANT NUTRITION MARKET, 2022-2032 ($MILLION)
    FIGURE 37. AUSTRALIA INFANT NUTRITION MARKET, 2022-2032 ($MILLION)
    FIGURE 38. REST OF ASIA-PACIFIC INFANT NUTRITION MARKET, 2022-2032 ($MILLION)
    FIGURE 39. BRAZIL INFANT NUTRITION MARKET, 2022-2032 ($MILLION)
    FIGURE 40. SOUTH AFRICA INFANT NUTRITION MARKET, 2022-2032 ($MILLION)
    FIGURE 41. UAE INFANT NUTRITION MARKET, 2022-2032 ($MILLION)
    FIGURE 42. REST OF LAMEA INFANT NUTRITION MARKET, 2022-2032 ($MILLION)
    FIGURE 43. TOP WINNING STRATEGIES, BY YEAR
    FIGURE 44. TOP WINNING STRATEGIES, BY DEVELOPMENT
    FIGURE 45. TOP WINNING STRATEGIES, BY COMPANY
    FIGURE 46. PRODUCT MAPPING OF TOP 10 PLAYERS
    FIGURE 47. COMPETITIVE DASHBOARD
    FIGURE 48. COMPETITIVE HEATMAP: INFANT NUTRITION MARKET
    FIGURE 49. TOP PLAYER POSITIONING, 2022
    FIGURE 50. NESTLE S.A.: RESEARCH & DEVELOPMENT EXPENDITURE, 2020-2022 ($MILLION)
    FIGURE 51. NESTLE S.A.: NET SALES, 2020-2022 ($MILLION)
    FIGURE 52. NESTLE S.A.: REVENUE SHARE BY SEGMENT, 2022 (%)
    FIGURE 53. NESTLE S.A.: REVENUE SHARE BY REGION, 2022 (%)
    FIGURE 54. PERRIGO COMPANY PLC: NET SALES, 2020-2022 ($MILLION)
    FIGURE 55. PERRIGO COMPANY PLC: RESEARCH & DEVELOPMENT EXPENDITURE, 2020-2022 ($MILLION)
    FIGURE 56. PERRIGO COMPANY PLC: REVENUE SHARE BY SEGMENT, 2022 (%)
    FIGURE 57. PERRIGO COMPANY PLC: REVENUE SHARE BY REGION, 2022 (%)
    FIGURE 58. ABBOTT LABORATORIES: NET SALES, 2020-2022 ($MILLION)
    FIGURE 59. ABBOTT LABORATORIES: RESEARCH & DEVELOPMENT EXPENDITURE, 2020-2022 ($MILLION)
    FIGURE 60. ABBOTT LABORATORIES: REVENUE SHARE BY REGION, 2022 (%)
    FIGURE 61. ABBOTT LABORATORIES: REVENUE SHARE BY SEGMENT, 2022 (%)
    FIGURE 62. ARLA FOODS AMBA: NET REVENUE, 2020-2022 ($MILLION)
    FIGURE 63. ARLA FOODS AMBA: RESEARCH & DEVELOPMENT EXPENDITURE, 2020-2022 ($MILLION)
    FIGURE 64. ARLA FOODS AMBA: REVENUE SHARE BY SEGMENT, 2022 (%)
    FIGURE 65. ARLA FOODS AMBA: REVENUE SHARE BY REGION, 2022 (%)
    FIGURE 66. DANONE S.A.: NET SALES, 2020-2022 ($MILLION)
    FIGURE 67. DANONE S.A.: REVENUE SHARE BY SEGMENT, 2021 (%)
    FIGURE 68. THE KRAFT HEINZ COMPANY: NET SALES, 2020-2022 ($MILLION)
    FIGURE 69. THE KRAFT HEINZ COMPANY: RESEARCH & DEVELOPMENT EXPENDITURE, 2020-2022 ($MILLION)
    FIGURE 70. THE KRAFT HEINZ COMPANY: REVENUE SHARE BY SEGMENT, 2022 (%)
    FIGURE 71. THE KRAFT HEINZ COMPANY: REVENUE SHARE BY REGION, 2022 (%)
    FIGURE 72. GUJARAT COOPERATIVE MILK MARKETING FEDERATION LTD.: NET SALES, 2019-2021 ($MILLION)
    FIGURE 73. RECKITT BENCKISER GROUP PLC: NET REVENUE, 2020-2022 ($MILLION)
    FIGURE 74. RECKITT BENCKISER GROUP PLC: REVENUE SHARE BY SEGMENT, 2022 (%)
    FIGURE 75. RECKITT BENCKISER GROUP PLC: REVENUE SHARE BY REGION, 2022 (%)


PURCHASE OPTIONS

Call or Email us

U.S.-Canada Toll-free: +1-800-792-5285
Int'l : +1-503-894-6022
Europe : +44-845-528-1300
Email : help@alliedmarketresearch.com
 
FREQUENTLY ASKED QUESTIONS?

A. The global infant nutrition market size was valued at $45,501.5 million in 2022, and is projected to reach $95,446.5 million by 2032, registering a CAGR of 7.7% from 2022 to 2032.

A. The global infant nutrition market registered a CAGR of 7.7% from 2023 to 2032.

A. Raise the query and paste the link of the specific report and our sales executive will revert with the sample.

A. The forecast period in the infant nutrition market report is from 2023 to 2032.

A. The top companies that hold the market share in the infant nutrition market include Dana Dairy Group Ltd., Danone, Nestle S.A., Reckitt Benckise (Mead Johnson & Company LLC), and Perrigo Company Plc.

A. The infant nutrition market report has 3 segments. The segments are type, form, and distribution channel.

A. The emerging countries in the infant nutrition market are likely to grow at a CAGR of more than 7.0% from 2022 to 2031.

A. Following COVID-19, the production of infant nutrition products suffered initially but it ramped up subsequently. The non-essential items were restricted for transportation in most of the nations. However, consumer spending on infant nutrition is expected to increase as engaged stakeholders in the food industry are introducing new technology in the supply chain in order to provide seamless production to the manufacturers. These technological developments and an increase in the quality of infant nutrition and peripherals in the post-pandemic period will provide ample growth opportunities for the infant nutrition market.

A. Asia-Pacific will dominate the infant nutrition market by the end of 2032.

Looking for Customization?

 Customization Request

Have a Question?

 Speak with Analyst

Any Confusion?

 Inquire Before Buying

Have a glance of the Report

  Request Sample
RELATED TAGS

Purchase Full Report of
Infant Nutrition Market

Start reading instantly.
This Report and over 66,905+ more Reports, Available with Avenue Library. T&C*.

  • Online Only
  • $3,570
  • Online cloud access only
  • Restricted print, copy, paste & download
  • Read only
  • Free industry update
    (Within 180 days)
  • Free report update in next update cycle
    (Jul 2024 - Jul 2025)
  • Data Pack
  • $3,840
  • Restricted to one authorized user
  • One print only
  • Available in
    Excel
  • Free industry update
    (Within 180 days)
  •   Free report update in next update cycle
    (Jul 2024 - Jul 2025)
  • Single User
  • $5,730
  • Restricted to one authorized user
  • One print only
  • Available in
    PDF
  • Free industry update
    (Within 180 days)
  •   Free report update in next update cycle
    (Jul 2024 - Jul 2025)
  • Five Users
  • $6,450
  • Limited to five authorized users
  • Print upto five copies
  • Available in
    PDF
  • Free industry update
    (Within 180 days)
  •   Free report update in next update cycle
    (Jul 2024 - Jul 2025)
  • Enterprise
    License/PDF

  • $9,600
  • Unlimited
    within
    company/enterprise
  • Available in Excel & PDF
  • Free industry update
    (Within 180 days)
  •   Free report update in next update cycle
    (Jul 2024 - Jul 2025)
  • Library
    Membership

  • $999 $ 1,175
    Per User/ Per month/ Billed annually
  • Published Content
    E-access
  • Company Profiles
    E-access
  • Newly Added Content Access
  • 10 PDF
    Downloads
  • 5 Excel Data
    Pack Downloads
  • 250 Company Profiles PDF Downloads
  • Buy Now

*Taxes/Fees, if applicable will be added during checkout. All prices in USD

RELATED REPORTS
 

Why Allied Market Research?


Infallible Methodology

To ensure high-level data integrity, accurate analysis, and impeccable forecasts

Analyst Support

For complete satisfaction

Customization

On-demand customization of scope of the report to exactly meet your needs

TARGETED MARKET VIEW

Targeted market view to provide pertinent information and save time of readers

Get fresh content delivered

Get insights on topics that are crucial for your business. Stay abreast of your interest areas.

Get Industry Data Alerts

Why Allied Market Research?

Infallible Methodology

To ensure high-level data integrity, accurate analysis, and impeccable forecasts

Analyst Support

For complete satisfaction

Customization

On-demand customization of scope of the report to exactly meet your needs

TARGETED MARKET VIEW

Targeted market view to provide pertinent information and save time of readers