Intraoperative Neuromonitoring Market Research, 2032
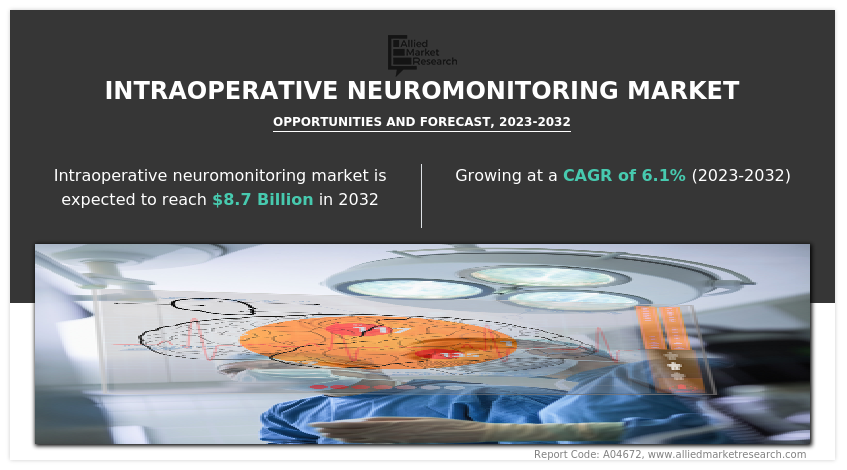
The global intraoperative neuromonitoring market was valued at $4.8 billion in 2022, and is projected to reach $8.7 billion by 2032, growing at a CAGR of 6.1% from 2023 to 2032. The primary driver propelling the growth of the intraoperative neuromonitoring market is the increasing geriatric population and the prevalence of target diseases, including cardiovascular conditions, cancer, and osteoarthritis (OA). As the elderly population grows, so does the incidence of diseases requiring medical imaging for accurate diagnosis and treatment planning. Cardiovascular diseases and cancer, prevalent among the aging demographic, necessitate thorough radiological assessments. Osteoarthritis, a common musculoskeletal ailment affecting predominantly older individuals, further accentuates the demand for medical imaging. Notably, the Osteoarthritis Action Alliance reports that 43% of people with OA are 65 years or older, with 88% being 45 or older. The rise in these demographic-specific health conditions underscores the crucial role of intraoperative neuromonitoring in providing efficient interpretation and analysis, supporting timely interventions and enhancing the overall quality of healthcare.
Key Takeaways
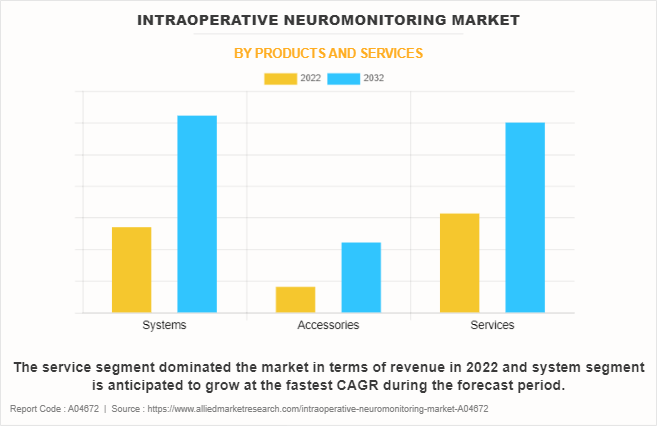
On the basis of products & services, the service segment dominated the intraoperative neuromonitoring market size in terms of revenue in 2022. However, the system segment is anticipated to grow at the fastest CAGR during the forecast period.
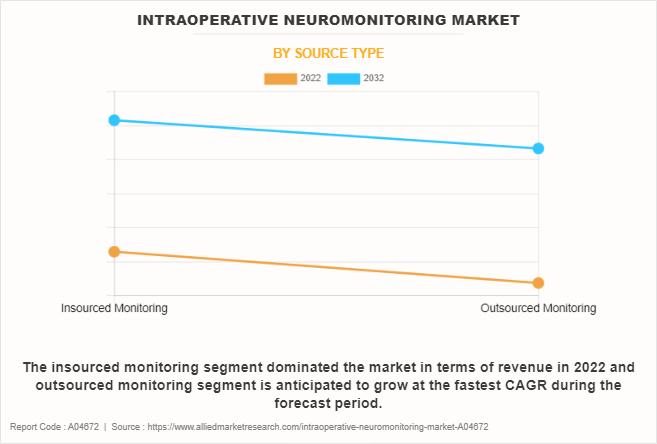
On the basis of source type, the insourced monitoring segment dominated the market in terms of revenue in 2022. However, the outsourced monitoring segment is anticipated to grow at the fastest CAGR during the forecast period.
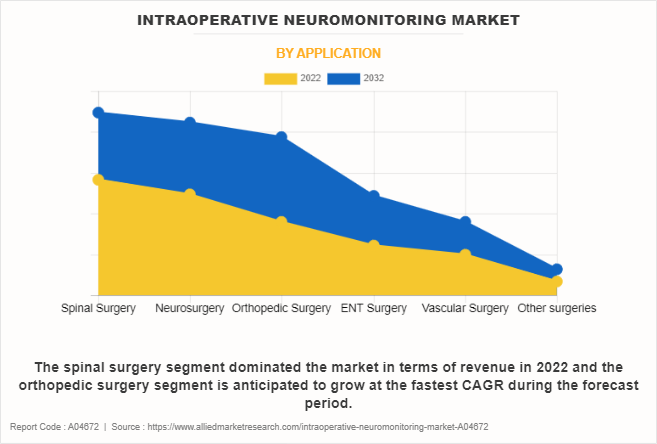
On the basis of application, the spinal surgery segment dominated the market in terms of revenue in 2022. However, the orthopedic surgery segment is anticipated to grow at the fastest CAGR during the forecast period.
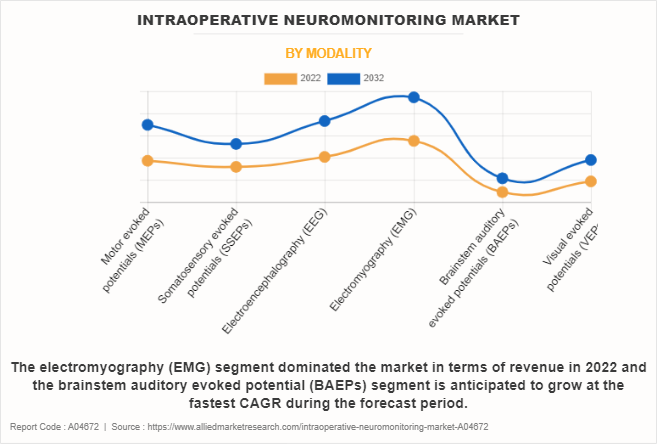
On the basis of modality, the electromyography (EMG) segment dominated the market in terms of revenue in 2022. However, the brainstem auditory evoked potential (BAEPs) segment is anticipated to grow at the fastest CAGR during the forecast period.
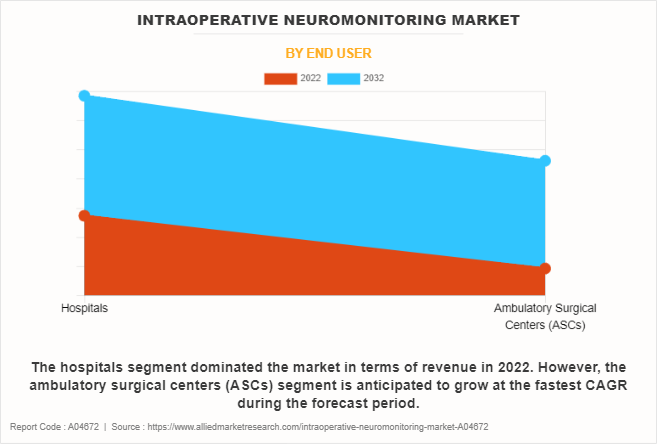
On the basis of end user, the hospitals segment dominated the market in terms of revenue in 2022. However, the ambulatory surgical centers (ASCs) segment is anticipated to grow at the fastest CAGR during the forecast period.
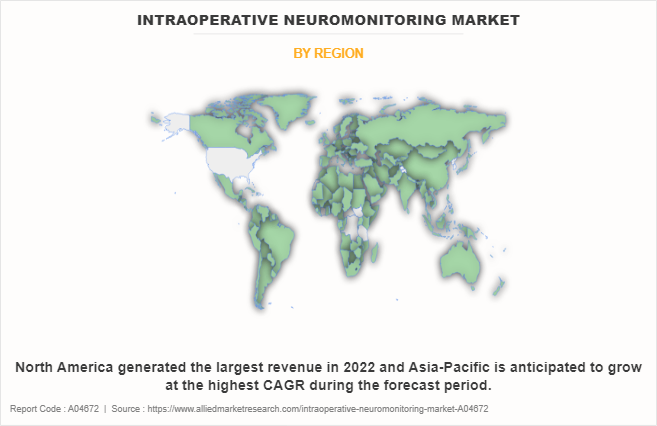
Region wise, North America generated the largest revenue in 2022. However, Asia-Pacific is anticipated to grow at the highest CAGR during the intraoperative neuromonitoring market forecast period.
Intraoperative Neuromonitoring (IONM) is a medical technique used during surgical procedures to monitor the integrity of the nervous system in real-time. It involves the continuous monitoring of neural pathways, such as the spinal cord, brain, and peripheral nerves, using various technologies like electrodes and sensors. IONM provides immediate feedback to surgeons, helping them assess and prevent potential neurological damage during the surgery, thereby enhancing surgical precision and patient safety. This technique is particularly crucial in complex surgeries where delicate neural structures are involved.
Market Dynamics
The market growth of intraoperative neuromonitoring industry is significantly propelled by continuous technological advancements which are serving as a primary driver for market growth. Continuous innovation in monitoring technologies, such as advanced electrodes, real-time data analysis, and improved signal processing, enhances the precision and reliability of IONM. These advancements contribute to safer surgeries by providing surgeons with more accurate and immediate feedback on neural activity. The integration of artificial intelligence and machine learning further augments the capabilities of IONM systems. As healthcare embraces cutting-edge technologies, the demand for state-of-the-art IONM solutions rises, driving market growth and establishing IONM as an indispensable component in modern surgical practices.
However, several factors restrain the growth of the intraoperative neuromonitoring market size . High implementation costs, limited reimbursement policies, and a shortage of skilled professionals pose significant challenges. The initial investment required for IONM technology, coupled with inconsistent reimbursement structures, can impede widespread adoption. The shortage of trained personnel proficient in IONM may hinder seamless integration into surgical practices. Addressing these challenges and enhancing accessibility and affordability will be crucial to unlocking the full potential of IONM and sustaining market growth.
The recession negatively impacts the intraoperative neuromonitoring market opportunity by constraining healthcare budgets and limiting investments. Reduced procedural volumes may hinder IONM utilization. Conversely, the emphasis on cost-effective healthcare solutions during economic challenges could drive IONM adoption, given its preventive role in complications and reduced need for follow-up treatments. The growing focus on remote patient monitoring creates opportunities for IONM companies to innovate scalable solutions. Demonstrating cost-efficiency aligns with evolving healthcare priorities in economic uncertainties. Resilience and growth can be fostered through collaboration, technological advancements, and strategic positioning in the IONM market.
Segmental Overview
The intraoperative neuromonitoring industry is segmented on the basis of products & services, source type, application, modality, end user, and region. On the basis ofproduct & service, the marketis segmented into system, accessory, and service. On the basis of source type, the marketis segmented into insourced monitoring and outsourced monitoring. On the basis of application, the marketis segmented into spinal surgery, neurosurgery, vascular surgery, ENT surgery, orthopedic surgery, and other surgeries.As per modality, the marketis segmented into motor evoked potential (MEPs), somatosensory evoked potential (SSEPs), electroencephalography (EEG), electromyography (EMG), brainstem auditory evoked potential (BAEPs), and visual evoked potential (VEPs).Depending on end user, the market issegmented intohospitals and ambulatory surgical centers (ASCs). Region-wise, the market is analyzed across North America (U.S., Canada, and Mexico), Europe (Germany, France, UK, Italy, Spain, and rest of Europe), Asia-Pacific (China, Japan, India, Australia, South Korea, and rest of Asia-Pacific), and LAMEA (Brazil, Saudi Arabia, South Africa, and rest of LAMEA).
By Product & Service
On the basis of product and service, the intraoperative neuromonitoring market is segmented into system, accessory, and service. The service segment accounted for the largest intraoperative neuromonitoring market share in terms of revenue in 2022 and is expected to maintain its lead during the forecast period owing to the growing acceptance of all-encompassing service packages provided by Intraoperative Neuromonitoring (IONM) providers which is on the rise. These packages not only deploy monitoring technologies but also encompass training programs, ongoing technical support, and real-time monitoring during surgeries. Healthcare institutions are increasingly choosing these comprehensive service solutions to guarantee the smooth and efficient incorporation of IONM, ultimately improving patient safety throughout surgical procedures. However, the system segment is expected to exhibit the fastest CAGR growth during the forecast period owing to continuous progress in technology leading to increased advancements and innovations in Intraoperative Neuromonitoring (IONM) systems. This evolution introduces newer, more sophisticated monitoring systems with enhanced capabilities, improved accuracy, and additional features. As technology evolves, IONM systems become more advanced, providing healthcare professionals with cutting-edge tools to monitor and safeguard the nervous system during surgical procedures.
By Source Type
As per source type, the intraoperative neuromonitoring market is segmented into insourced monitoring and outsourced monitoring. The insourced monitoring segments accounted for the largest intraoperative neuromonitoring market share in terms of revenue in 2022 and is expected to maintain its lead during the forecast period owing to the strategic advantages and cost-effectiveness associated with insourced monitoring. Healthcare facilities are increasingly opting for in-house intraoperative neuromonitoring (IONM) services, driven by the desire for greater control, customization, and direct oversight of monitoring processes. However, the outsourced monitoring segment of intraoperative neuromonitoring hardware & solutions is expected to register the fastest growing CAGR in the forecast period. Outsourced monitoring offers the advantage of accessing specialized expertise without the need for in-house development and management. This approach reduces the burden on healthcare facilities to maintain dedicated personnel and infrastructure, providing a more flexible and cost-effective solution.
By Application
Depending on application, the intraoperative neuromonitoring market is segmented into spinal surgery, neurosurgery, vascular surgery, ENT surgery, orthopedic surgery, and other surgeries. The spinal surgery segments accounted for the largest share in terms of revenue in 2022 and is expected to maintain its lead during the forecast period owing to the increasing prevalence of spinal disorders and a growing number of spinal surgeries globally. However, the orthopedic surgery segment of intraoperative neuromonitoring hardware & solutions is expected to register the fastest growing CAGR in the forecast period. Orthopedic procedures, ranging from joint replacements to complex bone reconstructions, often involve proximity to critical neural structures. The demand for IONM in orthopedic surgery is driven by the need to enhance precision and reduce the risk of neurological complications.
By Modality
On the basis of modality, the intraoperative neuromonitoring market is segmented into motor evoked potential (MEPs), somatosensory evoked potential (SSEPs), electroencephalography (EEG), electromyography (EMG), brainstem auditory evoked potential (BAEPs), and visual evoked potential (VEPs). The electromyography (EMG)segments accounted for the largest share in terms of revenue in 2022 and is expected to maintain its lead during the forecast period owing to the pivotal role of electromyography (EMG) in providing real-time monitoring and assessment of motor nerve function during surgical procedures. In addition, it enables surgeons to assess the integrity of motor nerves, detect abnormalities, and make immediate adjustments to prevent potential neurological damage. However, the brainstem auditory evoked potential (BAEPs) segment of intraoperative neuromonitoring hardware & solutions which is expected to register the fastest growing CAGR in the forecast period. BAEPs are crucial for monitoring the auditory pathways during surgeries, particularly those involving the brainstem.
By End User
According to end user, the intraoperative neuromonitoring market is segmented intohospitals and ambulatory surgical centers (ASCs). The hospitals segment accounted for the largest share in terms of revenue in 2022 and is expected to maintain its lead during the forecast period owing to the vital role of hospitals as primary healthcare institutions, handling a diverse range of surgical procedures, including complex and critical interventions. However, the ambulatory surgical centers (ASCs)segment is expected to exhibit the fastest CAGR growth during the forecast period. There is an increasing prominence of intraoperative neuromonitoring (IONM) in outpatient settings. ASCs are increasingly adopting IONM technologies due to advancements that enable more efficient and cost-effective monitoring during a wide range of surgical procedures.
By Region
Region wise, the intraoperative neuromonitoring market is analyzed across North America, Europe, Asia-Pacific, and LAMEA. North America has the largest share in terms of revenue in 2022 and is expected to maintain its lead during the forecast period owing to growing access to advanced medical technologies and a well-developed network of healthcare facilities. Additionally, the high incidence of chronic conditions and the aging population contribute to the sustained demand for healthcare services. However, Asia-Pacific is expected to exhibit the fastest intraoperative neuromonitoring market growth during the forecast period, owing to an increase in adoption of intraoperative neuromonitoring technologies and high prevalence of chronic diseases. Moreover, the rise in investments and presence of key players in the intraoperative neuromonitoring field majorly drives the growth of the market in Asia-Pacific.
Competition Analysis
Competitive analysis and profiles of the major players in the intraoperative neuromonitoring market that operate in the market, such as NuVasive, Inc., Medtronic plc, Natus Medical Incorporated, inomed Medizintechnik GmbH, Nihon Kohden Corporation, Accurate Monitoring, Computational Diagnostics, Inc., SpecialtyCare, NeuroStyle Pte. Ltd, and Intranerve Neuroscience Holdings, LLC, are provided in the report. The key players have adapted product approval, expansion and acquisition as strategies to enhance their product portfolio.
Recent Product Approval in Intraoperative Neuromonitoring Market
In October 2020, Medtronic plc, the global leader in medical technology, announced that it has received U.S. Food and Drug Administration (FDA) clearance of the NIM Vital nerve monitoring system, which enables physicians to identify, confirm, and monitor nerve function to help reduce the risk of nerve damage during head and neck surgery. `
Recent Acquisition in Intraoperative Neuromonitoring Market
In February 2021, Assure Holdings Corp., a provider of intraoperative neuromonitoring services, announced the acquisition of Sentry Neuromonitoring, LLC, one of the largest IONM service providers in Texas. This acquisition will further strengthen its position in Texas and extend its geographic footprint to Missouri and Kansas.
Key Benefits For Stakeholders
- This report provides a quantitative analysis of the market segments, current trends, estimations, and dynamics of the intraoperative neuromonitoring market analysis from 2022 to 2032 to identify the prevailing intraoperative neuromonitoring market opportunities.
- The market research is offered along with information related to key drivers, restraints, and opportunities.
- Porter's five forces analysis highlights the potency of buyers and suppliers to enable stakeholders make profit-oriented business decisions and strengthen their supplier-buyer network.
- In-depth analysis of the intraoperative neuromonitoring market segmentation assists to determine the prevailing market opportunities.
- Major countries in each region are mapped according to their revenue contribution to the global market.
- Market player positioning facilitates benchmarking and provides a clear understanding of the present position of the market players.
- The report includes the analysis of the regional as well as global intraoperative neuromonitoring market trends, key players, market segments, application areas, and market growth strategies.
Intraoperative Neuromonitoring Market Report Highlights
| Aspects | Details |
| Market Size By 2032 | USD 8.7 billion |
| Growth Rate | CAGR of 6.1% |
| Forecast period | 2022 - 2032 |
| Report Pages | 251 |
| By Products and Services |
|
| By Source Type |
|
| By Application |
|
| By Modality |
|
| By End User |
|
| By Region |
|
| Key Market Players | SpecialtyCare, Computational Diagnostics, Inc., inomed Medizintechnik GmbH, Nihon Kohden Corporation, Intranerve Neuroscience Holdings, LLC, NeuroStyle Pte.Ltd, Medtronic plc, NuVasive, Inc., Accurate Monitoring, Natus Medical Incorporated. |
Analyst Review
There has been a remarkable increase in the use of IONM devices by hospitals and ambulatory surgical centers during complex surgeries. Further rise in geriatric population, increase in prevalence of chronic disorders, and surge in applications of IONM in different surgeries drive the market. In addition, growing focus on risk management is further driving the market growth.
North America has the highest market share in 2022 and is expected to maintain its lead during the forecast period, owing to the availability of improved facilities and rise in adoption of intraoperative neuromonitoring. However, Asia-Pacific is expected to exhibit fastest growth during the forecast period, owing to high population base, rise in chronic diseases, and the surge in healthcare expenditure.
The total market value of intraoperative neuromonitoring market is $4,819.15 million in 2022.
The forecast period for intraoperative neuromonitoring market is 2023 to 2032
The market value of intraoperative neuromonitoring market in 2032 is $8,729.3 million.
The base year is 2022 in intraoperative neuromonitoring market.
Top companies such as NuVasive, Inc., Medtronic plc., Natus Medical Incorporated and Accurate Monitoring. held a high market position in 2022. These key players held a high market postion owing to the strong geographical foothold in North America, Europe, Asia-Pacific, and LAMEA.
The services segment is the most influencing segment in intraoperative neuromonitoring market owing to the increasing adoption of comprehensive service packages offered by intraoperative neuromonitoring (IONM) providers.
The major factor that fuels the growth of the intraoperative neuromonitoring market are rise in prevalence of chronic diseases ,rise in geriatric population and applications of IONM in various surgeries drive the growth of the global intraoperative neuromonitoring market .
Intraoperative neuromonitoring (IONM) is a medical technique employed during surgery to assess and safeguard the integrity of the nervous system in real-time.
Loading Table Of Content...
Loading Research Methodology...


