
Liquid Soap Market Research, 2027
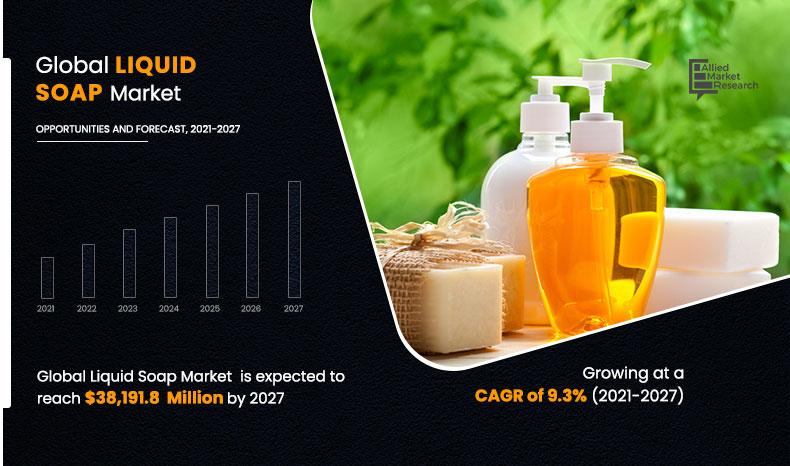
The liquid soap market size was valued at $18,200.00 million in 2019, and is projected to reach $38,191.9 million by 2027, growing at a CAGR of 9.30% from 2021 to 2027. Liquid soap is a type of soap in liquid form generally used in homes, hotels, and restaurants as a form of soap dispensed from a bottle or soap dispenser. Basically, they are used under two categories such as commercial, including restaurants, hotels, institute, and quick service restaurants, and residential. The main reason in growth among these categories is rise in awareness about huge number of benefits associated with healthy and hygienic lifestyle.
In addition, consumers around the globe have become more conscious about cleanliness, which propels growth of the liquid soap market. Rise in number of educational institutions, hospitals, and restaurants also propel growth of the liquid soapmarket. Various initiatives by governments and hospitals toward maintenances of personal hygiene and ease in availability of low-cost products contribute towards the liquid soap market growth.
Increase in number of diseases is expected to provide a lot of opportunities for manufacturers to develop their products for generating significant revenue in the coming years. In addition, rise in demand is generally seen in urban areas as compared to rural areas, which leads to opportunities among manufacturers to develop their products for diversification so that products can reach every segment. Presence of huge varieties in products is one of the growth factors in this market.
Moreover, rise in preference for homemade and handcrafted soaps and ease of manufacturing products at low cost attracts many players to enter the market. One of the major reasons that drive the liquid soap market is rapid urbanization in developing economies and increase in use of luxurious premium organic liquid soaps across the globe.
By Type
Concentional segment dominates the global market and is expected to retain its dominance throughout the forecast period.
However, chemical additives such as Sodium Benzoate,Benzoic Acid, Sodium Laureth Sulfate, Methylisothiazolinone, Methylchloroisothiazolinone, Cocamidopropyl Betaine, fragrance, pH Adjusters, and dyes are used while making soaps. Certain governments in various countries of Europe, the America’s, and Asia-Pacific have put restrictions on use of such considering safety and health of people.
In addition, awareness regarding environment has led propel to prefer bar soaps instead of liquid ones to avoid the use of plastic bottles. Moreover, production in making liquid soap requires five times more raw materials and components than bar soaps and around 20 times more energy for packaging. Hence, all the aforementioned factors are anticipated to restrain growth of the liquid soap market.
By Product Type
Hand wash is expected to grow at a highest CAGR of 9.6% during the forecast period.
For the purpose of the liquid soap market forecast, market is segmented on the basis of type, product type, application, distribution channel, and region. By type, the market is divided into organic and conventional. By product type, it is classified into hand wash, face wash, surface cleaner, and others (beard wash, body wash, and dish wash). By application, it is classified into commercial (restaurants, hotels, institute, quick service restaurants, and others) and residential.
By distribution channel, it is fragmented into specialty stores, supermarkets/hypermarkets, convenience stores, and online sales channel. By region, the market is analyzed across North America, Europe, Asia-Pacific, and LAMEA.
By Application
Residential segment is expected to grow at a highest CAGR of 9.4% during the forecast period.
Some of the observations and analysis that can be made looking at the current and present scenarios related to the Liquid soap market are as follows:
- Awareness among consumer is likely to increase the growth in the market drastically.
- A fast rebound in demand is expected in nearly all countries in liquid soap market.
- All the government bodies in almost every country are focusing on getting their industries back to normal and hence the several efforts as well as guidelines are imposing to prevent the outbreak.
- Manufacturer can develop an effective supply chain response plan to mitigate risk and prepare for any interruptions that the coronavirus outbreak can cause involving supplier engagement response with cross-tier risk transparency, inventory critical part identification, production-capacity optimization, demand management, logistics-capacity pre-booking, and route optimization.
By Distribution Channel
Online sales channel segment is expected to grow at a highest CAGR of 10.0% during the forecast period.
Key players operating in the liquid soap market include Reckitt Benckiser Group plc., Procter & Gamble, Unilever, 3M, Lion Corporation, GOJO Industries Inc., Kao Chemicals, Godrej Consumer Products, Bluemoon Body care, and NEW AVON LLC. Other noticeable players in these markets are Softsoap, Dawn, Dial, Pears, Palmolive, Ivory, Marseillais, Sairo, Fax, My choice, and Lux.
By Region
North America dominates the market in 2019 and is expected to grow with a CAGR of 9.3% during the forecast period
Key Benefits For Stakeholders
The report provides an extensive analysis of the current and emerging liquid soap market trends and liquid soap market opportunities.
The report provides detailed qualitative and quantitative analysis of current trends and future estimations that help evaluate prevailing market opportunities.
A comprehensive analysis of the factors that drive and restrict the growth of the market is provided.
An extensive analysis of the market is conducted by following key product positioning and monitoring the top competitors within the market framework.
The report provides extensive qualitative insights on the potential segments or regions exhibiting favorable growth.
Key Market Segments
By Type
Organic
Conventional
By Product Type
Hand wash
Face wash
Surface Cleaner
Others
Application
Commercial
Residential
By Distribution Channel
Specialty Stores
Supermarkets & Hypermarkets
Convenience stores
Online sales channel
By Region
North America
U.S.
Canada
Mexico
Europe
Germany
UK
France
Italy
Netherland
Switzerland
Rest of Europe
Asia-Pacific
China
India
Japan
Australia
South Korea
Rest of Asia-Pacific
LAMEA
Brazil
South Africa
United Arab Emirates
Rest of the Europe
Liquid Soap Market Report Highlights
| Aspects | Details |
| By TYPE |
|
| By PRODUCT TYPE |
|
| By APPLICATION |
|
| By DISTRIBUTION |
|
| By Region |
|
| Key Market Players | Lion Corporation, Godrej Consumer Products, Kao Corporation, 3M, Unilever Plc, NEW AVON LLC, .Bluemoon Bodycare, GOJO Industries Inc., Reckitt Benckiser Group plc, .PROCTER & GAMBLE |
Analyst Review
The liquid soap market has witnessed a consistent growth in past few years. Increase in number of employed families, growth in awareness about rise in health care expenditure and well-established health care facilities, cleanliness, sanitization, increase in disposable income, and improved online retailing are some of the major factors that supplement the growth of the industry. Currently, North America is the highest revenue-generating region, owing to higher per capita as well as availability of wide range of varieties. The liquid soap market is in its nascent stage in emerging countries, such as India and China. However, it is expected to witness notable growth in Asia-Pacific during the forecast period, owing to improvement in living standards and rise in disposable income among the consumers. Private sector and the government's rapid investment in reducing the risk of infections and to provide safer environment is one of the key trends in this market to boost the demand of liquid soap. Increasing use in Hotel & Restaurants of liquid soap is one of the growth factors as private level liquid soap manufacturing companies develop collaborations with hotel chains to offer their own hotel brands.
The liquid soap market size was valued at $18,200.00 million in 2019, and is projected to reach $38,191.9 million by 2027, growing at a CAGR of 9.30% from 2021 to 2027.
Key players operating in the liquid soap market include Reckitt Benckiser Group plc., Procter & Gamble, Unilever, 3M, Lion Corporation, GOJO Industries Inc., Kao Chemicals, Godrej Consumer Products, Bluemoon Body care, and NEW AVON LLC
Various initiatives by governments and hospitals toward maintenances of personal hygiene and ease in availability of low-cost products contribute towards the liquid soap market growth.
In 2019, North America was the highest revenue-generating market, owing to rise in consumer awareness toward health & hygiene practices and rapid penetration in the market
The liquid soap market is growing at a CAGR of 9.30% from 2021 to 2027.
Loading Table Of Content...

