Loyalty Management Market Insights:
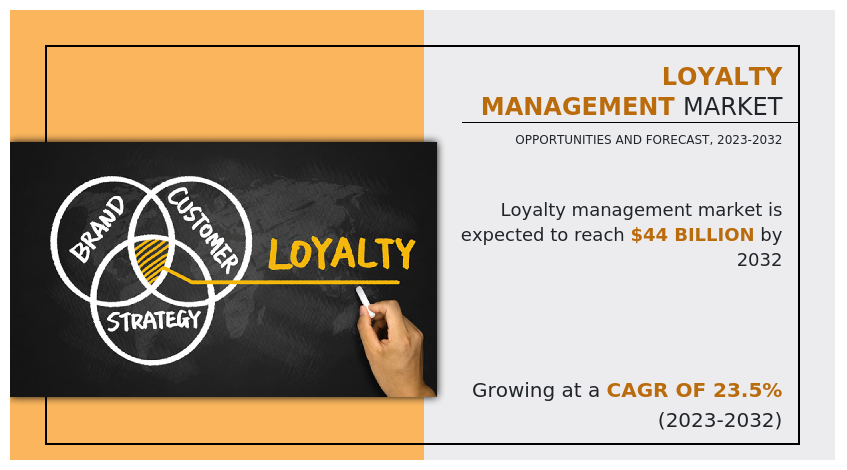
The global loyalty management market size was valued at USD 5.5 billion in 2022 and is projected to reach USD 44 billion by 2032, growing at a CAGR of 23.5% from 2023 to 2032.
Surge in use of mobile applications and recurrent alteration of end-user demographics primarily drives the growth of the loyalty management market. However, lack of awareness about loyalty programs and complexity and strict government regulations hamper the market growth. Moreover, rapidly growing applications of big data and machine learning are expected to provide lucrative opportunities for the market growth during the forecast period.

The market for loyalty management includes a variety of strategies, tools, and systems that companies use to attract, hold, and reward their customers. To obtain insights of behavior, preferences, and purchase habits of customers, loyalty management entails the methodical collecting and analysis of consumer data. Personalized marketing and promotional campaigns, focused offers, and incentive schemes are generated using this data. The main objective is to establish a win-win partnership between companies and their customers, as clients feel appreciated and rewarded for their allegiance, thereby increasing customer satisfaction and brand promotion.
The market for loyalty management has grown significantly in recent years for several reasons. Development of digital technology and e-commerce has simplified the process for companies to launch and maintain loyalty programs across a range of platforms, including social media, mobile apps, and web sites. This has made it possible for companies to interact with clients more personally and broadly and to reach a larger audience. In addition, companies are able to gain a deeper understanding of customer behavior and preferences owing to the growing availability of customer data and data analytics improvements. Businesses may modify their loyalty programs and rewards for specific customers due to this data-driven approach, which improves the overall customer experience and boosts the efficacy of loyalty campaigns.
Furthermore, companies are placing high priority on client loyalty and retention due to rise in competition across all industries. Businesses may get a competitive edge by using loyalty management systems to foster strong customer relationships, stand out from the competition, and increase customer loyalty. In addition, customer relationship management (CRM) systems, customer analytics tools, customer interaction platforms, and loyalty program administration software are among the few solutions available in the loyalty management market. These solutions are made to track customer interactions, manage incentives and rewards, automate and simplify loyalty program operations, and assess the success of loyalty campaigns.
Key Findings:
- By type, the customer retention segment accounted for the loyalty management market share in 2022.
- On the basis of enterprise size, the large enterprise segment generated the highest revenue in 2022.
- On the basis of industry vertical, the retail segment generated the highest revenue in 2022.
- Region-wise, North America generated the highest revenue in 2022.
Segment Review:
The loyalty management market is segmented on the basis of type, enterprise size, industry vertical, and region. On the basis of type, it is divided into customer retention, customer loyalty, and channel loyalty. On the basis of enterprise size, it is divided into large enterprise and small and medium-sized enterprise. On the basis of industry vertical, it is fragmented into BFSI, retail, travel & hospitality, manufacturing, IT & telecom, media & entertainment, healthcare, and others. Region-wise, it is analyzed across North America, Europe, Asia-Pacific, Latin America, and Middle East and Africa.
The report focuses on growth prospects, restraints, and analysis of the loyalty management trend. The study provides Porter’s five forces analysis to understand the impact of numerous factors, such as the bargaining power of suppliers, the competitive intensity of competitors, the threat of new entrants, the threat of substitutes, and the bargaining power of buyers on the loyalty management market share.

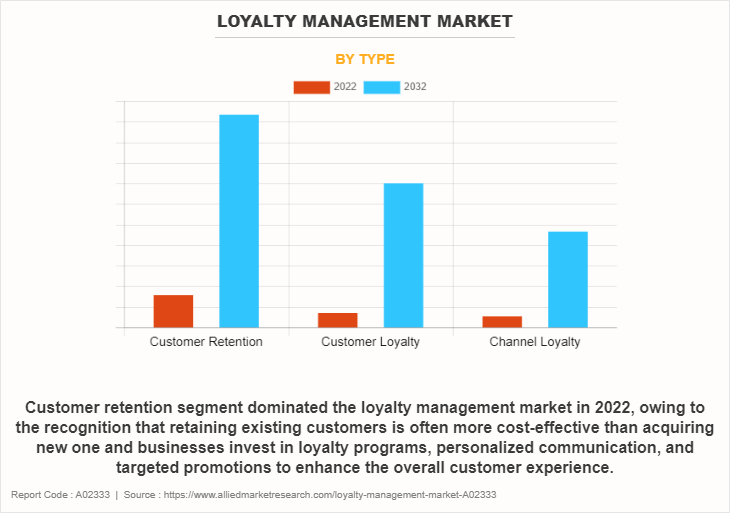
On the basis of type, the customer retention segment dominated the loyalty management market in 2022 and is expected to maintain its dominance in the upcoming years, owing to the recognition that retaining existing customers is often more cost-effective than acquiring new one and businesses invest in loyalty programs, personalized communication, and targeted promotions to enhance the overall customer experience. However, the customer loyalty segment is expected to witness the highest growth, owing to the evolving nature of consumer expectations. As customers increasingly seek personalized and rewarding experiences, businesses are adapting by innovating their loyalty strategies.

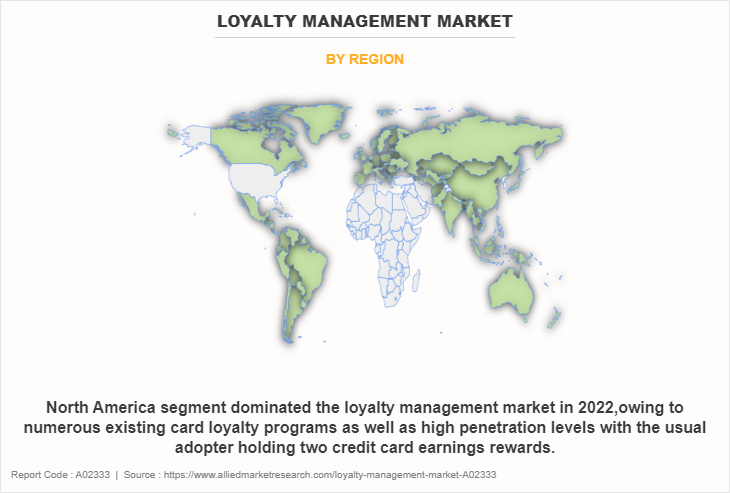
Region-wise, North America dominated the loyalty management market in 2022 and is expected to retain its position during the loyalty management market forecast period, owing to numerous existing card loyalty programs as well as high penetration levels with the usual adopter holding two credit card earnings rewards. However, Asia-Pacific is expected to witness significant growth during the forecast period, owing to increase in adoption of Internet-connected devices, increase in small & medium size startups, and high Internet penetration, which are expected to fuel the loyalty management market growth in the region.
Top Impacting Factors:
Increase in use of mobile applications
Brands are considering mobile applications to create and grow customer loyalty. Schemes or offerings are being launched for various brands exclusively on their mobile applications. For instance, in April 2022, Annex Cloud, a global, enterprise technical solutions provider of advanced loyalty management solutions and experiential customer retention software, partnered with Ometria, a customer data and marketing platform. This partnership combines Ometria’s sophisticated customer intelligence and cross-channel marketing solution with Annex Cloud’s Loyalty Experience Solution to give companies the data, insights, tools, and capabilities they need to deliver the individualized experiences as expected by consumers while building loyalty and driving growth without discounting.
Frequent Modification of end-user demographics
The changing end-user demographics have influenced loyalty management market vigorously. C Consumers are prioritizing worthy experiences, that is, value for money, instead of financial assets. This changing shift of expectations has urged loyalty marketers to develop innovative loyalty programs by utilizing numerous marketing practices. Such frequent modification of end-user demographics allows vendors to capture diverse market potential through novel loyalty programs.
Competition Analysis:
The key players operating in the loyalty management industry include Annex Cloud, Apex Loyalty, Bond Brand Loyalty, Brierley+Partners, Capillary Technologies, Cheetah Digital, Comarch, Epsilon, Fivestars, and Oracle. Furthermore, it highlights the strategies of the key players to improve the loyalty management market share and sustain competition in loyalty management industry.
Recent Partnership in the Market:
In October 2023, Ansira Partners, Inc., an independent global marketing services and solutions company with proprietary channel, website, and advertising technology, partnered with Annex Cloud, a technology platform that transforms customer loyalty experiences for global enterprises. Collaboration between the two companies is expected to result in greater loyalty offerings for clients from enhanced tracking, rewarding, and profiling, to strategy and analytics, as well as a robust loyalty solution for the largely untapped automotive dealer sector.
In April 2022, Annex Cloud, a global, enterprise technical solutions provider of advanced loyalty management solutions and experiential customer retention software partnered with Ometria, a customer data and marketing platform. This partnership combines Ometria’s sophisticated customer intelligence and cross-channel marketing solution with Annex Cloud’s Loyalty Experience Solution to give companies the data, insights, tools, and capabilities they need to deliver the individualized experiences today’s consumers expect while building loyalty and driving growth without discounting.
In November 2023, Annex Cloud, a global, enterprise technical solutions provider of advanced loyalty management solutions and experiential customer retention software, partnered with Redpoint Global, a loyalty management market leader in customer engagement and data management solutions. This partnership combines Redpoint Global’s rgOne™ solution with Annex Cloud’s Loyalty Experience Solution to give companies all the data, insights, tools, and capabilities they need to adapt to evolving consumer expectations in real time and drive growth without discounting.
Key Benefits for Stakeholders:
- This report provides a quantitative analysis of the loyalty management market size, segments, current trends, estimations, and dynamics of the loyalty management market analysis from 2022 to 2032 to identify the prevailing loyalty management market opportunities.
- The loyalty management market research is offered along with information related to key drivers, restraints, and opportunities.
- Porter's five forces analysis highlights the potency of buyers and suppliers to enable stakeholders make profit-oriented business decisions and strengthen their supplier-buyer network.
- In-depth analysis of the loyalty management market segmentation assists to determine the prevailing market opportunities.
- Major countries in each region are mapped according to their revenue contribution to the global market.
- Market player positioning facilitates benchmarking and provides a clear understanding of the present position of the market players.
- The report includes the analysis of the regional as well as global loyalty management market trends, key players, market segments, application areas, and market growth strategies.
Loyalty Management Market Report Highlights
| Aspects | Details |
| Market Size By 2032 | USD 44 billion |
| Growth Rate | CAGR of 23.5% |
| Forecast period | 2022 - 2032 |
| Report Pages | 324 |
| By Type |
|
| By Enterprise Size |
|
| By Industry Vertical |
|
| By Region |
|
| Key Market Players | Brierley+Partners, Capillary Technologies, Comarch SA, Apex Loyalty, Oracle Corporation, Epsilon Data Management, LLC., Annex Cloud, IBM, Bond Brand Loyalty Inc., SAP SE |
Analyst Review
The global loyalty management systems are an integral part of loyalty programs. Their ability to analyze the data and operate to cater to the needs of a customer have allowed it to become one of the most popular industries globally. Customer loyalty has become a popular phenomenon among businesses as retaining a customer cost less and offers cost-free publicity. The market for loyalty management is analyzed across three major segments including customer retention, customer loyalty, and channel loyalty. Channel loyalty is an emerging concept, which exclusively focuses on the improved relationship between a business and its channel partners. Maintaining a harmonized environment between a company and its channel partner through various reward programs and incentives is expected to benefit a company.
Loyalty programs are gaining strong momentum globally, especially in Asia-Pacific and Africa countries. Large population using Internet for online shopping, rise in smartphone usage, changing customer dynamics, and high investments from the vendors positively impact the growth of the loyalty management market. A customer is willing to return to the same brand, which offers a satisfactory experience for both, product and associated services. In addition, a card membership creates a convenient ambience for the customer to return to the same brand to get same benefits with additional rewards. This demands an efficient analytics and management system to be installed to easily handle the customer data and maintain a proper database.
For instance, In March 2023, KDDI Corporation, one of Japan's top three carriers and the operator of the “au” mobile phone service, collaborated with Oracle Database to modernize its online payment brand, au PAY, and customer loyalty program, au Ponta Points Program. By working with Oracle, au Pay payment processing became five times faster than before, while au Ponta Points Program’s processing performance improved by 200%. In addition, Oracle helps KDDI to meet changing customer needs by enabling it to develop new services and applications.
The global loyalty management market size was valued at USD 5.5 billion in 2022 and is projected to reach USD 44 billion by 2032
The global loyalty management market is expected to grow at a compound annual growth rate of 23.5% from 2023 to 2032 to reach USD 44 billion by 2032
Some of the key players in the global loyalty management market include Comarch SA, Capillary Technologies, Epsilon Data Management, LLC., SAP SE, Brierley+Partners, IBM, Apex Loyalty, Bond Brand Loyalty Inc., Oracle Corporation, Annex Cloud
North America is the largest regional market for loyalty management.
Surge in use of mobile applications and recurrent alteration of end-user demographics primarily drives the growth of the loyalty management market.
Loading Table Of Content...
Loading Research Methodology...


