
Managed Learning Service Market Overview
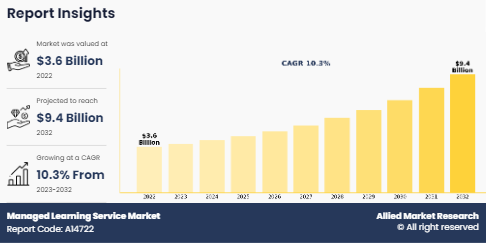
The global managed learning service market was valued at USD 3.6 billion in 2022, and is projected to reach USD 9.4 billion by 2032, growing at a CAGR of 10.3% from 2023 to 2032.
Managed learning service (MLS) offers companies outsourced end-to-end training solutions, enabling them to effectively manage their training requirements. It includes training outsourcing, learning outsourcing, training BPO, and learning BPO. By leveraging MLS, companies streamline their training processes, reduce administrative burden, access expertise, and stay aligned with industry best practices. Furthermore, it helps to improve cost savings, scalability, and enhance learning outcomes & the ability to focus internal resources on core business activities. Hence, it enables organizations to create efficient, effective, and adaptable learning ecosystems to support employee growth and organizational success.
Factors such as the increased demand for personalized learning experiences and growth of digital learning platforms and tools positively impact the expansion of the market. In addition, integration of AI & machine learning for adaptive learning solutions and rise in demand for cost-effectiveness of outsourcing learning management solution strengthen the growth of the market for future. Furthermore, expansion of emerging markets with surge in education demands and rise in specialized learning solutions for niche industries are expected to provide lucrative opportunities for market growth. In addition, increase in customization options to cater to diverse learner needs and rise in integration with HR systems for seamless talent development are anticipated to create numerous opportunities for the managed learning service market growth in the coming years. However, data privacy & security concerns and resistance to change traditional learning methods hamper the growth of the market.
Key Takeaways:
- Depending on type, the sourcing external training segment accounted for the largest market share in 2022.
- Based on enterprise size, the large enterprises segment accounted for the largest market share in 2022.
- Based on delivery mode, the instructor-led training segment accounted for the largest market share in 2022.
- By industry vertical, the telecommunications and IT segment accounted for the largest managed learning service market share in 2022.
- Region wise, North America generated the highest revenue in 2022.
Top Impacting Factors
Increased adoption of e-learning and digital learning platforms
The trend of increased adoption of e-learning and digital learning platforms represents a significant shift in the way organizations approach training and development, consequently impacting the managed learning service (MLS) market. With the proliferation of digital technologies and the rise of remote work arrangements, there has been a surge in demand for flexible, accessible, and scalable learning solutions. E-learning platforms offer advantages such as anytime, anywhere access to training materials, self-paced learning modules, and interactive multimedia content, catering to the diverse learning preferences of modern learners. Managed learning service providers leverage this trend by offering comprehensive e-learning solutions tailored to the specific needs of their clients. They facilitate the selection, implementation, and management of e-learning platforms, as well as the development of custom content and learning pathways.
In addition, MLS providers have integrated advanced features such as gamification, virtual classrooms, and AI-driven adaptive learning algorithms to enhance engagement and effectiveness. This trend enables organizations to overcome traditional training barriers such as geographical constraints & scheduling conflicts and empowers them to achieve greater efficiency, cost-effectiveness, & learner satisfaction in their training initiatives. As a result, MLS providers are strategically positioning themselves to capitalize on the growing demand for e-learning solutions and play a pivotal role in driving innovation & transformation in the learning and development landscape.
Integration of artificial intelligence (AI) and machine learning (ML) in learning analytics
The integration of artificial intelligence (AI) and machine learning (ML) in learning analytics presents significant opportunities for the managed learning service industry. By leveraging AI and ML technologies, MLS providers enhance the effectiveness, efficiency, and personalization of learning experiences for individuals and organizations. These technologies enable the analysis of vast amounts of learner data to identify patterns, preferences, and learning gaps, allowing MLS providers to tailor training programs to meet specific needs. AI-powered recommendation engines suggest relevant courses and resources based on individual learner profiles and performance metrics, creating a more engaging and targeted learning journey.
In addition, ML algorithms predict future learning trends, anticipate skill demands, and optimize course content & delivery methods in real-time. By harnessing the power of AI and ML in learning analytics, managed learning service industries drive innovation, improve learning outcomes, and stay ahead in an increasingly competitive and dynamic market landscape.
Segment Review
The global managed learning service market is segmented into type, enterprise size, delivery mode, industry vertical, and region. By type, the market is classified into sourcing external training, L&D administration, supplier management, and others. By enterprise size, it is bifurcated into small & medium enterprises and large enterprises. Depending on delivery mode, it is fragmented into distance learning, instructor-led training, and blended learning. By industry vertical, the market is categorized into BFSI, consumer goods & retail, telecommunication & IT, healthcare, education, and others. Region wise, it analyzed across North America, Europe, Asia-Pacific, and LAMEA.

By enterprise size, the global managed learning service market size was dominated by the large enterprises in 2022 and is expected to maintain its dominance in the upcoming years, owing to technological advancements in online platform and integration of managed learning service with AI to transform learning solution. However, the small and medium enterprises segment is expected to witness the highest growth in the coming years due to rise in digitalization and internet penetration across the globe.

By region, North America dominated the managed learning service market size in 2022. The increase in investments in advanced technologies such as AI and cloud services to improve businesses and customer experiences is expected to drive growth in the market in this region. However, Asia-Pacific is expected to exhibit the highest growth during the forecast period. This is attributed to an increase in penetration of digitalization and higher adoption of connected technology.
Competition Analysis
The key players operating in the managed learning service industry are TTA (The Training Associates), Wahoo Learning, G-Cube, GP Strategies Corporation, Infopro Learning, Inc., NIIT (USA), Inc., Schouten Global, Capita Plc., Learning Tree International, Inc., Hemsley Fraser Group Ltd., TTEC Holdings, Inc., and QA. These major players have adopted various key development strategies such as business expansion, new product launches, and partnerships, which help to drive the growth of the managed learning service market globally. For instance, in August 2023, TTEC Holdings, Inc. launched a new offering to help organizations more easily consume Amazon Web Services (AWS) AI and machine learning (ML) capabilities. This offering, TTEC Digital Contact Center Intelligence powered by AWS, enables customers to add AI capabilities to their existing contact center infrastructure without technology replacements or major infrastructure upgrades.
Key Developments in the Managed Learning Service Industry:
In March 2024, GP Strategies launched an AI training program, Human+AI: Practical AI for learning leaders, which equips learning leaders with the knowledge and skills to leverage AI effectively within their organization, learning and development (L&D) function, and work.
In March 2024, QA partnered with the Association of Apprentices (AoA), aimed to empowering businesses to cultivate and nurture learning communities for their apprentices. Learners on a QA apprenticeship program is expected to become part of a vibrant learning community, benefiting from shared knowledge, experience, and networking.
In February 2024, Global learning, and talent development provider Hemsley Fraser created a unique new management & leadership program that helps leaders and managers develop the top capabilities needed for success in today fast-changing and unpredictable work environments.
Key Benefits for Stakeholders:
This report provides a quantitative analysis of the market segments, current trends, estimations, and dynamics of the managed learning service market analysis from 2022 to 2032 to identify the prevailing managed learning service market opportunities.
The market research is offered along with information related to key drivers, restraints, and opportunities.
Porter's five forces analysis highlights the potency of buyers and suppliers to enable stakeholders make profit-oriented business decisions and strengthen their supplier-buyer network.
In-depth analysis of the market segmentation assists to determine the prevailing market opportunities.
Major countries in each region are mapped according to their revenue contribution to the global managed learning service market forecast.
Market player positioning facilitates benchmarking and provides a clear understanding of the present position of the market players.
The report includes the analysis of the regional as well as global managed learning service market trends, key players, market segments, application areas, and market growth strategies.
Managed Learning Service Market Report Highlights
| Aspects | Details |
| Market Size By 2032 | USD 9.4 billion |
| Growth Rate | CAGR of 10.3% |
| Forecast period | 2022 - 2032 |
| Report Pages | 93 |
| By Type |
|
| By Industry Vertical |
|
| By Enterprise Size |
|
| By Delivery Mode |
|
| By Region |
|
| Key Market Players | GP Strategies Corporation, TTA (The Training Associates), Hemsley Fraser Group Ltd., TTEC Holdings, Inc., NIIT (USA), Inc., QA, G-Cube, Relevance Learning (Schouten Global), Wahoo Learning, Capita plc., Infopro Learning, Inc., Learning Tree International, Inc. |
Analyst Review
The managed learning service industry represents a pivotal tool for organizational growth and sustainability in today's fast-paced business landscape. As technology continues to evolve and disrupt traditional business models, the need for continuous learning and upskilling has become more vital than ever. Managed learning services offer a comprehensive solution that addresses the immediate training needs of employees and aligns with broader strategic objectives. From a cost-efficiency standpoint, outsourcing learning services result in significant savings compared to in-house development and maintenance of training programs. This is particularly relevant considering the rapid obsolescence of skills and knowledge in many industries, necessitating frequent updates and revisions to training materials. Furthermore, by acquiring & partnering with a managed learning service provider, an organization ensures that its workforce remains agile and adaptable to changing market dynamics without overburdening internal resources. For instance, in April 2024, Accenture acquired Axis Corporate, a Spanish management and technology business consulting firm specialized in financial services. Through this, Axis Corporate is expected to enhance Accenture’s strategy and technology offerings that enable companies in Spain to reinvent their business models, more effectively manage costs, and develop new products faster.
Moreover, managed learning services offer scalability and flexibility, allowing organizations to tailor training programs to their specific needs and objectives. This is crucial in today's diverse and geographically dispersed workforce, where traditional one-size-fits-all approaches to training are no longer enough. By leveraging the expertise and resources of external learning service providers, organizations design personalized learning experiences that cater to the unique requirements of different departments, teams, and individuals. In addition, managed learning services enable businesses to stay ahead in terms of emerging trends and technologies. With the rapid pace of innovation in fields such as artificial intelligence (AI), data analytics, and cybersecurity, keeping employees ahead of the latest developments is essential for maintaining a competitive edge. Furthermore, managed learning services play a crucial role in fostering a culture of continuous learning and professional development within the organization. By providing employees with access to a diverse range of learning opportunities, from traditional classroom-based training to online courses and virtual simulations, organizations empower their workforce to take ownership of their career growth and advancement. This enhances employee engagement & satisfaction and contributes to higher levels of productivity & performance across the organization. Such factors are anticipated to create notable opportunities for the managed learning service market expansion during the forecast period.
Managed Learning Service Market is expected to reach 9.36 billion by 2032.
The Managed Learning Service market is projected to grow at a compound annual growth rate of 10.3% from 2023-2032 reach 9.36 billion by 2032
The key players operating in the market include as TTA (The Training Associates), Wahoo Learning, G-Cube, GP Strategies Corporation, Infopro Learning, Inc., NIIT (USA), Inc., Schouten Global, Capita Plc., Learning Tree International, Inc., Hemsley Fraser Group Ltd., TTEC, and QA.
The North America is the largest market for the Managed Learning Service.
Factors such as the increased demand for personalized learning experiences and growth of digital learning platforms and tools positively impacts the expansion of the market
Loading Table Of Content...
Loading Research Methodology...

