
Natural Food Colors Market Summary
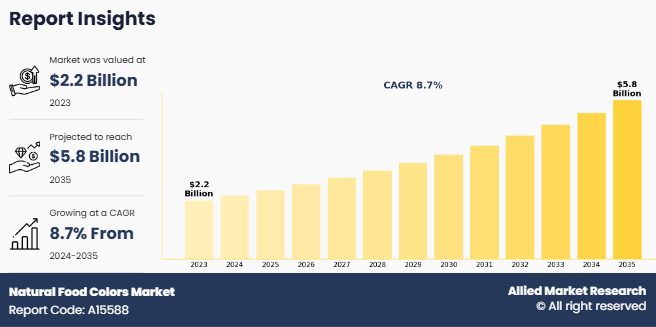
The global natural food colors market size was valued at $2.2 billion in 2023, and is projected to reach $5.8 billion by 2035, growing at a CAGR of 8.7% from 2024 to 2035
Key Market Trends and Insights
Region wise, Europe generated the highest revenue in 2023.
The global natural food colors market share was dominated by the powder segment in 2023 and is expected to maintain its dominance in the upcoming years
The processed food products and beverages segment is expected to witness the highest growth during the forecast
Market Size & Forecast
- 2023 Market Size: USD 2.2 Billion
- 2035 Projected Market Size: USD 5.8 Billion
- Compound Annual Growth Rate (CAGR) (2024-2035): 8.7%
- Europe: Generated the highest revenue in 2023
Market Dynamics
Natural food colors are colorants derived from natural sources, such as fruits, vegetables, herbs, animal, and others. These colors are extracted using various methods such as solvent extraction, water extraction, distillation, or others. Unlike artificial food colors, which are chemically synthesized and can have negative health effects, natural food colors are considered safe and healthy for human consumption. They are majorly used in the food industry to enhance the appearance of food products, such as processed food products and beverages, without compromising their safety or nutritional value.
The rise of clean-label and organic products is significantly driving demand in the natural food colors market, as consumers increasingly seek transparency and trust in what they consume. Consumers are no longer just checking calorie counts as they are reading ingredient labels, avoiding synthetic dyes, and opting for products with recognizable, plant-based components. According to the International Food Information Council (IFIC), over 60% of consumers report that they actively avoid artificial colors, and terms like natural and organic heavily influence their purchase decisions. This shift is reshaping product development strategies across the food and beverage industry. Natural colorants derived from sources like turmeric, beetroot, spirulina, and annatto not only meet this demand but also align with growing preferences for vegan and sustainable products. Moreover, food manufacturers are leveraging this trend by reformulating existing products and launching new SKUs with clean-label credentials, especially in categories like beverages, snacks, dairy, and plant-based meat. As consumers increasingly equate natural with health and authenticity, clean-label trends will continue to serve as a strong catalyst for the growth of natural food colors.
However, the higher costs associated with natural food colors are a significant barrier to widespread adoption, especially among small and mid-sized food manufacturers. Unlike synthetic dyes, which are mass-produced from petrochemical sources at low cost, natural colorants are derived from fruits, vegetables, algae, or spices materials that can be seasonal, perishable, and require more intensive processing. This translates to higher raw material and extraction costs. For instance, extracting a stable blue hue from spirulina or red from beetroot involves complex processing to ensure color consistency, shelf stability, and resistance to heat or pH changes all of which add to production costs. Additionally, yields from natural sources can be low, and supply can fluctuate due to agricultural or climate-related factors, further driving up prices. This cost differential poses a challenge for food producers operating in price-sensitive markets, where margins are tight and consumer willingness to pay a premium may be limited. Moreover, synthetic colors often outperform natural ones in vibrancy and shelf life, making the cost-to-benefit ratio a critical consideration for manufacturers.
Further, innovation in extraction and stabilization technologies is creating exciting opportunities in the natural food color market by addressing long-standing challenges such as color fading, instability under heat, and limited pH tolerance. Traditionally, many natural pigments like anthocyanins or chlorophyll lose vibrancy when exposed to light, oxygen, or heat, making them less appealing for commercial food processing. However, new techniques like microencapsulation, cold-press extraction, and use of natural stabilizers such as maltodextrin and gums are significantly improving color retention and solubility. For instance, researchers are now developing water-soluble curcumin and heat-stable beet pigments, allowing wider use in beverages, dairy, and baked goods without compromising shelf life or appearance. These innovations not only improve functional performance but also reduce food waste and production inefficiencies. Additionally, advancements in fermentation and precision extraction from microbial or algal sources are expanding the palette of available natural colors like stable blues from spirulina or purples from purple corn for natural food colors market forecast. As food companies seek reliable and sustainable alternatives to synthetic dyes, these technological breakthroughs offer a practical bridge between consumer expectations and industrial requirements. Ultimately, such innovations are making natural food colors more versatile, cost-effective, and accessible across a broader range of food and beverage applications, unlocking market growth.
Segment Review
The natural food colors market is segmented into solubility, application, color type, source, form and region. By solubility, the market is categorized by water and dye. On the basis of application, the market is divided into processed food products and beverages. Based on color type, the market is categorized into caramel, carotenoids, anthocyanins, curcumin, carmine, annatto, and chlorophyll & spirulina. By source, The market is bifurcated into plants and animals. On the basis of form, liquid and powder are covered in the report.. By region, the market is analyzed across North America (the U.S., Canada and Mexico) Europe (Germany, France, UK, Spain, Italy, Russia, and Rest of Europe) Asia-Pacific (China, India, Japan, South Korea, Australia and Rest of Asia-Pacific) South America (Brazil, Argentina, Chile, and Rest of South America) Middle East (Saudi Arabia, UAE, Egypt, Bahrain, and Rest of Middle East) and Africa (South Africa, Kenya, Zimbabwe, Sudan and Rest of Africa.)
By Solubility

By Solubility, the water segment dominated the natural food colors industry in 2023 and is anticipated to maintain its dominance during theforecast period. The growth of the water segment is driven by its widespread use in beverages and other water-based food products, which form a large part of the processed food industry. Additionally, water-soluble natural colors offer better dispersion, ease of formulation, and align well with clean-label trends, making them highly preferred by manufacturers.
By Application

By Application, the processed food products and beverages segment dominated the market in 2023 and is anticipated to maintain its dominance during the forecast period. The market size of the processed food products and beverages segment is driven by increasing consumer demand for visually appealing, clean-label, and health-oriented food options. Additionally, the widespread use of natural colors in snacks, bakery, dairy, confectionery, and soft drinks supports the segment's continued expansion of market share.
By Color Type

By Color type, the carotenoids segment dominated the market in 2023 and is anticipated to maintain its dominance during the forecast period. The natural food colors market demand of the carotenoids segment is driven by their wide color spectrum (yellow to red), high stability, and extensive use in dairy, bakery, and beverage products. Additionally, their natural antioxidant properties and associated health benefits boost their demand in health-conscious consumer markets.
By Source

By Source, the plant segment dominated the natural food colors market in 2023 and is anticipated to maintain its dominance during the forecast period. The growth of the plant segment is driven by rising consumer preference for natural, vegan, and sustainable ingredients, along with growing awareness of the health benefits of plant-derived colors. Moreover, the wide availability and variety of plant sources like fruits, vegetables, and herbs make them a popular choice among manufacturers.
By Form

By Form, the powder segment dominated the natural food colors market in 2023 and is anticipated to maintain its dominance during the forecast period. The growth of the powder segment is driven by its longer shelf life, ease of storage and transportation, and better stability under various processing conditions. Its suitability for dry mix formulations and cost-effective bulk handling further boosts its demand across food and beverage applications.
By Region

By Region, The Europe accounted for a major market share in 2023 and is expected to grow at a significant CAGR during the forecast period owing to strong consumer demand for clean-label and organic products, along with stringent regulations limiting synthetic additives and encouraging natural alternatives.
Competitive Landscape
The key players profiled in natural food colors market report are Archer-Daniels-Midland Company, T. Hasegawa Co., Ltd., Kanegrade Limited, Oterra A/S, Taiyo Kagaku Co., Ltd., San-Ei Gen F.F.I., Inc., Hawkins Watts Limited, Robertet Group, Byrnes & Kiefer Company, Gulf Flavours & Fragrances, California Natural Color, V. MANE Fils SAS, Koninklijke DSM N.V., BioconColors, The Watkin Company, Orginor Natural SA, Givaudan SA, Nactarome S.p.A., International Flavors & Fragrances Inc., Kalsec, Inc., GNT International B.V., Vivify, Sensient Technologies Corporation, and Dohler GmbH.
Key Benefits For Stakeholders
- This report provides a quantitative analysis of the market segments, current trends, estimations, and dynamics of the natural food colors market analysis from 2023 to 2035 to identify the prevailing natural food colors market opportunities.
- The market research is offered along with information related to key drivers, restraints, and opportunities.
- Porter's five forces analysis highlights the potency of buyers and suppliers to enable stakeholders make profit-oriented business decisions and strengthen their supplier-buyer network.
- In-depth analysis of the natural food colors market segmentation assists to determine the prevailing market opportunities.
- Major countries in each region are mapped according to their revenue contribution to the global market.
- Market player positioning facilitates benchmarking and provides a clear understanding of the present position of the market players.
- The report includes the analysis of the regional as well as global natural food colors market trends, key players, market segments, application areas, and natural food colorsmarket growth strategies.
Natural Food Colors Market Report Highlights
| Aspects | Details |
| Market Size By 2035 | USD 5.8 billion |
| Growth Rate | CAGR of 8.7% |
| Forecast period | 2023 - 2035 |
| Report Pages | 494 |
| By Color Type |
|
| By Source |
|
| By Form |
|
| By Solubility |
|
| By Application |
|
| By Region |
|
| Key Market Players | The Watkin Company, Sensient Technologies Corporation, Koninklijke DSM N.V., Archer-Daniels-Midland Company, Gulf Flavours & Fragrances, V. MANE Fils SAS, Hawkins Watts Limited, Taiyo Kagaku Co., Ltd., Givaudan SA, GNT International B.V., Byrnes & Kiefer Company, Orginor Natural SA, Vivify , Robertet Group, T. Hasegawa Co., Ltd., Kanegrade Limited, Nactarome S.p.A., BioconColors, Döhler GmbH, San-Ei Gen F.F.I., Inc., Kalsec, Inc., Oterra A/S, International Flavors & Fragrances Inc., California Natural Color |
The natural food colors market size was valued at USD 2.2 billion in 2023, and is projected to reach USD 5.8 billion by 2035.
The natural food colors market is projected to grow at a compound annual growth rate of 8.7% from 2024 to 2035 to reach USD 5.8 Billion by 2035
Archer-Daniels-Midland Company, T. Hasegawa Co., Ltd., Kanegrade Limited, Oterra A/S, Taiyo Kagaku Co., Ltd., San-Ei Gen F.F.I., Inc., Hawkins Watts Limited, Robertet Group, Byrnes & Kiefer Company, Gulf Flavours & Fragrances, California Natural Color, V. MANE Fils SAS, Koninklijke DSM N.V., BioconColors, The Watkin Company, Orginor Natural SA, Givaudan SA, Nactarome S.p.A., International Flavors & Fragrances Inc., Kalsec, Inc., GNT International B.V., Vivify, Sensient Technologies Corporation, and Döhler GmbH. are the top companies to hold the market share in Natural Food Colors
Europe is the largest regional market for Natural Food Colors?
A shift towards clean-label products, driven by consumer demand for transparency and health-conscious choices. Additionally, regulatory bodies are increasingly approving natural color additives, such as those derived from algae and butterfly pea flower, to replace synthetic dyes. Technological advancements, like microbial fermentation, are enhancing the stability and vibrancy of natural pigments, expanding their application in various food products.
Loading Table Of Content...
Loading Research Methodology...

