0
2022
Oil And Gas Data Management Market

Oil and Gas Data Management Market

by Type (Data Analysis, IT Infrastructure, and Services), Deployment Model (On-premise and Cloud), and Application (Upstream, Midstream, and Downstream): Global Opportunity Analysis and Industry Forecast, 2021-2030

✷  Report Code: A00773
Feb 2022 | Pages: 171
Tables: 131
Charts: 56
  • Formats*:

  • pdf

    Single User License, Five User
    License & Enterprise User License

  • xls

    Data Pack Excel License

  • ppt

    It comes with the additional cost
    of $2500.00 contact sales.


COVID-19

Pandemic disrupted the entire world and affected many industries.

Get detailed COVID-19 impact analysis on the Oil And Gas Data Management Market

Request Now !

Oil And Gas Data Management Market Statistics: 2030

The oil and gas data management market was valued at $15.80 billion in 2020, and is projected to reach $92.36 billion by 2030, registering a CAGR of 19.2% during the forecast period. Major growth drivers of the market include operational efficiency and performance improvement, increase in popularity of real-time analysis and predictive analytics solutions, and increase in awareness among end users.

The oil prices are falling as a result of production cut, while the demand for chemicals and refined goods has decreased as a result of industrial slowdowns and travel restrictions in the aftermath of the global epidemic. On the other hand, cloud computing and virtualization has proven to be fueling factors for the growth of the data management in oil and gas sector.

Over the past few years, the oil and gas industry witnessed massive growth in the data generation due to the deployment of data collection equipment such as sensors at various remote locations and operational fields. Moreover, increase in digitization, rise in adoption of enterprise mobility solutions, and real-time support to workforce have increased the need for advanced IT infrastructure. This, in turn, is anticipated to increase the industry spending on procuring efficient server, networking technologies, and storage systems to streamline business operations and improve the overall performance.

Oil-and-Gas-Data-Managemen-Market

Segment Review

The oil and gas data management market is segmented on the basis of type, deployment model and application, and region. On the basis of type, the market is categorized into data analysis, IT infrastructure, and services. Among the type of oil and gas data management systems, the IT infrastructure segment contributed the maximum market share in 2021, owing to the deployment of advanced networking and computing systems by end users especially in the emerging markets. According to the deployment model, the market is segmented into on-premise and cloud. By application, the market is segregated into upstream, midstream, and downstream. On the basis of region, it is analyzed across North America, Europe, Asia-Pacific, and LAMEA.

On the basis of type, the IT infrastructure segment dominated the oil and gas data management market in 2020, and is expected to continue this trend during the forecast period. This is attributed to oil and gas companies across the globe who focus on improving data management infrastructure, solutions, and services.

North America dominates the oil and gas data management market. Growth of the market in this region is attributed to continued growth in oil and gas data management solutions expenditure across the U.S. and Canada along with the major adoption of oil and gas data management solutions in the type such data analytics, IT infrastructure, and services. However, Asia-Pacific is expected to witness highest growth rate during the forecast period. Tremendous investments for oil and gas data management solutions among countries such as China, Japan, Thailand, India, and Indonesia fuel the growth of the oil and gas data management market size. In addition, change in oil and gas policies and rise in need for advanced analytics solutions and services among oil and gas companies operating in the Asia-Pacific region are projected to supplement the market growth during the forecast period. 

Oil and Gas Data Management Market
By Type

Your browser does not support the canvas element.

IT Infrastructure segment is projected as one of the most significant segments.

Get more information on this report : Request Sample Pages

Covid-19 Impact Analysis

Post COVID-19, the oil and gas data management market was valued at $15.80 billion in 2020, and is projected to reach $92.36 billion by 2030, registering a CAGR of 19.2%. The current estimation of 2030 is projected to be higher than pre-COVID-19 estimates. In 2020, almost every industry globally suffered a setback. This can be ascribed to severe disruptions in their respective manufacturing and supply-chain operations as a result of various precautionary lockdowns and other limitations imposed by governments globally. The global market is no exception. The oil prices are falling as a result of production cut, while the demand for chemicals and refined goods has decreased as a result of industrial slowdowns and travel restrictions in the aftermath of the global epidemic. On the other hand, cloud computing and virtualization has proven to be fueling factors for the growth of the data management in oil and gas sector.

Oil and Gas Data Management Market
By Deployment Model

Your browser does not support the canvas element.

Cloud segment is projected as one of the most lucrative segments.

Get more information on this report : Request Sample Pages

Top Impacting Factors    

The key impacting factors of the market include operational efficiency and performance improvement, increase in popularity of real-time analysis and predictive analytics solutions, increased awareness, increase in the number of cyber-attacks & data breaches, lack of skilled workforce, and high initial investment. These factors have significantly contributed to the growth of market size, and are anticipated to impact the oil and gas data management market growth during forecast period.

Operational Efficiency and Performance Improvement

Significant decline in oil price index affects the return on investment (ROI) of companies, which in turn results in continuous reduction in the headcount and capital expenditure. This has increased the need for effective and efficient utilization of large volume of data to make technical decisions. Furthermore, increase in adoption of pervasive computing devices, advanced storage capabilities, and new analytic tools present new possibilities to market players. Presently, oil and gas producers obtain real-time data from previously inaccessible areas at lower costs to improve their oil-field and plant performance. For instance, key players integrate production of nearby wells with real-time down-hole drilling data to help adapt their drilling strategy especially in unconventional fields. 

Oil and Gas Data Management Market
By Application

Your browser does not support the canvas element.

Upstream segment is projected as one of the most significant segments.

Get more information on this report : Request Sample Pages

Increase in Popularity of Real-time Analysis and Predictive Analytics Solutions  

The adoption and optimum utilization of real-time analytics and predictive analytics solutions have enabled oil and gas companies to operate efficiently in a low-price environment and concentrate on operating cost and capital investment. For instance, the adoption of data management solutions and services enabled U.S.-based oil and gas companies to improve their downstream operations, which helped them to continue their growth trend for the fifth year in a row. Furthermore, industries in the U.S. witnessed an upturn in export of refined products such as crude oil. This in turn, is projected to increase the adoption of enhanced data management solutions and services across the globe, and is anticipated to drive the market growth during the forecast period.

The report focuses on the growth prospects, restraints, and oil and gas data management market share. The study provides Porter’s five forces analysis of the oil and gas data management market forecast to understand the impact of various factors such as bargaining power of suppliers, competitive intensity of competitors, the threat of new entrants, threat of substitutes, and bargaining power of buyers on the oil and gas data management market trends.

Oil and Gas Data Management Market
By Region

2030
North America 
Europe
Asia-Pacific
LAMEA

Asia-Pacific is projected as one of the most lucrative region.

Get more information on this report : Request Sample Pages

Key Benefits For Stakeholders

  • This study includes the oil and gas data management market analysis, trends, and future estimations to determine the imminent investment pockets.
  • The report presents information related to key drivers, restraints, and oil and gas data management market opportunity. 
  • The oil and gas data management size is quantitatively analyzed from 2020 to 2030 to highlight the financial competency of the oil and gas data management industry.
  • The Porter’s five forces analysis illustrates the potency of buyers & suppliers in the global oil and gas data management industry.

Oil and Gas Data Management Market Report Highlights

Aspects Details
By Type
  • Data Analysis
  • IT Infrastructure
  • Services
By Deployment Model
  • On-premise
  • Cloud
By Application
  • Upstream
  • Midstream
  • Downstream
By Region
  • North America  (U.S., Canada)
  • Europe   (UK, Germany, France, Spain, Italy, Russia, Netherlands, Rest of Europe)
  • Asia-Pacific   (China, India, Japan, Australia, South Korea, Rest of Asia-Pacific)
  • LAMEA  (Latin America, Middle East, Africa)
CliQr Technologies, Inc., SimpliVity, Teradata, OpenDNS, Bapco (Bahrain Petroleum Company), Noah Consulting, LLC, Schlumberger, Reltio
 

CHAPTER 1:INTRODUCTION

1.1.Report Description
1.2.Key Market Segments
1.3.Key Benefits
1.4.Research Methodology

1.4.1. Primary Research
1.4.2. Secondary Research
1.4.3. Analyst Tools and Models

CHAPTER 2:EXECUTIVE SUMMARY

2.1.CXO Perspective

CHAPTER 3:MARKET LANDSCAPE

3.1.Market Definition and Scope
3.2.Key Findings

3.2.1. Top Investment Pockets
3.2.2. Top Winning Strategies

3.3.Porter's Five Forces Analysis

3.3.1. Bargaining Power of Suppliers
3.3.2. Threat of New Entrants
3.3.3. Threat of Substitutes
3.3.4. Competitive Rivalry
3.3.5. Bargaining Power among Buyers

3.4.Market Share Analysis/Top Player Positioning

3.4.1. Market Share Analysis/Top Player Positioning 2020

3.5.Market Dynamics

3.5.1. Drivers
3.5.2. Restraints
3.5.3. Opportunities

3.6.COVID-19 Impact Analysis
3.7. Patent landscape
3.8.Competitive Heatmap
3.9.Regulatory Guidelines

CHAPTER 4:OIL AND GAS DATA MANAGEMENT MARKET, BY TYPE

4.1.Market Overview

 4.1.1Market Size and Forecast, By Type

4.2. IT Infrastructure

4.2.1. Key Market Trends, Growth Factors and Opportunities
4.2.2. Market Size and Forecast, By Region 
4.2.3. Market Share Analysis, By Country

4.3. Data Analysis

4.3.1. Key Market Trends, Growth Factors and Opportunities
4.3.2. Market Size and Forecast, By Region 
4.3.3. Market Share Analysis, By Country

4.4. Services

4.4.1. Key Market Trends, Growth Factors and Opportunities
4.4.2. Market Size and Forecast, By Region 
4.4.3. Market Share Analysis, By Country

CHAPTER 5:OIL AND GAS DATA MANAGEMENT MARKET, BY DEPLOYMENT MODEL

5.1.Market Overview

 5.1.1Market Size and Forecast, By Deployment Model

5.2. On-premise

5.2.1. Key Market Trends, Growth Factors and Opportunities
5.2.2. Market Size and Forecast, By Region 
5.2.3. Market Share Analysis, By Country

5.3. Cloud

5.3.1. Key Market Trends, Growth Factors and Opportunities
5.3.2. Market Size and Forecast, By Region 
5.3.3. Market Share Analysis, By Country

CHAPTER 6:OIL AND GAS DATA MANAGEMENT MARKET, BY APPLICATION

6.1.Market Overview

 6.1.1Market Size and Forecast, By Application

6.2. Upstream

6.2.1. Key Market Trends, Growth Factors and Opportunities
6.2.2. Market Size and Forecast, By Region 
6.2.3. Market Share Analysis, By Country

6.3. Midstream

6.3.1. Key Market Trends, Growth Factors and Opportunities
6.3.2. Market Size and Forecast, By Region 
6.3.3. Market Share Analysis, By Country

6.4. Downstream

6.4.1. Key Market Trends, Growth Factors and Opportunities
6.4.2. Market Size and Forecast, By Region 
6.4.3. Market Share Analysis, By Country

CHAPTER 7:OIL AND GAS DATA MANAGEMENT MARKET, BY REGION

7.1.Market Overview

 7.1.1Market Size and Forecast, By Region

7.2.North America

7.2.1. Key Market Trends and Opportunities
7.2.2. Market Size and Forecast, By Type
7.2.3. Market Size and Forecast, By Deployment Model
7.2.4. Market Size and Forecast, By Application
7.2.5. Market Size and Forecast, By Country
7.2.6. United States Oil And Gas Data Management Market

7.2.6.1. Market Size and Forecast, By Type
7.2.6.2. Market Size and Forecast, By Deployment Model
7.2.6.3. Market Size and Forecast, By Application

7.2.7. Canada Oil And Gas Data Management Market

7.2.7.1. Market Size and Forecast, By Type
7.2.7.2. Market Size and Forecast, By Deployment Model
7.2.7.3. Market Size and Forecast, By Application

7.3.Europe

7.3.1. Key Market Trends and Opportunities
7.3.2. Market Size and Forecast, By Type
7.3.3. Market Size and Forecast, By Deployment Model
7.3.4. Market Size and Forecast, By Application
7.3.5. Market Size and Forecast, By Country
7.3.6. U.K Oil And Gas Data Management Market

7.3.6.1. Market Size and Forecast, By Type
7.3.6.2. Market Size and Forecast, By Deployment Model
7.3.6.3. Market Size and Forecast, By Application

7.3.7. Germany Oil And Gas Data Management Market

7.3.7.1. Market Size and Forecast, By Type
7.3.7.2. Market Size and Forecast, By Deployment Model
7.3.7.3. Market Size and Forecast, By Application

7.3.8. France Oil And Gas Data Management Market

7.3.8.1. Market Size and Forecast, By Type
7.3.8.2. Market Size and Forecast, By Deployment Model
7.3.8.3. Market Size and Forecast, By Application

7.3.9. Spain Oil And Gas Data Management Market

7.3.9.1. Market Size and Forecast, By Type
7.3.9.2. Market Size and Forecast, By Deployment Model
7.3.9.3. Market Size and Forecast, By Application

7.3.10. Italy Oil And Gas Data Management Market

7.3.10.1. Market Size and Forecast, By Type
7.3.10.2. Market Size and Forecast, By Deployment Model
7.3.10.3. Market Size and Forecast, By Application

7.3.11. Russia Oil And Gas Data Management Market

7.3.11.1. Market Size and Forecast, By Type
7.3.11.2. Market Size and Forecast, By Deployment Model
7.3.11.3. Market Size and Forecast, By Application

7.3.12. Netherlands Oil And Gas Data Management Market

7.3.12.1. Market Size and Forecast, By Type
7.3.12.2. Market Size and Forecast, By Deployment Model
7.3.12.3. Market Size and Forecast, By Application

7.3.13. Rest Of Europe Oil And Gas Data Management Market

7.3.13.1. Market Size and Forecast, By Type
7.3.13.2. Market Size and Forecast, By Deployment Model
7.3.13.3. Market Size and Forecast, By Application

7.4.Asia-Pacific

7.4.1. Key Market Trends and Opportunities
7.4.2. Market Size and Forecast, By Type
7.4.3. Market Size and Forecast, By Deployment Model
7.4.4. Market Size and Forecast, By Application
7.4.5. Market Size and Forecast, By Country
7.4.6. China Oil And Gas Data Management Market

7.4.6.1. Market Size and Forecast, By Type
7.4.6.2. Market Size and Forecast, By Deployment Model
7.4.6.3. Market Size and Forecast, By Application

7.4.7. India Oil And Gas Data Management Market

7.4.7.1. Market Size and Forecast, By Type
7.4.7.2. Market Size and Forecast, By Deployment Model
7.4.7.3. Market Size and Forecast, By Application

7.4.8. Japan Oil And Gas Data Management Market

7.4.8.1. Market Size and Forecast, By Type
7.4.8.2. Market Size and Forecast, By Deployment Model
7.4.8.3. Market Size and Forecast, By Application

7.4.9. Australia Oil And Gas Data Management Market

7.4.9.1. Market Size and Forecast, By Type
7.4.9.2. Market Size and Forecast, By Deployment Model
7.4.9.3. Market Size and Forecast, By Application

7.4.10. South Korea Oil And Gas Data Management Market

7.4.10.1. Market Size and Forecast, By Type
7.4.10.2. Market Size and Forecast, By Deployment Model
7.4.10.3. Market Size and Forecast, By Application

7.4.11. Rest Of Asia-pacific Oil And Gas Data Management Market

7.4.11.1. Market Size and Forecast, By Type
7.4.11.2. Market Size and Forecast, By Deployment Model
7.4.11.3. Market Size and Forecast, By Application

7.5.LAMEA

7.5.1. Key Market Trends and Opportunities
7.5.2. Market Size and Forecast, By Type
7.5.3. Market Size and Forecast, By Deployment Model
7.5.4. Market Size and Forecast, By Application
7.5.5. Market Size and Forecast, By Country
7.5.6. Latin America Oil And Gas Data Management Market

7.5.6.1. Market Size and Forecast, By Type
7.5.6.2. Market Size and Forecast, By Deployment Model
7.5.6.3. Market Size and Forecast, By Application

7.5.7. Middle East Oil And Gas Data Management Market

7.5.7.1. Market Size and Forecast, By Type
7.5.7.2. Market Size and Forecast, By Deployment Model
7.5.7.3. Market Size and Forecast, By Application

7.5.8. Africa Oil And Gas Data Management Market

7.5.8.1. Market Size and Forecast, By Type
7.5.8.2. Market Size and Forecast, By Deployment Model
7.5.8.3. Market Size and Forecast, By Application

CHAPTER 8:COMPANY PROFILES

8.1. Cisco Systems, Inc.

8.1.1.Company Overview
8.1.2.Key Executives
8.1.3.Company snapshot
8.1.4.Operating business segments
8.1.5.Product portfolio
8.1.6.Business Performance
8.1.7.Key Strategic Moves and Developments

8.2. EMC Corporation

8.2.1.Company Overview
8.2.2.Key Executives
8.2.3.Company snapshot
8.2.4.Operating business segments
8.2.5.Product portfolio
8.2.6.Business Performance
8.2.7.Key Strategic Moves and Developments

8.3. Hewlett-Packard Enterprise Company

8.3.1.Company Overview
8.3.2.Key Executives
8.3.3.Company snapshot
8.3.4.Operating business segments
8.3.5.Product portfolio
8.3.6.Business Performance
8.3.7.Key Strategic Moves and Developments

8.4. Hitachi, Ltd.

8.4.1.Company Overview
8.4.2.Key Executives
8.4.3.Company snapshot
8.4.4.Operating business segments
8.4.5.Product portfolio
8.4.6.Business Performance
8.4.7.Key Strategic Moves and Developments

8.5. IBM Corporation

8.5.1.Company Overview
8.5.2.Key Executives
8.5.3.Company snapshot
8.5.4.Operating business segments
8.5.5.Product portfolio
8.5.6.Business Performance
8.5.7.Key Strategic Moves and Developments

8.6. Infosys Limited

8.6.1.Company Overview
8.6.2.Key Executives
8.6.3.Company snapshot
8.6.4.Operating business segments
8.6.5.Product portfolio
8.6.6.Business Performance
8.6.7.Key Strategic Moves and Developments

8.7. NetApp, Inc.

8.7.1.Company Overview
8.7.2.Key Executives
8.7.3.Company snapshot
8.7.4.Operating business segments
8.7.5.Product portfolio
8.7.6.Business Performance
8.7.7.Key Strategic Moves and Developments

8.8. Oracle Corporation

8.8.1.Company Overview
8.8.2.Key Executives
8.8.3.Company snapshot
8.8.4.Operating business segments
8.8.5.Product portfolio
8.8.6.Business Performance
8.8.7.Key Strategic Moves and Developments

8.9. SAP SE

8.9.1.Company Overview
8.9.2.Key Executives
8.9.3.Company snapshot
8.9.4.Operating business segments
8.9.5.Product portfolio
8.9.6.Business Performance
8.9.7.Key Strategic Moves and Developments

8.10. Wipro Limited

8.10.1.Company Overview
8.10.2.Key Executives
8.10.3.Company snapshot
8.10.4.Operating business segments
8.10.5.Product portfolio
8.10.6.Business Performance
8.10.7.Key Strategic Moves and Developments
  
LIST OF TABLES

TABLE 1.    GLOBAL OIL AND GAS DATA MANAGEMENT MARKET, BY TYPE, 2020-2030 ($MILLION)
TABLE 2.    GLOBAL OIL AND GAS DATA MANAGEMENT MARKET FOR IT INFRASTRUCTURE, BY REGION, 2020-2030 ($MILLION)
TABLE 3.    GLOBAL OIL AND GAS DATA MANAGEMENT MARKET FOR DATA ANALYSIS, BY REGION, 2020-2030 ($MILLION)
TABLE 4.    GLOBAL OIL AND GAS DATA MANAGEMENT MARKET FOR SERVICES, BY REGION, 2020-2030 ($MILLION)
TABLE 5.    GLOBAL OIL AND GAS DATA MANAGEMENT MARKET, BY DEPLOYMENT MODEL, 2020-2030 ($MILLION)
TABLE 6.    GLOBAL OIL AND GAS DATA MANAGEMENT MARKET FOR ON-PREMISE, BY REGION, 2020-2030 ($MILLION)
TABLE 7.    GLOBAL OIL AND GAS DATA MANAGEMENT MARKET FOR CLOUD, BY REGION, 2020-2030 ($MILLION)
TABLE 8.    GLOBAL OIL AND GAS DATA MANAGEMENT MARKET, BY APPLICATION, 2020-2030 ($MILLION)
TABLE 9.    GLOBAL OIL AND GAS DATA MANAGEMENT MARKET FOR UPSTREAM, BY REGION, 2020-2030 ($MILLION)
TABLE 10.    GLOBAL OIL AND GAS DATA MANAGEMENT MARKET FOR MIDSTREAM, BY REGION, 2020-2030 ($MILLION)
TABLE 11.    GLOBAL OIL AND GAS DATA MANAGEMENT MARKET FOR DOWNSTREAM, BY REGION, 2020-2030 ($MILLION)
TABLE 12.    GLOBAL OIL AND GAS DATA MANAGEMENT MARKET, BY REGION, 2020-2030 ($MILLION)
TABLE 13.    NORTH AMERICA OIL AND GAS DATA MANAGEMENT, BY TYPE, 2020-2030 ($MILLION)
TABLE 14.    NORTH AMERICA OIL AND GAS DATA MANAGEMENT, BY DEPLOYMENT MODEL, 2020-2030 ($MILLION)
TABLE 15.    NORTH AMERICA OIL AND GAS DATA MANAGEMENT, BY APPLICATION, 2020-2030 ($MILLION)
TABLE 16.    UNITED STATES OIL AND GAS DATA MANAGEMENT, BY TYPE, 2020-2030 ($MILLION)
TABLE 17.    UNITED STATES OIL AND GAS DATA MANAGEMENT, BY DEPLOYMENT MODEL, 2020-2030 ($MILLION)
TABLE 18.    UNITED STATES OIL AND GAS DATA MANAGEMENT, BY APPLICATION, 2020-2030 ($MILLION)
TABLE 19.    CANADA OIL AND GAS DATA MANAGEMENT, BY TYPE, 2020-2030 ($MILLION)
TABLE 20.    CANADA OIL AND GAS DATA MANAGEMENT, BY DEPLOYMENT MODEL, 2020-2030 ($MILLION)
TABLE 21.    CANADA OIL AND GAS DATA MANAGEMENT, BY APPLICATION, 2020-2030 ($MILLION)
TABLE 22.    EUROPE OIL AND GAS DATA MANAGEMENT, BY TYPE, 2020-2030 ($MILLION)
TABLE 23.    EUROPE OIL AND GAS DATA MANAGEMENT, BY DEPLOYMENT MODEL, 2020-2030 ($MILLION)
TABLE 24.    EUROPE OIL AND GAS DATA MANAGEMENT, BY APPLICATION, 2020-2030 ($MILLION)
TABLE 25.    UNITED KINGDOM OIL AND GAS DATA MANAGEMENT, BY TYPE, 2020-2030 ($MILLION)
TABLE 26.    UNITED KINGDOM OIL AND GAS DATA MANAGEMENT, BY DEPLOYMENT MODEL, 2020-2030 ($MILLION)
TABLE 27.    UNITED KINGDOM OIL AND GAS DATA MANAGEMENT, BY APPLICATION, 2020-2030 ($MILLION)
TABLE 28.    GERMANY OIL AND GAS DATA MANAGEMENT, BY TYPE, 2020-2030 ($MILLION)
TABLE 29.    GERMANY OIL AND GAS DATA MANAGEMENT, BY DEPLOYMENT MODEL, 2020-2030 ($MILLION)
TABLE 30.    GERMANY OIL AND GAS DATA MANAGEMENT, BY APPLICATION, 2020-2030 ($MILLION)
TABLE 31.    FRANCE OIL AND GAS DATA MANAGEMENT, BY TYPE, 2020-2030 ($MILLION)
TABLE 32.    FRANCE OIL AND GAS DATA MANAGEMENT, BY DEPLOYMENT MODEL, 2020-2030 ($MILLION)
TABLE 33.    FRANCE OIL AND GAS DATA MANAGEMENT, BY APPLICATION, 2020-2030 ($MILLION)
TABLE 34.    SPAIN OIL AND GAS DATA MANAGEMENT, BY TYPE, 2020-2030 ($MILLION)
TABLE 35.    SPAIN OIL AND GAS DATA MANAGEMENT, BY DEPLOYMENT MODEL, 2020-2030 ($MILLION)
TABLE 36.    SPAIN OIL AND GAS DATA MANAGEMENT, BY APPLICATION, 2020-2030 ($MILLION)
TABLE 37.    ITALY OIL AND GAS DATA MANAGEMENT, BY TYPE, 2020-2030 ($MILLION)
TABLE 38.    ITALY OIL AND GAS DATA MANAGEMENT, BY DEPLOYMENT MODEL, 2020-2030 ($MILLION)
TABLE 39.    ITALY OIL AND GAS DATA MANAGEMENT, BY APPLICATION, 2020-2030 ($MILLION)
TABLE 40.    RUSSIA OIL AND GAS DATA MANAGEMENT, BY TYPE, 2020-2030 ($MILLION)
TABLE 41.    RUSSIA OIL AND GAS DATA MANAGEMENT, BY DEPLOYMENT MODEL, 2020-2030 ($MILLION)
TABLE 42.    RUSSIA OIL AND GAS DATA MANAGEMENT, BY APPLICATION, 2020-2030 ($MILLION)
TABLE 43.    NETHERLANDS OIL AND GAS DATA MANAGEMENT, BY TYPE, 2020-2030 ($MILLION)
TABLE 44.    NETHERLANDS OIL AND GAS DATA MANAGEMENT, BY DEPLOYMENT MODEL, 2020-2030 ($MILLION)
TABLE 45.    NETHERLANDS OIL AND GAS DATA MANAGEMENT, BY APPLICATION, 2020-2030 ($MILLION)
TABLE 46.    REST OF EUROPE OIL AND GAS DATA MANAGEMENT, BY TYPE, 2020-2030 ($MILLION)
TABLE 47.    REST OF EUROPE OIL AND GAS DATA MANAGEMENT, BY DEPLOYMENT MODEL, 2020-2030 ($MILLION)
TABLE 48.    REST OF EUROPE OIL AND GAS DATA MANAGEMENT, BY APPLICATION, 2020-2030 ($MILLION)
TABLE 49.    ASIA-PACIFIC OIL AND GAS DATA MANAGEMENT, BY TYPE, 2020-2030 ($MILLION)
TABLE 50.    ASIA-PACIFIC OIL AND GAS DATA MANAGEMENT, BY DEPLOYMENT MODEL, 2020-2030 ($MILLION)
TABLE 51.    ASIA-PACIFIC OIL AND GAS DATA MANAGEMENT, BY APPLICATION, 2020-2030 ($MILLION)
TABLE 52.    CHINA OIL AND GAS DATA MANAGEMENT, BY TYPE, 2020-2030 ($MILLION)
TABLE 53.    CHINA OIL AND GAS DATA MANAGEMENT, BY DEPLOYMENT MODEL, 2020-2030 ($MILLION)
TABLE 54.    CHINA OIL AND GAS DATA MANAGEMENT, BY APPLICATION, 2020-2030 ($MILLION)
TABLE 55.    INDIA OIL AND GAS DATA MANAGEMENT, BY TYPE, 2020-2030 ($MILLION)
TABLE 56.    INDIA OIL AND GAS DATA MANAGEMENT, BY DEPLOYMENT MODEL, 2020-2030 ($MILLION)
TABLE 57.    INDIA OIL AND GAS DATA MANAGEMENT, BY APPLICATION, 2020-2030 ($MILLION)
TABLE 58.    JAPAN OIL AND GAS DATA MANAGEMENT, BY TYPE, 2020-2030 ($MILLION)
TABLE 59.    JAPAN OIL AND GAS DATA MANAGEMENT, BY DEPLOYMENT MODEL, 2020-2030 ($MILLION)
TABLE 60.    JAPAN OIL AND GAS DATA MANAGEMENT, BY APPLICATION, 2020-2030 ($MILLION)
TABLE 61.    AUSTRALIA OIL AND GAS DATA MANAGEMENT, BY TYPE, 2020-2030 ($MILLION)
TABLE 62.    AUSTRALIA OIL AND GAS DATA MANAGEMENT, BY DEPLOYMENT MODEL, 2020-2030 ($MILLION)
TABLE 63.    AUSTRALIA OIL AND GAS DATA MANAGEMENT, BY APPLICATION, 2020-2030 ($MILLION)
TABLE 64.    SOUTH KOREA OIL AND GAS DATA MANAGEMENT, BY TYPE, 2020-2030 ($MILLION)
TABLE 65.    SOUTH KOREA OIL AND GAS DATA MANAGEMENT, BY DEPLOYMENT MODEL, 2020-2030 ($MILLION)
TABLE 66.    SOUTH KOREA OIL AND GAS DATA MANAGEMENT, BY APPLICATION, 2020-2030 ($MILLION)
TABLE 67.    REST OF ASIA-PACIFIC OIL AND GAS DATA MANAGEMENT, BY TYPE, 2020-2030 ($MILLION)
TABLE 68.    REST OF ASIA-PACIFIC OIL AND GAS DATA MANAGEMENT, BY DEPLOYMENT MODEL, 2020-2030 ($MILLION)
TABLE 69.    REST OF ASIA-PACIFIC OIL AND GAS DATA MANAGEMENT, BY APPLICATION, 2020-2030 ($MILLION)
TABLE 70.    LAMEA OIL AND GAS DATA MANAGEMENT, BY TYPE, 2020-2030 ($MILLION)
TABLE 71.    LAMEA OIL AND GAS DATA MANAGEMENT, BY DEPLOYMENT MODEL, 2020-2030 ($MILLION)
TABLE 72.    LAMEA OIL AND GAS DATA MANAGEMENT, BY APPLICATION, 2020-2030 ($MILLION)
TABLE 73.    LATIN AMERICA OIL AND GAS DATA MANAGEMENT, BY TYPE, 2020-2030 ($MILLION)
TABLE 74.    LATIN AMERICA OIL AND GAS DATA MANAGEMENT, BY DEPLOYMENT MODEL, 2020-2030 ($MILLION)
TABLE 75.    LATIN AMERICA OIL AND GAS DATA MANAGEMENT, BY APPLICATION, 2020-2030 ($MILLION)
TABLE 76.    MIDDLE EAST OIL AND GAS DATA MANAGEMENT, BY TYPE, 2020-2030 ($MILLION)
TABLE 77.    MIDDLE EAST OIL AND GAS DATA MANAGEMENT, BY DEPLOYMENT MODEL, 2020-2030 ($MILLION)
TABLE 78.    MIDDLE EAST OIL AND GAS DATA MANAGEMENT, BY APPLICATION, 2020-2030 ($MILLION)
TABLE 79.    AFRICA OIL AND GAS DATA MANAGEMENT, BY TYPE, 2020-2030 ($MILLION)
TABLE 80.    AFRICA OIL AND GAS DATA MANAGEMENT, BY DEPLOYMENT MODEL, 2020-2030 ($MILLION)
TABLE 81.    AFRICA OIL AND GAS DATA MANAGEMENT, BY APPLICATION, 2020-2030 ($MILLION)
TABLE 82.    CISCO SYSTEMS, INC.: KEY EXECUTIVES
TABLE 83.    CISCO SYSTEMS, INC.: COMPANY SNAPSHOT
TABLE 84.    CISCO SYSTEMS, INC.: OPERATING SEGMENTS
TABLE 85.    CISCO SYSTEMS, INC.: PRODUCT PORTFOLIO
TABLE 86.    CISCO SYSTEMS, INC.: KEY STRATEGIC MOVES AND DEVELOPMENTS
TABLE 87.    EMC CORPORATION: KEY EXECUTIVES
TABLE 88.    EMC CORPORATION: COMPANY SNAPSHOT
TABLE 89.    EMC CORPORATION: OPERATING SEGMENTS
TABLE 90.    EMC CORPORATION: PRODUCT PORTFOLIO
TABLE 91.    EMC CORPORATION: KEY STRATEGIC MOVES AND DEVELOPMENTS
TABLE 92.    HEWLETT-PACKARD ENTERPRISE COMPANY: KEY EXECUTIVES
TABLE 93.    HEWLETT-PACKARD ENTERPRISE COMPANY: COMPANY SNAPSHOT
TABLE 94.    HEWLETT-PACKARD ENTERPRISE COMPANY: OPERATING SEGMENTS
TABLE 95.    HEWLETT-PACKARD ENTERPRISE COMPANY: PRODUCT PORTFOLIO
TABLE 96.    HEWLETT-PACKARD ENTERPRISE COMPANY: KEY STRATEGIC MOVES AND DEVELOPMENTS
TABLE 97.    HITACHI, LTD.: KEY EXECUTIVES
TABLE 98.    HITACHI, LTD.: COMPANY SNAPSHOT
TABLE 99.    HITACHI, LTD.: OPERATING SEGMENTS
TABLE 100.    HITACHI, LTD.: PRODUCT PORTFOLIO
TABLE 101.    HITACHI, LTD.: KEY STRATEGIC MOVES AND DEVELOPMENTS
TABLE 102.    IBM CORPORATION: KEY EXECUTIVES
TABLE 103.    IBM CORPORATION: COMPANY SNAPSHOT
TABLE 104.    IBM CORPORATION: OPERATING SEGMENTS
TABLE 105.    IBM CORPORATION: PRODUCT PORTFOLIO
TABLE 106.    IBM CORPORATION: KEY STRATEGIC MOVES AND DEVELOPMENTS
TABLE 107.    INFOSYS LIMITED: KEY EXECUTIVES
TABLE 108.    INFOSYS LIMITED: COMPANY SNAPSHOT
TABLE 109.    INFOSYS LIMITED: OPERATING SEGMENTS
TABLE 110.    INFOSYS LIMITED: PRODUCT PORTFOLIO
TABLE 111.    INFOSYS LIMITED: KEY STRATEGIC MOVES AND DEVELOPMENTS
TABLE 112.    NETAPP, INC.: KEY EXECUTIVES
TABLE 113.    NETAPP, INC.: COMPANY SNAPSHOT
TABLE 114.    NETAPP, INC.: OPERATING SEGMENTS
TABLE 115.    NETAPP, INC.: PRODUCT PORTFOLIO
TABLE 116.    NETAPP, INC.: KEY STRATEGIC MOVES AND DEVELOPMENTS
TABLE 117.    ORACLE CORPORATION: KEY EXECUTIVES
TABLE 118.    ORACLE CORPORATION: COMPANY SNAPSHOT
TABLE 119.    ORACLE CORPORATION: OPERATING SEGMENTS
TABLE 120.    ORACLE CORPORATION: PRODUCT PORTFOLIO
TABLE 121.    ORACLE CORPORATION: KEY STRATEGIC MOVES AND DEVELOPMENTS
TABLE 122.    SAP SE: KEY EXECUTIVES
TABLE 123.    SAP SE: COMPANY SNAPSHOT
TABLE 124.    SAP SE: OPERATING SEGMENTS
TABLE 125.    SAP SE: PRODUCT PORTFOLIO
TABLE 126.    SAP SE: KEY STRATEGIC MOVES AND DEVELOPMENTS
TABLE 127.    WIPRO LIMITED: KEY EXECUTIVES
TABLE 128.    WIPRO LIMITED: COMPANY SNAPSHOT
TABLE 129.    WIPRO LIMITED: OPERATING SEGMENTS
TABLE 130.    WIPRO LIMITED: PRODUCT PORTFOLIO
TABLE 131.    WIPRO LIMITED: KEY STRATEGIC MOVES AND DEVELOPMENTS

LIST OF FIGURES

FIGURE 1.    GLOBAL OIL AND GAS DATA MANAGEMENT MARKET SEGMENTATION
FIGURE 2.    GLOBAL OIL AND GAS DATA MANAGEMENT MARKET
FIGURE 3.    SEGMENTATION OIL AND GAS DATA MANAGEMENT MARKET
FIGURE 4.    TOP INVESTMENT POCKET IN OIL AND GAS DATA MANAGEMENT MARKET
FIGURE 5.    TOP WINNING STRATEGIES, 2019-2021*
FIGURE 6.    TOP WINNING STRATEGIES, BY DEVELOPMENT, 2019-2021(%)
FIGURE 7.    TOP WINNING STRATEGIES, BY COMPANY, 2019-2021*
FIGURE 8.    MODERATE BARGAINING POWER OF BUYERS
FIGURE 9.    MODERATE BARGAINING POWER OF SUPPLIERS
FIGURE 10.    MODERATE THREAT OF NEW ENTRANTS
FIGURE 11.    LOW THREAT OF SUBSTITUTION
FIGURE 12.    HIGH COMPETITIVE RIVALRY
FIGURE 13.    TOP PLAYER POSITIONING, 2020
FIGURE 14.    MARKET SHARE ANALYSIS, 2020
FIGURE 15.    RESTRAINTS AND DRIVERS: OIL AND GAS DATA MANAGEMENT MARKET
FIGURE 16.    OIL AND GAS DATA MANAGEMENT MARKET SEGMENTATION, BY TYPE
FIGURE 17.    OIL AND GAS DATA MANAGEMENT MARKET FOR IT INFRASTRUCTURE, BY COUNTRY, 2020-2030 ($MILLION)
FIGURE 18.    OIL AND GAS DATA MANAGEMENT MARKET FOR DATA ANALYSIS, BY COUNTRY, 2020-2030 ($MILLION)
FIGURE 19.    OIL AND GAS DATA MANAGEMENT MARKET FOR SERVICES, BY COUNTRY, 2020-2030 ($MILLION)
FIGURE 20.    OIL AND GAS DATA MANAGEMENT MARKET SEGMENTATION, BY DEPLOYMENT MODEL
FIGURE 21.    OIL AND GAS DATA MANAGEMENT MARKET FOR ON-PREMISE, BY COUNTRY, 2020-2030 ($MILLION)
FIGURE 22.    OIL AND GAS DATA MANAGEMENT MARKET FOR CLOUD, BY COUNTRY, 2020-2030 ($MILLION)
FIGURE 23.    OIL AND GAS DATA MANAGEMENT MARKET SEGMENTATION, BY APPLICATION
FIGURE 24.    OIL AND GAS DATA MANAGEMENT MARKET FOR UPSTREAM, BY COUNTRY, 2020-2030 ($MILLION)
FIGURE 25.    OIL AND GAS DATA MANAGEMENT MARKET FOR MIDSTREAM, BY COUNTRY, 2020-2030 ($MILLION)
FIGURE 26.    OIL AND GAS DATA MANAGEMENT MARKET FOR DOWNSTREAM, BY COUNTRY, 2020-2030 ($MILLION)
FIGURE 27.    CISCO SYSTEMS, INC.: NET SALES, 2018-2020 ($MILLION)
FIGURE 28.    CISCO SYSTEMS, INC.: REVENUE SHARE, BY SEGMENT, 2020 (%)
FIGURE 29.    CISCO SYSTEMS, INC.: REVENUE SHARE, BY REGION, 2020 (%)
FIGURE 30.    EMC CORPORATION: NET SALES, 2018-2020 ($MILLION)
FIGURE 31.    EMC CORPORATION: REVENUE SHARE, BY SEGMENT, 2020 (%)
FIGURE 32.    EMC CORPORATION: REVENUE SHARE, BY REGION, 2020 (%)
FIGURE 33.    HEWLETT-PACKARD ENTERPRISE COMPANY: NET SALES, 2018-2020 ($MILLION)
FIGURE 34.    HEWLETT-PACKARD ENTERPRISE COMPANY: REVENUE SHARE, BY SEGMENT, 2020 (%)
FIGURE 35.    HEWLETT-PACKARD ENTERPRISE COMPANY: REVENUE SHARE, BY REGION, 2020 (%)
FIGURE 36.    HITACHI, LTD.: NET SALES, 2018-2020 ($MILLION)
FIGURE 37.    HITACHI, LTD.: REVENUE SHARE, BY SEGMENT, 2020 (%)
FIGURE 38.    HITACHI, LTD.: REVENUE SHARE, BY REGION, 2020 (%)
FIGURE 39.    IBM CORPORATION: NET SALES, 2018-2020 ($MILLION)
FIGURE 40.    IBM CORPORATION: REVENUE SHARE, BY SEGMENT, 2020 (%)
FIGURE 41.    IBM CORPORATION: REVENUE SHARE, BY REGION, 2020 (%)
FIGURE 42.    INFOSYS LIMITED: NET SALES, 2018-2020 ($MILLION)
FIGURE 43.    INFOSYS LIMITED: REVENUE SHARE, BY SEGMENT, 2020 (%)
FIGURE 44.    INFOSYS LIMITED: REVENUE SHARE, BY REGION, 2020 (%)
FIGURE 45.    NETAPP, INC.: NET SALES, 2018-2020 ($MILLION)
FIGURE 46.    NETAPP, INC.: REVENUE SHARE, BY SEGMENT, 2020 (%)
FIGURE 47.    NETAPP, INC.: REVENUE SHARE, BY REGION, 2020 (%)
FIGURE 48.    ORACLE CORPORATION: NET SALES, 2018-2020 ($MILLION)
FIGURE 49.    ORACLE CORPORATION: REVENUE SHARE, BY SEGMENT, 2020 (%)
FIGURE 50.    ORACLE CORPORATION: REVENUE SHARE, BY REGION, 2020 (%)
FIGURE 51.    SAP SE: NET SALES, 2018-2020 ($MILLION)
FIGURE 52.    SAP SE: REVENUE SHARE, BY SEGMENT, 2020 (%)
FIGURE 53.    SAP SE: REVENUE SHARE, BY REGION, 2020 (%)
FIGURE 54.    WIPRO LIMITED: NET SALES, 2018-2020 ($MILLION)
FIGURE 55.    WIPRO LIMITED: REVENUE SHARE, BY SEGMENT, 2020 (%)
FIGURE 56.    WIPRO LIMITED: REVENUE SHARE, BY REGION, 20


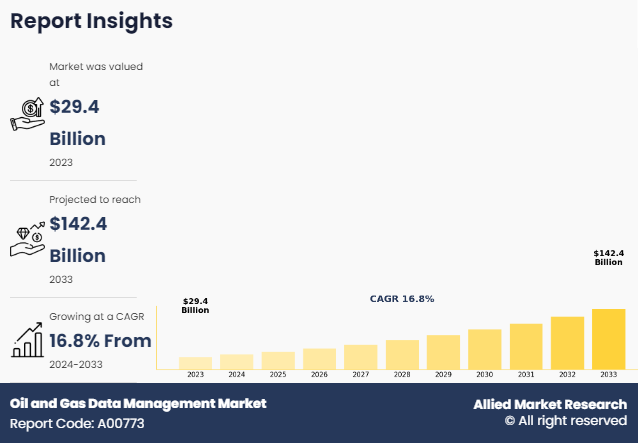
The global oil and gas data management market is projected to witness healthy growth in the near future, especially in Asia-Pacific and LAMEA regions. This is attributed to growing need for operations and performance improvement, increase in popularity of real-time analysis and predictive analytics solutions, and increased awareness among end users regarding benefits of data management solutions and services.

The market is projected to grow at a significant CAGR during the forecast period, owing to surge in digitization and growing trend of data-driven decision making among end user companies. Prominent players operating in the oil and gas data management market focus on introducing advanced data analytics solutions equipped with high-definition graphics features that enable users to identify new resource locations and predict oil availability.

Advanced analytics solutions are anticipated to play a crucial role to improve efficiency of conventional, unconventional, and midstream operations. Furthermore, the adoption of data analytics solutions is projected to assist oil and gas companies to improve their productivity by 6– 8%. 

Generally, oil and companies adopt operational models with functional excellence, which are successful in predictable processes. However, these models are not successful and efficient in real-time environment, such as during unconventional production. Thus, oil and gas companies are expected to adopt an asset-based organizational model to enable a clear and integrated view of various operations.

Prominent players in the oil and gas data management market are projected to introduce enhanced cloud-based data management solutions and services to enable oil and gas companies to reduce non-productive time, operational costs, and mitigate uncertainty & risks. Furthermore, business expansion in emerging and untapped markets is projected to increase the revenue potential of data management hardware, solutions, and services providers, owing to low penetration of data management hardware and software. Prominent players are projected to focus on acquisition or strategic alliance with startups and well-established local players to expand their market presence and sustain the market competition.

PURCHASE OPTIONS

Call or Email us

U.S.-Canada Toll-free: +1-800-792-5285
Int'l : +1-503-894-6022
Europe : +44-845-528-1300
Email : help@alliedmarketresearch.com

Looking for Customization?

 Customization Request

Have a Question?

 Speak with Analyst

Any Confusion?

 Inquire Before Buying

Have a glance of the Report

  Request Sample
RELATED TAGS

Purchase Full Report of
Oil And Gas Data Management Market

Start reading instantly.
This Report and over 67,404+ more Reports, Available with Avenue Library. T&C*.

  • Online Only
  • $3,713
  • Online cloud access only
  • Restricted print, copy, paste & download
  • Read only
  • Free industry update
    (Within 180 days)
  • Free report update in next update cycle
    (Feb 2023 - Feb 2024)
  • Data Pack
  • $4,126
  • Restricted to one authorized user
  • One print only
  • Available in
    Excel
  • Free industry update
    (Within 180 days)
  •   Free report update in next update cycle
    (Feb 2023 - Feb 2024)
  • Single User
  • $5,770
  • Restricted to one authorized user
  • One print only
  • Available in
    PDF
  • Free industry update
    (Within 180 days)
  •   Free report update in next update cycle
    (Feb 2023 - Feb 2024)
  • Five Users
  • $6,930
  • Limited to five authorized users
  • Print upto five copies
  • Available in
    PDF
  • Free industry update
    (Within 180 days)
  •   Free report update in next update cycle
    (Feb 2023 - Feb 2024)
  • Enterprise
    License/PDF

  • $10,665
  • Unlimited
    within
    company/enterprise
  • Available in Excel & PDF
  • Free industry update
    (Within 180 days)
  •   Free report update in next update cycle
    (Feb 2023 - Feb 2024)
  • Library
    Membership

  • $999 $ 1,175
    Per User/ Per month/ Billed annually
  • Published Content
    E-access
  • Company Profiles
    E-access
  • Newly Added Content Access
  • 10 PDF
    Downloads
  • 5 Excel Data
    Pack Downloads
  • 250 Company Profiles PDF Downloads
  • Buy Now

*Taxes/Fees, if applicable will be added during checkout. All prices in USD

RELATED REPORTS
 

Why Allied Market Research?


Infallible Methodology

To ensure high-level data integrity, accurate analysis, and impeccable forecasts

Analyst Support

For complete satisfaction

Customization

On-demand customization of scope of the report to exactly meet your needs

TARGETED MARKET VIEW

Targeted market view to provide pertinent information and save time of readers

Get fresh content delivered

Get insights on topics that are crucial for your business. Stay abreast of your interest areas.

Get Industry Data Alerts

Why Allied Market Research?

Infallible Methodology

To ensure high-level data integrity, accurate analysis, and impeccable forecasts

Analyst Support

For complete satisfaction

Customization

On-demand customization of scope of the report to exactly meet your needs

TARGETED MARKET VIEW

Targeted market view to provide pertinent information and save time of readers