
Online Smartphone and Tablet Games Market Insights:
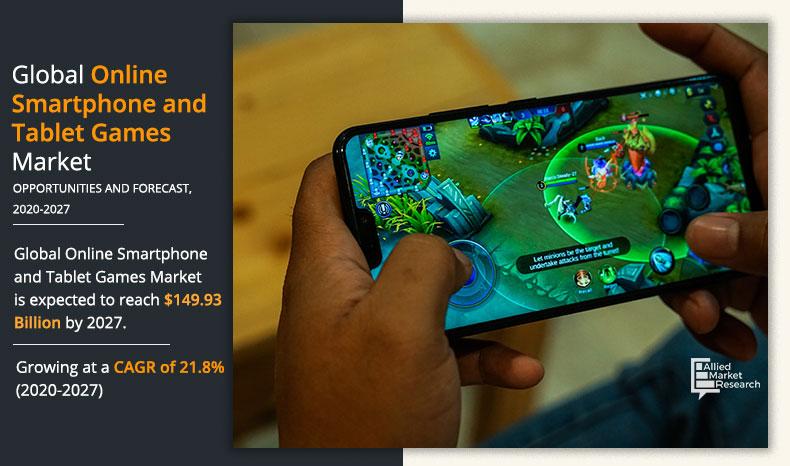
The global online smartphone and tablet games market size was valued at USD 30.49 billion in 2019, and is projected to reach USD 149.93 billion by 2027, growing at a CAGR of 21.8% from 2020 to 2027.
Online smartphone and tablet games are gaining high traction attributed to rise in addiction of games among the youth and surge in consumer awareness toward interactive entertainment systems. In addition, various smartphone game providers are introducing new gaming applications for children to enhance their concentration level and improve multitasking ability. Furthermore, companies are providing various features to end users such as encryption-based security, user-friendly interface, and chat-based customer support, which fuel the market growth.
Moreover, surge in adoption of mobile development platform across the globe and rise in adoption of free-to-play business model are the key driving forces of the global online smartphone and tablet games market. In addition, rise in penetration of smartphones and tablets across the globe notably contributes toward the growth of the market. However, increase in concerns related to security and privacy issues hampers the growth of the market. On the contrary, surge in adoption of cloud-based gaming application in various developed and emerging countries is expected to provide lucrative opportunity for the expansion of the market during the forecast period.
By operating system, the online smartphone and tablet games market was led by the android segment and is expected to grow at the highest rate during the forecast period. Surge in adoption of android-based smartphones across emerging countries fuels the growth of this segment.
Region wise, the online smartphone and tablet games market was dominated by Asia-Pacific in 2019, and is expected to witness significant growth during the forecast period, owing to rise in penetration of smartphones among end users and increase in penetration of mobile games across emerging countries of Asia-Pacific.
The report focuses on the growth prospects, restraints, and trends of global online smartphone and tablet games market analysis. The study provides Porter’s five forces analysis to understand the impact of various factors such as bargaining power of suppliers, competitive intensity of competitors, threat of new entrants, threat of substitutes, and bargaining power of buyers on global online smartphone and tablet games market.
By Operating System
Android is projected as one of the most lucrative segments.
Segment Review:
The global online smartphone and tablet games market is segmented into operating system, game type, and region. In terms of operating system, the market is fragmented into iOS, android, and others. Depending on game type, it is categorized into massive multiplayer online games, casual, social, and others. Region wise, it is analyzed across North America, Europe, Asia-Pacific, and LAMEA.
The key players profiled in the online smartphone and tablet games market analysis are Electronics Arts, Inc., Gameloft, Kabam Games, Inc., King Limited, MachineZone, Inc., Melior Games, NCSOFT Corporation, Rovio Entertainment Corporation, Supercell OY and The Walt Disney Company. These players have adopted various strategies to increase their market penetration and strengthen their position in the industry.
By Game Type
Massive Multiplayer Online Games is projected as one of the most lucrative segments.
Top Impacting Factors:
Rise in trends of cloud gaming
With the presence of large consumer base in the smartphone market, specifically in the age range of 13–20, coupled with availability of strong internet connectivity, the adoption of cloud-based gaming has increased, thereby turning the mobile-based device into a powerful gaming platform. Strong 4G network within developing and developed countries and upcoming 5G-based model coupled with their ongoing research and testing are expected to offer lucrative opportunity for the expansion of the cloud-based gaming market. Various companies such as Microsoft and Google are investing heavily in the delivery of such services by transforming their cloud service efficiently. In addition to new 5G networks, Chinese tech giant Tencent is investing heavily in its own cloud gaming service. Thus, China is anticipated serve as the potential market for online smartphone and tablet games.
Free-to-play business model emerging as a game changer
Within the last few years, the mobile gaming industry has been experiencing increase in revenue, owing to one of the striking trends, free-to-play operational model. It is estimated that around 80–85% of the revenue within the industry comes from this business model. In addition, increase in adoption of in-app purchase across various emerging countries acts as a major source of revenue flow for key players, thereby augmenting the growth of the market. For instance, out of Fortnite’s $2.4 billion of revenue, over $1 billion was generated through the sale of in-game items. With this trend on rise, majority of online games are now shifting to the free-to-play model with a focus earning higher profit margins through in-game items, thus augmenting the growth of the global market.
By Region
Asia-Pacific would exhibit the highest CAGR of 23.9% during 2020-2027.
Key Benefits for Stakeholders:
- The study provides an in-depth analysis of global online smartphone and tablet games market forecast along with the current trends and future estimations to elucidate the imminent investment pockets.
- Information about key drivers, restraints, and opportunities and their impact analysis on global market is provided in the report.
- Porter’s five forces analysis illustrates the potency of the buyers and suppliers operating in the industry.
- The quantitative analysis of the market from 2020 to 2027 is provided to determine the market potential.
Online Smartphone and Tablet Games Market Report Highlights
| Aspects | Details |
| By OPERATING SYSTEM |
|
| By GAME TYPE |
|
| By Region |
|
| Key Market Players | MACHINE ZONE, INC. (ACQUIRE BY APPLOVIN), ROVIO ENTERTAINMENT CORPORATION, SUPERCELL OY, KING LTD. (ACQUIRED BY ACTIVISION), KABAM GAMES, INC. (ACQUIRED BY NETMARBLE GAMES), THE WALT DISNEY COMPANY, GAMELOFT, NCSOFT CORPORATION, MELIOR GAMES, ELECTRONICS ARTS, INC |
Analyst Review
The adoption of online smartphone and tablet games has increased over the time, owing to increase in addiction of online gaming to relieve stress and to improve social interaction. In addition, online smartphone and tablet games market is in its growing stage in Asia-Pacific, the Middle East, and Africa (MEA) as well as Latin America; therefore, OTT platforms in these regions have immense scope for expansion. Moreover, there is huge return on investment in the online smartphone and tablet games market, owing to increase in addiction of massive multiplayer games among youth across the globe. Hence, online smartphone and tablet games platform vendors continue to visualize more effectively on the need for services across all regions. Furthermore, emerging technologies and developments in the gaming industry such as introduction of cloud-based gaming platform and blockchain in gaming are expected to boost the growth of the online smartphone and tablet games market. It includes advancements massive development of new and emerging technologies.
The online smartphone and tablet games market is competitive and comprises a number of regional and global vendors competing based on factors such as cost of solutions & services, reliability, efficiency of product, and support services. The market is concentrated with major players consuming 50–60% of the share. The degree of concentration will remain the same during the forecast period. Owing to intense competition, vendors operating in the market are offering advanced media and entertainment storage solutions to improve marketing strategies of enterprises. On the other hand, increase in investment trend of companies across the gaming industry fuels the market growth.
Strengthening of economy of the developing nations such as China, India, Indonesia, and Thailand is expected to provide lucrative opportunities for the market growth. Asia-Pacific is expected to dominate the market during the forecast period. Moreover, emerging countries in Asia-Pacific and Latin America are projected to offer significant growth opportunities during the forecast period. Global players are focusing toward product development and increasing their geographical presence, owing to increase in competition among local vendors in terms of features, quality, and price. In addition, these players are adopting various business strategies to enhance their product offerings and strengthen their foothold in the market.
Loading Table Of Content...

