
Organic Acids Market Overview:
Global Organic Acids Market Size was valued at $16,837 million in 2016, and is expected to reach $29,197 million by 2023, registering a CAGR of 8.3% from 2017 to 2023. Organic acids are weak acids that do not completely dissociate in water when compared to mineral acids. Organic acids such as formic acid and lactic acid are miscible in water; however, higher molecular mass organic acids such as benzoic acid are completely insoluble in neutral form. Lactic acid and formic acid were traditionally produced by fermentation process, but development in biotechnology field and advances in chemical synthesis replaced the earlier fermentation process. Furthermore, various agro-industrial residues such as cassava bagasse, coffee husk, apple pomace, soybean, sugarcane, corn-cobs, press-mud, citric pulps, wheat bran, and kiwi fruit peel are being deployed for the production of organic acids.
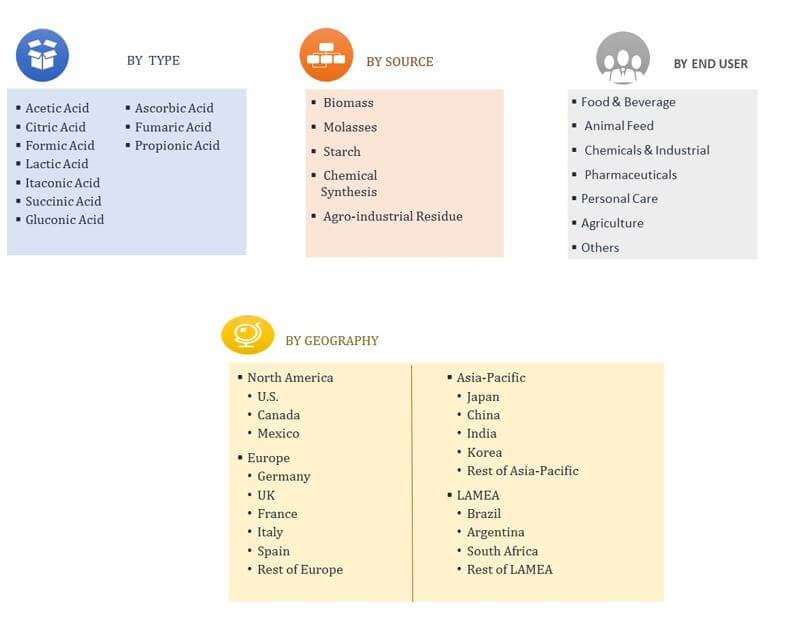
The organic acids market is segmented based on type, end-user, source, and geography. On the basis of type, the organic acids market is classified into acetic acid, citric acid, lactic acid, formic acid, itaconic acid, succinic acid, gluconic acid, ascorbic acid, fumaric acid, and propionic acid. End-users covered in the study include food & beverage, animal feed, chemical & industrial, pharmaceuticals, personal care, agriculture, and others (including additives, textiles, etc.) By Source, the market is categorized into biomass, molasses, starch, chemical synthesis, and agro-industrial residue. Geographically, the market is analyzed across North-America, Europe, Asia-Pacific, and LAMEA.
Market Segmentation
Development of food & beverage industry in Asia-Pacific fuels the demand for organic acids in this region. Moreover, rise in demand for organic acids in healthcare sector, increase in population and GDP growth are the major factors that drive the demand for organic acids. However, production of synthetic organic acids using nonrenewable sources (simultaneous fermentation and product recovery) poses hazardous threats to the environment, which has led to implementation of stringent regulations over their use, thus restraining the market growth. Increase in R&D to produce efficient organic acids market from bio-based sources is anticipated to offer lucrative growth opportunity in the market.
The global organic acids market offers various opportunities to the market players, owing to rise in disposable incomes and rapid growth in the global economy. Organic acids are being widely utilized in petrochemical industry majorly in the production of intermediates and end-use petrochemical products. Moreover, growth of pharmaceutical industry is another factor that supplements the growth of the market. However, stringent regulations on synthetic production of organic acids in North America and Europe hinders the organic acids market growth.
The global organic acids market witnesses notable growth in the developing countries such as China and India owing to less enforcement of regulations on manufacturing and trade in these countries. Therefore, food & beverage industry players deploy organic acids market in their products on large scale. Moreover, Asia-Pacific and LAMEA witness high adoption of acetic acid in pharmaceutical products and food & beverage products owing to set up of new production facilities. However, rise in cost of organic acid is expected to hinder the market growth.
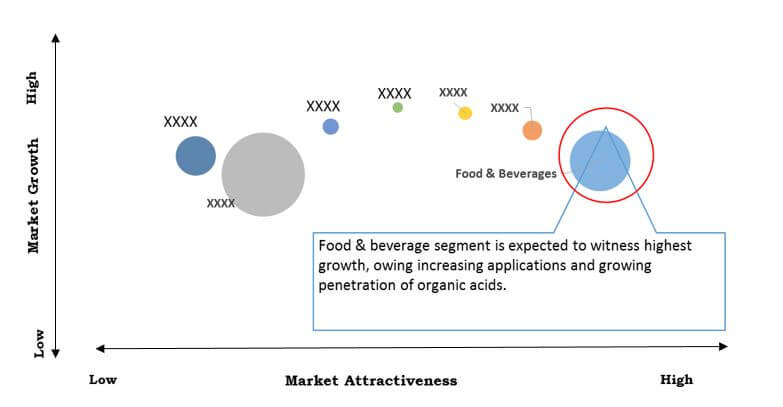
Top Investment Pockets
The food & beverage sector possesses maximum market potential owing to wide range of applications of organic acids such as preservatives, rheology modifiers, and additives. Pharmaceutical sector is another major lucrative market owing to increasing demand for organic acids in the preparation of multiple drugs such as aspirin & caffeine tablets and in sodium benzoate injections is expected to boost the market growth in the forecast period.
Top Investment Pockets
Segment Review
The chemical & industrial segment dominated the global market in 2016, and is anticipated to maintain its dominance throughout the forecast period. The agriculture segment is estimated to grow at a significant CAGR of 10.6% during the forecast period.
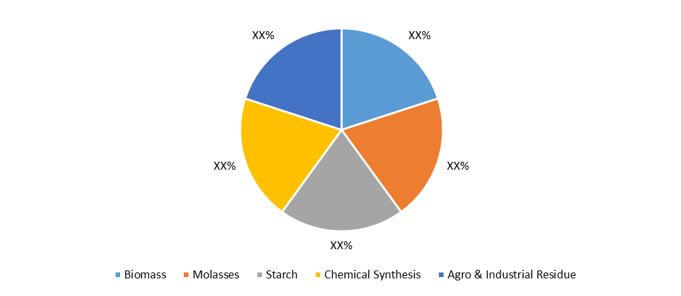
Organic Acids Market Share, By Source, 2016 (%)
Geographical Review
Asia-Pacific accounted for a considerable share of the total revenue in 2016, followed by North America and Europe.
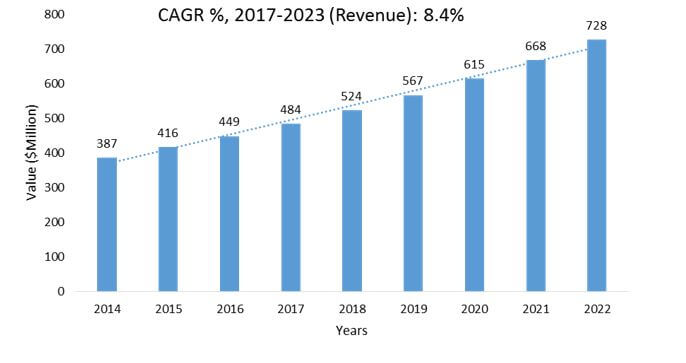
Brazil Organic Acids Market Value, 2017-2023 ($Million)
Key players such as BASF SE, Cargill, Inc., The Dow Chemical Company, Eastman Chemical Company, Myriant Corporation, Celanese Corporation, Archer Daniels Midland Company, Henan Jindan Lactic Acid Technology Co. Ltd., Tate & Lyle Plc., and E. I. Du Pont De Nemours and Company have largely invested in R&D activities to develop advanced products to cater to the requirements of the consumers.
Other players in the value chain (profiles not included in the report) include Carbion, BioAmber, Genomatica, Senvia Chemicals, Nature Works LLC, SIM Chemicals, Discovery Fine Chemicals, Synbra Technology, and Galactic.
Key Benefits for Organic Acids Market:
- Porter’s five forces analysis helps analyze the potential of buyers & suppliers and their organic acids market share for building strategies.
- It outlines the current trends and future scenario of the organic acids market size from 2016 to 2023 to understand the prevailing opportunities and potential investment pockets.
- Major countries in four major regions, namely, North America, Asia-Pacific, Europe, and LAMEA have been mapped according to their individual revenue contribution in the organic acids market analysis at regional and country level.
- The key drivers, restraints, and opportunities and their detailed impact analyses are elucidated in the study.
- The profiles of key players along with their contribution in organic acids market growth are enlisted in the report.
Organic Acids Market Report Highlights
| Aspects | Details |
| By Type |
|
| By Technology |
|
| By End User |
|
| By Geography |
|
| Key Market Players | EASTMAN CHEMICAL COMPANY, MYRIANT CORPORATION, BASF SE, TATE AND LYLE PLC., CALANESE CORPORATION, THE DOW CHEMICAL COMPANY, E.I. DUPONT DE NEMOURS AND COMPANY, HENAN JINDAN LACTIC ACID TECHNOLOGY AND CO., ARCHER DANIELS MIDLAND COMPANY |
Analyst Review
Increase in adoption of organic acids in food & beverage preservation and oil & gas well stimulation treatments fuels the growth of the global organic acids market. Organic acids are less reactive towards metals due to which these are commonly deployed at high bottom hole temperatures and during long contact durations between acid and pipe, such as during the process of perforation. Continued investments in developing countries and anticipated recovery in global markets are expected to drive the market growth.
Organic acids are increasingly gaining popularity, as these are used in manufacturing of wide range of products such as leather tannin, pharmaceutical products, and organic chemicals. In addition, rise in R&D of new technology such as micro-encapsulation for organic acid production provides growth opportunity for the market.
The Asia-Pacific organic acids market offers lucrative opportunities for key manufacturers, owing to growth in the industrial activities and rise in trend of setting up food & beverage and pharmaceutical plants in this region. Asia-Pacific is anticipated to account for nearly half of the global market by 2023, followed by North America.
Loading Table Of Content...

