0
2021
Pacemaker Market

Pacemaker Market

by Technology (Single Chamber Pacemaker, Dual Chamber Pacemaker, and Biventricular/CRT Pacemaker), Implantability (Implantable Pacemaker and External Pacemaker), and End User (Hospitals & Cardiac Centers and Ambulatory Surgical Centers): Global Opportunity Analysis and Industry Forecast, 2021--2030

Report Code: A01136
Sep 2021 | Pages: 231
Tables: 118
Charts: 32
  • Formats*:

  • pdf

    Single User License, Five User
    License & Enterprise User License

  • xls

    Data Pack Excel License

  • ppt

    It comes with the additional cost
    of $2500.00 contact sales.


COVID-19

Pandemic disrupted the entire world and affected many industries.

Get detailed COVID-19 impact analysis on the Pacemaker Market

Request Now !

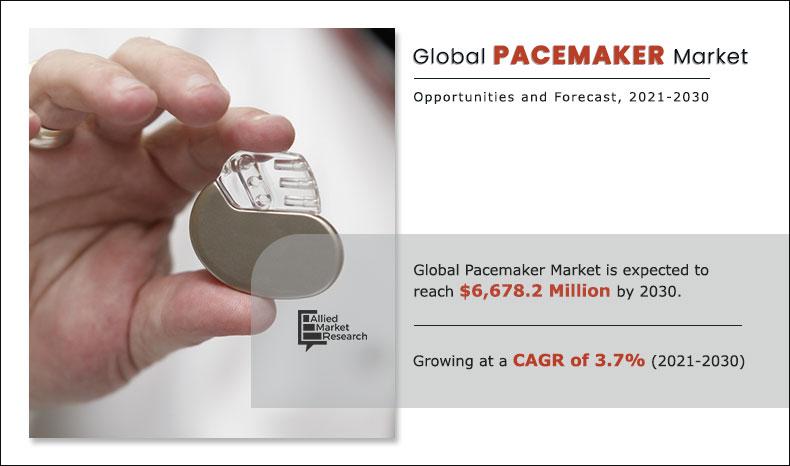
The global pacemaker market size was valued at $4,667.2 million in 2020, and is projected to reach $6,678.2 million by 2030, registering a CAGR of 3.7% from 2021 to 2030. Pacemaker is defined as the medical device, which sends small impulses to heart muscles to maintain suitable heart rate or to stimulate the lower chambers of the hearts. It is used for the treatment of syncope, congestive heart failure, and hypertrophic cardiomyopathy. The pacemaker is implanted by using a surgical procedure named as epicardial or endocardial, which is a minimal invasive process. In this procedure, the incision is made in the chest of the patient and the leads and pacemaker are inserted.

The COVID-19 outbreak is anticipated to have a negative impact on the growth of the global pacemaker market. The COVID-19 pandemic has stressed the healthcare systems in the world. A huge number of clinics and hospitals across the globe were restructured to increase the hospital capacity for patients diagnosed with COVID-19. This leads to cancellation of many nonessential surgical procedures across the world.

The growth of the global pacemaker market is majorly driven by increase in demand for minimal invasive procedure, rise in funding from private & government organizations for the healthcare sector, and rise in prevalence of cardiovascular diseases. According to Drugs & Diseases, in April 2021, it was reported that permanent pacemaker insertion technique is considered as the minimally invasive procedure. Thus, rise in demand for minimally invasive surgical procedure and increase in adoption of cardiac surgical procedure such as endocardial or epicardial for the implantation of pacemaker drive the growth of the global market. For instance, in 2020, Abbott Laboratories, an American multinational medical device and healthcare company, has spent across $2.42 billion in the R&D sector. According to the World Health Organization (WHO), in 2019, it was reported that 17 million individuals under the age of 70 died due to heart attack. In addition, surge in geriatric population is expected to fuel the market growth during the forecast period. This is attributed to the fact that aged individuals are highly vulnerable to cardiovascular diseases. Moreover, developments in pacemaker propels the growth of the market. For instance, in January 2021, Medtronic Plc., an medical device company, announced the approval of Micra AV, which is the smallest pacemaker with atrioventricular (AV) synchrony.  The micra AV is used for the treatment of patient suffer from AV block. Furthermore, a researcher at Northwestern and George Washington Universities, in 2021, in the U.S., announced the launch of first transient pacemaker, which get dissolved in the body after its use. The pacemaker is wireless, battery-free, and completely implantable pacing device, which offers temporary pacing without the need of surgical extraction. Thus, the presence of key players in healthcare medical devices, favorable government regulation for development of advanced pacemaker, and rise in incidence of hypertension propel the growth of the market.

pacemaker-market-2021-2030

In addition, development of healthcare infrastructure and increase in healthcare spending augment the demand for pacemaker, which boosts the growth of the market. For instance, in February 2021, the government has increased the healthcare spending from 1.2% to 2.5% of GDP in India, which was planned to be invested in modernization and creation of healthcare infrastructure.

However, high cost of pacemaker implantation procedure and risk associated with pacemaker such as infection at the site of surgery, pneumothorax, and bleeding are expected to restrict the market growth during the forecast period.

Pacemaker Market Segmentation

The global pacemaker market is segmented into technology, implantability, end user, and region. By technology, the market is categorized into single-chamber pacemaker, dual-chamber pacemaker, and biventricular/CRT pacemaker.

On the basis of implantability, the market is divided into implantable pacemaker and external pacemaker. Depending on end user, it is fragmented into hospitals & cardiac centers and ambulatory surgical centers.

Region-wise, the market is analyzed across North America (the U.S., Canada, and Mexico), Europe (Germany, France, the UK, Italy, Spain, and rest of Europe), Asia-Pacific (Japan, China, Australia, India, South Korea, and rest of Asia-Pacific), and LAMEA (Brazil, Saudi Arabia, South Africa, and rest of LAMEA).

Segment review

Depending on technology, the dual chamber pacemaker segment dominated the market in 2020, and is expected to continue this trend during the forecast period, owing to increase in prevalence of bradycardia, presence of key players, and rise in geriatric population. However, the biventricular segment is expected to witness considerable market growth during the forecast period, owing to increase in demand for remote monitoring services, rise in prevalence of hypertension, and surge in number of smartphone users

Pacemaker Market
By Technology

Your browser does not support the canvas element.

Dual-Chamber Pacemaker segment held a dominant position in 2020 and would continue to maintain the lead over the forecast period.

Get more information on this report : Request Sample Pages

On the basis of implantability, the implantable pacemaker segment dominated the market in 2020, and is expected to continue this trend during the forecast period, owing to increase in incidence of bradycardia, rise in demand for implantable pacemaker, and advancement in R&D activities in the healthcare sector. However, the external pacemaker segment is expected to witness considerable growth during the forecast period, owing to increase in prevalence of heart disease, rise in the geriatric population, and development of technology in the healthcare industry.

Pacemaker Market
By Implantability

Your browser does not support the canvas element.

Implantable Pacemaker segment held a dominant position in 2020 and would continue to maintain the lead over the forecast period.

Get more information on this report : Request Sample Pages

By end user, the hospital & cardiac centers segment dominated the market in 2020, and is expected to continue this trend during the forecast period, owing to increase in number of hospital & cardiac centers, rise in prevalence of cardiac diseases, and surge in number of cardiac surgical procedures. However, the ambulatory surgical centers segment is expected to witness considerable growth during the forecast period, owing to rise in prevalence of heart disease, development in ambulatory surgical centers, and initiatives taken by the government for the development of the healthcare sector.

Pacemaker Market
By End User

Your browser does not support the canvas element.

Hospital & Cardiac Centers segment is projected as one of the most lucrative segment.

Get more information on this report : Request Sample Pages

Europe accounted for a major share in the pacemaker market in 2020, and is expected to maintain its dominance during the forecast period, owing to rise in prevalence of cardiovascular diseases, such as arrhythmia, advancements in technology in diagnostic instruments, and surge in demand for minimally invasive implantation of pacemaker in the region. However, Asia-Pacific is expected to register highest CAGR of 4.1% from 2021 to 2030, owing to rise in prevalence of cardiovascular disease, increase in investment in the healthcare sector, and technological advancement in healthcare facilities for cardiac treatment & diagnosis.

Pacemaker Market
By Region

2030
Europe 
North America
Asia-Pacific
LAMEA

Europe was holding a dominant position in 2020 and would continue to maintain the lead over the analysis period.

Get more information on this report : Request Sample Pages

The key players operating in the global pacemaker market include Abbott Laboratories, BIOTRONIK, Boston Scientific Corporation, Lepu Medical, Livanova, MEDICO SpA, Medtronic, Oscor Inc., Osypka Medical GmbH, and Shree Pacetronix.

Key Benefits For Stakeholders

  • The study provides an in-depth analysis of the pacemaker market, and the current trends and future estimations to elucidate imminent investment pockets.
  • It presents a quantitative analysis of the market from 2021 to 2030 to enable stakeholders to capitalize on the prevailing market opportunities.
  • Extensive analysis of the market based on procedures and services assists to understand the trends in the pacemaker industry.
  • Key players and their strategies are thoroughly analyzed to understand the competitive outlook of the pacemaker market.

KEY MARKET SEGMENTS

By Technology

  • Single Chamber Pacemaker
  • Dual Chamber Pacemaker
  • Biventricular/CRT Pacemaker

By Implantability

  • Implantable Pacemaker
    • Hospital & Cardiac Centers
    • Ambulatory Surgical Centers
  • External Pacemaker
    • Hospital & Cardiac Centers
    • Ambulatory Surgical Centers

By End User

  • Hospitals & Cardiac Centers
  • Ambulatory Surgical Centers

By Region

  • North America
    • U.S.
    • Canada
    • Mexico
  • Europe
    • Germany
    • France
    • UK
    • Italy
    • Spain
    • Rest of Europe
  • Asia-Pacific
    • Japan
    • China
    • Australia
    • India
    • South Korea
    • Rest of Asia-Pacific
  • LAMEA
    • Brazil
    • Saudi Arabia
    • South Africa
    • Rest of LAMEA

KEY MARKET PLAYERS

  • Abbott Laboratories
  • BIOTRONIK
  • Boston Scientific Corporation
  • Lepu Medical
  • Livanova
  • MEDICO SpA
  • Medtronic
  • Oscor Inc.
  • Osypka Medical GmbH
  • Shree Pacetronix

Pacemaker Market Report Highlights

Aspects Details
By TECHNOLOGY
  • Single-chamber Pacemaker
  • Dual-chamber Pacemaker
  • Biventricular/CRT Pacemaker
By IMPLANTABILITY
  • Implantable Pacemaker
  • External Pacemaker
By END USER
  • Hospitals & Cardiac Centers
  • Ambulatory Surgical Centers
By Region
  • North America  (U.S., Canada, Mexico)
  • Europe  (France, Germany, Italy, Spain, UK, Russia, Rest of Europe)
  • Asia-Pacific  (China, Japan, India, South Korea, Australia, Thailand, Malaysia, Indonesia, Rest of Asia-Pacific)
  • LAMEA  (Brazil, South Africa, Saudi Arabia, UAE, Argentina, Rest of LAMEA)
Key Market Players Shree Pacetronix Ltd., Lepu Medical Technology (Beijing) Co., Ltd., Abbott Laboratories, Medico SpA, Livanova, plc, Boston Scientific Corporation, Medtronic plc, Biotronik SE & Co. KG, Oscor Inc., Osypka Medical GmbH
 

CHAPTER 1:INTRODUCTION
1.1.Report description
1.2.Key benefits for stakeholders
1.3.Key market segments
1.4.Research methodology
1.4.1.Secondary research
1.4.2.Primary research
1.4.3.Analyst tools and models
CHAPTER 2:EXECUTIVE SUMMARY
2.1.Key findings of the study
2.2.CXO perspective
CHAPTER 3:MARKET LANDSCAPE
3.1.Market definition and scope
3.2.Key findings
3.2.1.Top investment pockets
3.2.2.Top winning strategies
3.3.Porter’s five forces analysis
3.4.Top player positioning, 2020
3.5.Market dynamics
3.5.1.Drivers
3.5.1.1.Increase in prevalence of cardiovascular diseases and rise in geriatric population
3.5.1.2.Rise in technological advancements in pacemaker
3.5.1.3.Increase in demand for the minimally invasive procedure
3.5.1.4.Growth in development of healthcare infrastructure
3.5.2.Restraints
3.5.2.1.High cost of procedure associated with pacemaker
3.5.2.2.Risk associated with pacemaker
3.5.3.Opportunity
3.5.3.1.Increase in R&D and advancement in technology
3.5.4.Impact analysis
3.6.Impact analysis of COVID-19 on the Pacemaker  market
CHAPTER 4:PACEMAKER MARKET, BY TECHNOLOGY
4.1.Overview
4.1.1.Market size and forecast
4.2.Single-chamber Pacemaker
4.2.1.Key market trends, growth factors, and opportunities
4.2.2.Market size and forecast, by region
4.2.3.Market analysis, by country
4.3.Dual-chamber Pacemaker
4.3.1.Key market trends, growth factors, and opportunities
4.3.2.Market size and forecast, by region
4.3.3.Market analysis, by country
4.5.Biventricular/CRT Pacemaker
4.5.1.Key market trends, growth factors, and opportunities
4.5.2.Market size and forecast, by region
4.5.3.Market analysis, by country
CHAPTER 5:PACEMAKER MARKET, BY IMPLANTABILITY
5.1.Overview
5.1.1.Market size and forecast
5.2.Implantable Pacemaker
5.2.1.Key market trends, growth factors, and opportunities
5.2.2.Market size and forecast, by region
5.2.2.1.Implantable pacemaker market by end users
5.2.3.Market analysis, by country
5.3.External Pacemaker
5.3.1.Key market trends, growth factors, and opportunities
5.3.2.Market size and forecast, by region
5.3.2.1.External pacemaker market by end users
5.3.3.Market analysis, by country
CHAPTER 6:PACEMAKER MARKET, BY END USER
6.1.Overview
6.1.1.Market size and forecast
6.2.Hospitals & Cardiac Centers
6.2.1.Key market trends, growth factors, and opportunities
6.2.2.Market size and forecast, by region
6.2.3.Market analysis, by country
6.3.Ambulatory Surgical Centers
6.3.1.Key market trends, growth factors, and opportunities
6.3.2.Market size and forecast, by region
6.3.3.Market analysis, by country
CHAPTER 7:PACEMAKER  MARKET, BY REGION
7.1.Overview
7.1.1.Market size and forecast
7.2.North America
7.2.1.Key market trends, growth factors, and opportunities
7.2.2.North America  pacemaker  market, by technology
7.2.3.North America  pacemaker  market, by implantability
7.2.4.North America  pacemaker  market, by end User
7.2.5.Market size and forecast, by country
7.2.5.1.U.S.
7.2.5.1.1.U.S. pacemaker  market, by technology
7.2.5.1.2.U.S. pacemaker market, by implantability
7.2.5.1.3.U.S. pacemaker market, by end User
7.2.5.2.Canada
7.2.5.2.1.Canada pacemaker  market, by technology
7.2.5.2.2.Canada pacemaker market, by implantability
7.2.5.2.3.Canada pacemaker market, by end User
7.2.5.3.Mexico
7.2.5.3.1.Mexico pacemaker  market, by technology
7.2.5.3.2.Mexico pacemaker market, by implantability
7.2.5.3.3.Mexico pacemaker market, by end User
7.3.Europe
7.3.1.Key market trends, growth factors, and opportunities
7.3.2.Europe pacemaker  market, by technology
7.3.3.Europe pacemaker  market, by implantability
7.3.4.Europe pacemaker  market, by end User
7.3.5.Market size and forecast, by country
7.3.5.1.Germany
7.3.5.1.1.Germany pacemaker  market, by technology
7.3.5.1.2.Germany pacemaker market, by implantability
7.3.5.1.3.Germany pacemaker market, by end User
7.3.5.2.France
7.3.5.2.1.France pacemaker  market, by technology
7.3.5.2.2.France pacemaker market, by implantability
7.3.5.2.3.France pacemaker market, by end User
7.3.5.3.UK
7.3.5.3.1.UK pacemaker  market, by technology
7.3.5.3.2.UK pacemaker market, by implantability
7.3.5.3.3.UK pacemaker market, by end User
7.3.5.4.Italy
7.3.5.4.1.Italy pacemaker  market, by technology
7.3.5.4.2.Italy pacemaker market, by implantability
7.3.5.4.3.Italy pacemaker market, by end User
7.3.5.5.Spain
7.3.5.5.1.Spain pacemaker  market, by technology
7.3.5.5.2.Spain pacemaker market, by implantability
7.3.5.5.3.Spain pacemaker market, by end User
7.3.5.6.Rest of Europe
7.3.5.6.1.Rest of Europe pacemaker  market, by technology
7.3.5.6.2.Rest of Europe pacemaker market, by implantability
7.3.5.6.3.Rest of Europe pacemaker market, by end User
7.4.Asia-Pacific
7.4.1.Key market trends, growth factors, and opportunities
7.4.2.Asia-Pacific pacemaker  market, by technology
7.4.3.Asia-Pacific pacemaker  market, by implantability
7.4.4.Asia-Pacific pacemaker  market, by end User
7.4.5.Market size and forecast, by country
7.4.5.1.Japan
7.4.5.1.1.Japan pacemaker  market, by technology
7.4.5.1.2.Japan pacemaker market, by implantability
7.4.5.1.3.Japan pacemaker market, by end User
7.4.5.2.China
7.4.5.2.1.China pacemaker  market, by technology
7.4.5.2.2.China pacemaker market, by implantability
7.4.5.2.3.China pacemaker market, by end User
7.4.5.3.Australia
7.4.5.3.1.Australia pacemaker  market, by technology
7.4.5.3.2.Australia pacemaker market, by implantability
7.4.5.3.3.Australia pacemaker market, by end User
7.4.5.4.India
7.4.5.4.1.India pacemaker  market, by technology
7.4.5.4.2.India pacemaker market, by implantability
7.4.5.4.3.India pacemaker market, by end User
7.4.5.5.South Korea
7.4.5.5.1.South Korea pacemaker  market, by technology
7.4.5.5.2.South Korea pacemaker market, by implantability
7.4.5.5.3.South Korea pacemaker market, by end User
7.4.5.6.Rest of Asia-Pacific
7.4.5.6.1.Rest of Asia-Pacific pacemaker  market, by technology
7.4.5.6.2.Rest of Asia-Pacific pacemaker market, by implantability
7.4.5.6.3.Rest of Asia-Pacific pacemaker market, by end User
7.5.LAMEA
7.5.1.Key market trends, growth factors, and opportunities
7.5.2.LAMEA pacemaker  market, by technology
7.5.3.LAMEA pacemaker  market, by implantability
7.5.4.LAMEA pacemaker  market, by end User
7.5.5.Market size and forecast, by country
7.5.5.1.Brazil
7.5.5.1.1.Brazil pacemaker  market, by technology
7.5.5.1.2.Brazil pacemaker market, by implantability
7.5.5.1.3.Brazil pacemaker market, by end User
7.5.5.2.Saudi Arabia
7.5.5.2.1.Saudi Arabia pacemaker  market, by technology
7.5.5.2.2.Saudi Arabia pacemaker market, by implantability
7.5.5.2.3.Saudi Arabia pacemaker market, by end User
7.5.5.3.South Africa
7.5.5.3.1.South Africa pacemaker  market, by technology
7.5.5.3.2.South Africa pacemaker market, by implantability
7.5.5.3.3.South Africa pacemaker market, by end User
7.5.5.4.Rest of LAMEA
7.5.5.4.1.Rest of LAMEA pacemaker  market, by technology
7.5.5.4.2.Rest of LAMEA pacemaker market, by implantability
7.5.5.4.3.Rest of LAMEA pacemaker market, by end User
CHAPTER 8:COMPANY PROFILES
8.1.Abbott Laboratories
8.1.1.Company overview
8.1.2.Company snapshot
8.1.3.Operating business segments
8.1.4.Product portfolio
8.1.5.Business performance
8.1.6.Key strategic moves and developments
8.2.Biotronik SE & Co. KG
8.2.1.Company overview
8.2.2.Company snapshot
8.2.3.Operating business segments
8.2.4.Product portfolio
8.3.Boston Scientific Corporation
8.3.1.Company overview
8.3.2.Company snapshot
8.3.3.Operating business segments
8.3.4.Product portfolio
8.3.5.Business performance
8.3.6.Key strategic moves and developments
8.4.Lepu Medical Technology (Beijing) Co., Ltd.
8.4.1.Company overview
8.4.2.Company snapshot
8.4.3.Operating business segments
8.4.4.Product portfolio
8.4.5.Business performance
8.5.Livanova, plc
8.5.1.Company overview
8.5.2.Company snapshot
8.5.3.Operating business segments
8.5.4.Product portfolio
8.5.5.Business performance
8.5.6.Key strategic moves and developments
8.6.Medico SpA
8.6.1.Company overview
8.6.2.Company snapshot
8.6.3.Operating business segments
8.6.4.Product portfolio
8.7.Medtronic plc
8.7.1.Company overview
8.7.2.Company snapshot
8.7.3.Operating business segments
8.7.4.Product portfolio
8.7.5.Business performance
8.7.6.Key strategic moves and developments
8.8.Oscor Inc.
8.8.1.Company overview
8.8.2.Company snapshot
8.8.3.Operating business segments
8.8.4.Product portfolio
8.9.Osypka Medical GmbH
8.9.1.Company overview
8.9.2.Company snapshot
8.9.3.Operating business segments
8.9.4.Product portfolio
8.10.Shree Pacetronix Ltd.
8.10.1.Company overview
8.10.2.Company snapshot
8.10.3.Operating business segments
8.10.4.Product portfolio

LIST OF TABLES
TABLE 01.PACEMAKER MARKET, BY TECHNOLOGY, 2020–2030 ($MILLION)
TABLE 02.SINGLE CHAMBER PACEMAKER, BY REGION, 2020–2030 ($MILLION)
TABLE 03.DUAL CHAMBER PACEMAKER MARKET, BY REGION, 2020–2030 ($MILLION)
TABLE 04.BIVENTRICULAR/CRT PACEMAKER MARKET, BY REGION, 2020–2030 ($MILLION)
TABLE 05.GLOBAL PACEMAKER MARKET, BY IMPLANTABILITY, 2020–2030 ($MILLION)
TABLE 06.IMPLANTABLE PACEMAKER MARKET, BY REGION, 2020–2030 ($MILLION)
TABLE 07.IMPLANTABLE PACEMAKER MARKET BY END USER, 2020-2030($MILLION)
TABLE 08.EXTERNAL PACEMAKER MARKET, BY REGION, 2020–2030 ($MILLION)
TABLE 09.EXTERNAL PACEMAKER MARKET BY END USER, 2020-2030($MILLION)
TABLE 10.GLOBAL PACEMAKER MARKET, BY END USER, 2020–2030 ($MILLION)
TABLE 11.HOSPITALS AND CARDIAC CENTERS PACEMAKER MARKET, BY REGION, 2020–2030 ($MILLION)
TABLE 12.AMBULATORY SURGICAL CENTERS PACEMAKER, BY REGION, 2020–2030 ($MILLION)
TABLE 13.PACEMAKER  MARKET, BY REGION, 2020-2030 ($MILLION)
TABLE 14.NORTH AMERICA  PACEMAKER MARKET, BY TECHNOLOGY, 2020-2030 ($MILLION)
TABLE 15.NORTH AMERICA  PACEMAKER  MARKET, BY IMPLANTABILITY, 2020-2030 ($MILLION)
TABLE 16.NORTH AMERICA  PACEMAKER MARKET, BY END USER, 2020-2030 ($MILLION)
TABLE 17.NORTH AMERICA  PACEMAKER  MARKET, BY COUNTRY, 2020-2030 ($MILLION)
TABLE 18.U.S. PACEMAKER MARKET, BY TECHNOLOGY, 2020-2030 ($MILLION)
TABLE 19.U.S. PACEMAKER MARKET, BY IMPLANTABILITY, 2020-2030 ($MILLION)
TABLE 20.U.S. PACEMAKER MARKET, BY END USER, 2020-2030 ($MILLION)
TABLE 21.CANADA PACEMAKER MARKET, BY TECHNOLOGY, 2020-2030 ($MILLION)
TABLE 22.CANADA PACEMAKER MARKET, BY IMPLANTABILITY, 2020-2030 ($MILLION)
TABLE 23.CANADA PACEMAKER MARKET, BY END USER, 2020-2030 ($MILLION)
TABLE 24.MEXICO PACEMAKER MARKET, BY TECHNOLOGY, 2020-2030 ($MILLION)
TABLE 25.MEXICO PACEMAKER MARKET, BY IMPLANTABILITY, 2020-2030 ($MILLION)
TABLE 26.MEXICO PACEMAKER MARKET, BY END USER, 2020-2030 ($MILLION)
TABLE 27.EUROPE PACEMAKER MARKET, BY TECHNOLOGY, 2020-2030 ($MILLION)
TABLE 28.EUROPE PACEMAKER  MARKET, BY IMPLANTABILITY, 2020-2030 ($MILLION)
TABLE 29.EUROPE PACEMAKER MARKET, BY END USER, 2020-2030 ($MILLION)
TABLE 30.EUROPE  PACEMAKER  MARKET, BY COUNTRY, 2020-2030 ($MILLION)
TABLE 31.GERMANY PACEMAKER MARKET, BY TECHNOLOGY, 2020-2030 ($MILLION)
TABLE 32.GERMANY PACEMAKER MARKET, BY IMPLANTABILITY, 2020-2030 ($MILLION)
TABLE 33.GERMANY PACEMAKER MARKET, BY END USER, 2020-2030 ($MILLION)
TABLE 34.FRANCE PACEMAKER MARKET, BY TECHNOLOGY, 2020-2030 ($MILLION)
TABLE 35.FRANCE PACEMAKER MARKET, BY IMPLANTABILITY, 2020-2030 ($MILLION)
TABLE 36.FRANCE PACEMAKER MARKET, BY END USER, 2020-2030 ($MILLION)
TABLE 37.UK PACEMAKER MARKET, BY TECHNOLOGY, 2020-2030 ($MILLION)
TABLE 38.UK PACEMAKER MARKET, BY IMPLANTABILITY, 2020-2030 ($MILLION)
TABLE 39.UK PACEMAKER MARKET, BY END USER, 2020-2030 ($MILLION)
TABLE 40.ITALY PACEMAKER MARKET, BY TECHNOLOGY, 2020-2030 ($MILLION)
TABLE 41.ITALY PACEMAKER MARKET, BY IMPLANTABILITY, 2020-2030 ($MILLION)
TABLE 42.ITALY PACEMAKER MARKET, BY END USER, 2020-2030 ($MILLION)
TABLE 43.SPAIN PACEMAKER MARKET, BY TECHNOLOGY, 2020-2030 ($MILLION)
TABLE 44.SPAIN PACEMAKER MARKET, BY IMPLANTABILITY, 2020-2030 ($MILLION)
TABLE 45.SPAIN PACEMAKER MARKET, BY END USER, 2020-2030 ($MILLION)
TABLE 46.REST OF EUROPE PACEMAKER MARKET, BY TECHNOLOGY, 2020-2030 ($MILLION)
TABLE 47.REST OF EUROPE PACEMAKER MARKET, BY IMPLANTABILITY, 2020-2030 ($MILLION)
TABLE 48.REST OF EUROPE PACEMAKER MARKET, BY END USER, 2020-2030 ($MILLION)
TABLE 49.ASIA-PACIFIC PACEMAKER MARKET, BY TECHNOLOGY, 2020-2030 ($MILLION)
TABLE 50.ASIA-PACIFIC PACEMAKER  MARKET, BY IMPLANTABILITY, 2020-2030 ($MILLION)
TABLE 51.ASIA-PACIFIC PACEMAKER MARKET, BY END USER, 2020-2030 ($MILLION)
TABLE 52.ASIA-PACIFIC  PACEMAKER  MARKET, BY COUNTRY, 2020-2030 ($MILLION)
TABLE 53.JAPAN PACEMAKER MARKET, BY TECHNOLOGY, 2020-2030 ($MILLION)
TABLE 54.U.S. PACEMAKER MARKET, BY IMPLANTABILITY, 2020-2030 ($MILLION)
TABLE 55.JAPAN PACEMAKER MARKET, BY END USER, 2020-2030 ($MILLION)
TABLE 56.CHINA PACEMAKER MARKET, BY TECHNOLOGY, 2020-2030 ($MILLION)
TABLE 57.CHINA PACEMAKER MARKET, BY IMPLANTABILITY, 2020-2030 ($MILLION)
TABLE 58.CHINA PACEMAKER MARKET, BY END USER, 2020-2030 ($MILLION)
TABLE 59.AUSTRALIA PACEMAKER MARKET, BY TECHNOLOGY, 2020-2030 ($MILLION)
TABLE 60.AUSTRALIA PACEMAKER MARKET, BY IMPLANTABILITY, 2020-2030 ($MILLION)
TABLE 61.AUSTRALIA PACEMAKER MARKET, BY END USER, 2020-2030 ($MILLION)
TABLE 62.INDIA PACEMAKER MARKET, BY TECHNOLOGY, 2020-2030 ($MILLION)
TABLE 63.INDIA PACEMAKER MARKET, BY IMPLANTABILITY, 2020-2030 ($MILLION)
TABLE 64.INDIA PACEMAKER MARKET, BY END USER, 2020-2030 ($MILLION)
TABLE 65.SOUTH KOREA PACEMAKER MARKET, BY TECHNOLOGY, 2020-2030 ($MILLION)
TABLE 66.SOUTH KOREA PACEMAKER MARKET, BY IMPLANTABILITY, 2020-2030 ($MILLION)
TABLE 67.SOUTH KOREA PACEMAKER MARKET, BY END USER, 2020-2030 ($MILLION)
TABLE 68.REST OF ASIA-PACIFIC PACEMAKER MARKET, BY TECHNOLOGY, 2020-2030 ($MILLION)
TABLE 69.REST OF ASIA-PACIFIC PACEMAKER MARKET, BY IMPLANTABILITY, 2020-2030 ($MILLION)
TABLE 70.REST OF ASIA-PACIFIC PACEMAKER MARKET, BY END USER, 2020-2030 ($MILLION)
TABLE 71.LAMEA PACEMAKER MARKET, BY TECHNOLOGY, 2020-2030 ($MILLION)
TABLE 72.LAMEA PACEMAKER  MARKET, BY IMPLANTABILITY, 2020-2030 ($MILLION)
TABLE 73.LAMEA PACEMAKER MARKET, BY END USER, 2020-2030 ($MILLION)
TABLE 74.LAMEA  PACEMAKER  MARKET, BY COUNTRY, 2020-2030 ($MILLION)
TABLE 75.BRAZIL PACEMAKER MARKET, BY TECHNOLOGY, 2020-2030 ($MILLION)
TABLE 76.BRAZIL PACEMAKER MARKET, BY IMPLANTABILITY, 2020-2030 ($MILLION)
TABLE 77.BRAZIL PACEMAKER MARKET, BY END USER, 2020-2030 ($MILLION)
TABLE 78.SAUDI ARABIA PACEMAKER MARKET, BY TECHNOLOGY, 2020-2030 ($MILLION)
TABLE 79.SAUDI ARABIA PACEMAKER MARKET, BY IMPLANTABILITY, 2020-2030 ($MILLION)
TABLE 80.SAUDI ARABIA PACEMAKER MARKET, BY END USER, 2020-2030 ($MILLION)
TABLE 81.SOUTH AFRICA PACEMAKER MARKET, BY TECHNOLOGY, 2020-2030 ($MILLION)
TABLE 82.SOUTH AFRICA PACEMAKER MARKET, BY IMPLANTABILITY, 2020-2030 ($MILLION)
TABLE 83.SOUTH AFRICA PACEMAKER MARKET, BY END USER, 2020-2030 ($MILLION)
TABLE 84.REST OF LAMEA PACEMAKER MARKET, BY TECHNOLOGY, 2020-2030 ($MILLION)
TABLE 85.REST OF LAMEA PACEMAKER MARKET, BY IMPLANTABILITY, 2020-2030 ($MILLION)
TABLE 86.REST OF LAMEA PACEMAKER MARKET, BY END USER, 2020-2030 ($MILLION)
TABLE 87.ABBOTT: COMPANY SNAPSHOT
TABLE 88.ABBOTT: OPERATING SEGMENTS
TABLE 89.ABBOTT: PRODUCT PORTFOLIO
TABLE 90.BIOTRONIK: COMPANY SNAPSHOT
TABLE 91.BIOTRONIK: OPERATING SEGMENTS
TABLE 92.BIOTRONIK: PRODUCT PORTFOLIO
TABLE 93.BOSTON SCIENTIFIC: COMPANY SNAPSHOT
TABLE 94.BOSTON SCIENTIFIC: OERATING SEGMENT
TABLE 95.BOSTON SCIENTIFIC: PRODUCT PORTFOLIO
TABLE 96.LEPU MEDICAL: COMPANY SNAPSHOT
TABLE 97.LEPU MEDICAL: OPERATING SEGMENTS
TABLE 98.LEPU MEDICAL: PRODUCT PORTFOLIO
TABLE 99.LIVANOVA: COMPANY SNAPSHOT
TABLE 100.LIVANOVA: OERATING SEGMENT
TABLE 101.LIVANOVA: PRODUCT PORTFOLIO
TABLE 102.LIVANOVA: KEY STRATEGIC MOVES AND DEVELOPMENTS
TABLE 103.MEDICO: COMPANY SNAPSHOT
TABLE 104.MEDICO: OPERATING SEGMENTS
TABLE 105.MEDICO: PRODUCT PORTFOLIO
TABLE 106.MEDTRONIC: COMPANY SNAPSHOT
TABLE 107.MEDTRONIC: OPERATING SEGMENTS
TABLE 108.MEDTRONIC: PRODUCT PORTFOLIO
TABLE 109.MEDTRONIC: KEY STRATEGIC MOVES AND DEVELOPMENTS
TABLE 110.OSCOR: COMPANY SNAPSHOT
TABLE 111.OSCOR: OERATING SEGMENT
TABLE 112.OSCOR: PRODUCT PORTFOLIO
TABLE 113.OSYPKA MEDICAL: COMPANY SNAPSHOT
TABLE 114.OSYPKA MEDICAL: OERATING SEGMENT
TABLE 115.OSYPKA MEDICAL: PRODUCT PORTFOLIO
TABLE 116.PACETRONIX: COMPANY SNAPSHOT
TABLE 117.PACETRONIX: OERATING SEGMENT
TABLE 118.PACETRONIX: PRODUCT PORTFOLIO

LIST OF FIGURES
FIGURE 01.GLOBAL PACEMAKER MARKET SEGMENTATION
FIGURE 02.TOP INVESTMENT POCKETS
FIGURE 03.TOP WINNING STRATEGIES, BY YEAR, 2018–2021
FIGURE 04.TOP WINNING STRATEGIES, BY DEVELOPMENT, 2018–2021
FIGURE 05.TOP WINNING STRATEGIES, BY COMPANY, 2018–2021
FIGURE 06.MODERATE BARGAINING POWER OF SUPPLIERS
FIGURE 07.MODERATE BARGAINING POWER OF BUYERS
FIGURE 08.MODERATE THREAT OF SUBSTITUTES
FIGURE 09.HIGH THREAT OF NEW ENTRANTS
FIGURE 10.MODERATE INTENSITY OF RIVALRY
FIGURE 11.TOP PLAYER POSITIONING, 2020
FIGURE 12.IMPACT ANALYSIS
FIGURE 13.COMPARATIVE ANALYSIS OF SINGLE CHAMBER PACEMAKER, BY COUNTRY, 2020–2030 (%)
FIGURE 14.COMPARATIVE ANALYSIS OF DUAL CHAMBER PACEMAKER MARKET, BY COUNTRY,  2020–2030 (%)
FIGURE 15.COMPARATIVE ANALYSIS OF BIVENTRICULAR/CRT PACEMAKER MARKET, BY COUNTRY, 2020–2030 (%)
FIGURE 16.COMPARATIVE ANALYSIS OF IMPLANTABLE PACEMAKER MARKET, BY COUNTRY, 2020–2030 (%)
FIGURE 17.COMPARATIVE ANALYSIS OF EXTERNAL PACEMAKER MARKET, BY COUNTRY, 2020–2030 (%)
FIGURE 18.COMPARATIVE ANALYSIS OF HOSPITALS AND CARDIAC CENTERS PACEMAKER MARKET, BY COUNTRY, 2020–2030 (%)
FIGURE 19.COMPARATIVE ANALYSIS OF AMBULATORY SURGICAL CENTERS PACEMAKER, BY COUNTRY, 2020–2030 (%)
FIGURE 20.ABBOTT: NET SALES, 2018–2020 ($MILLION)
FIGURE 21.ABBOTT: REVENUE SHARE BY SEGMENT, 2020 (%)
FIGURE 22.ABBOTT: REVENUE SHARE BY REGION, 2020 (%)
FIGURE 23.BOSTON SCIENTIFIC: NET SALES, 2018–2020 ($MILLION)
FIGURE 24.BOSTON SCIENTIFIC: REVENUE SHARE BY SEGMENT, 2020 (%)
FIGURE 25.BOSTON SCIENTIFIC: REVENUE SHARE BY REGION, 2020 (%)
FIGURE 26.LEPU MEDICAL: NET SALES, 2016–2018 ($MILLION)
FIGURE 27.LIVANOVA: NET SALES, 2018–2020 ($MILLION)
FIGURE 28.LIVANOVA: REVENUE SHARE BY SEGMENT, 2020 (%)
FIGURE 29.LIVANOVA: REVENUE SHARE BY REGION, 2020 (%)
FIGURE 30.MEDTRONIC: NET SALES, 2019–2021 ($MILLION)
FIGURE 31.MEDTRONIC: REVENUE SHARE BY SEGMENT, 2021 (%)
FIGURE 32.MEDTRONIC: REVENUE SHARE BY REGION, 2021 (%)


Growth of the pacemaker market is attributed to factors such as technological advancements in the healthcare sector; rise in prevalence of cardiovascular diseases such as arrhythmia, heart failure, and heart attack; increase in funds from private and government organizations in various research activities; and surge in demand for minimally invasive procedure. The pacemaker market gains interest of healthcare information technology companies, owing to surge in demand for single chamber pacemaker, dual chamber pacemaker, and biventricular pacemaker. This leads to increase in adoption of pacemaker devices. Moreover, the market has gained high traction in pacemaker services by hospital & cardiac centers in recent years, as pacemaker devices are used in the management and treatment of heart disease.

Further, North America is expected to witness highest growth, in terms of revenue, owing to rise in prevalence of cardiovascular diseases, the presence of key players for development of advanced pacemaker, and technological advancement in the healthcare sector.

Asia-Pacific was the second largest contributor to the market in 2020, and is expected to register the fastest CAGR during the forecast period, owing to rise in prevalence of heart disease, increasing investment in healthcare sectors, and technological advancement in healthcare facilities for cardiac treatment and diagnosis.

In addition, high cost of pacemaker implantation procedure and risks associated with pacemaker such as infection at the site of surgery and bleeding are anticipated to restrain the market growth during the forecast period.


PURCHASE OPTIONS

Call or Email us

U.S.-Canada Toll-free: +1-800-792-5285
Int'l : +1-503-894-6022
Europe : +44-845-528-1300
Email : help@alliedmarketresearch.com
 
FREQUENTLY ASKED QUESTIONS?

A. The total market value of pacemaker market is $4,667.2 million in 2020.

A. The forecast period in the report is from 2021 to 2030

A. The market value of pacemaker Market in 2021 was $4802.5 million

A. Yes, pacemaker companies are profiled in the report

A. The top companies that hold the market share in pacemaker market are Abbott Laboratories, BIOTRONIK, Boston Scientific Corporation, Lepu Medical, Livanova, MEDICO SpA, Medtronic, Oscor Inc., Osypka Medical GmbH, and Shree Pacetronix

A. No, there is no value chain analysis provided in the pacemaker market report

A. The key trends in the pacemaker market are growth in increase in the prevalence of cardiovascular diseases, such as arrthymia, heart attack, and heart failure, rise in government initiative for development of medical device, surge in demand for minimal invasive procedure, advancement in the technology of healthcare, and rise in adoption of biventricular devices for treatment of heart failure

Looking for Customization?

 Customization Request

Have a Question?

 Speak with Analyst

Any Confusion?

 Inquire Before Buying

Have a glance of the Report

  Request Sample
RELATED TAGS

Purchase Full Report of
Pacemaker Market

Start reading instantly.
This Report and over 66,905+ more Reports, Available with Avenue Library. T&C*.

  • Online Only
  • $3,712
  • Online cloud access only
  • Restricted print, copy, paste & download
  • Read only
  • Free industry update
    (Within 180 days)
  • Free report update in next update cycle
    (Sep 2022 - Sep 2023)
  • Data Pack
  • $4,125
  • Restricted to one authorized user
  • One print only
  • Available in
    Excel
  • Free industry update
    (Within 180 days)
  •   Free report update in next update cycle
    (Sep 2022 - Sep 2023)
  • Single User
  • $5,769
  • Restricted to one authorized user
  • One print only
  • Available in
    PDF
  • Free industry update
    (Within 180 days)
  •   Free report update in next update cycle
    (Sep 2022 - Sep 2023)
  • Five Users
  • $6,929
  • Limited to five authorized users
  • Print upto five copies
  • Available in
    PDF
  • Free industry update
    (Within 180 days)
  •   Free report update in next update cycle
    (Sep 2022 - Sep 2023)
  • Enterprise
    License/PDF

  • $10,663
  • Unlimited
    within
    company/enterprise
  • Available in Excel & PDF
  • Free industry update
    (Within 180 days)
  •   Free report update in next update cycle
    (Sep 2022 - Sep 2023)
  • Library
    Membership

  • $999 $ 1,175
    Per User/ Per month/ Billed annually
  • Published Content
    E-access
  • Company Profiles
    E-access
  • Newly Added Content Access
  • 10 PDF
    Downloads
  • 5 Excel Data
    Pack Downloads
  • 250 Company Profiles PDF Downloads
  • Buy Now

*Taxes/Fees, if applicable will be added during checkout. All prices in USD

RELATED REPORTS
 

Why Allied Market Research?


Infallible Methodology

To ensure high-level data integrity, accurate analysis, and impeccable forecasts

Analyst Support

For complete satisfaction

Customization

On-demand customization of scope of the report to exactly meet your needs

TARGETED MARKET VIEW

Targeted market view to provide pertinent information and save time of readers

Get fresh content delivered

Get insights on topics that are crucial for your business. Stay abreast of your interest areas.

Get Industry Data Alerts

Why Allied Market Research?

Infallible Methodology

To ensure high-level data integrity, accurate analysis, and impeccable forecasts

Analyst Support

For complete satisfaction

Customization

On-demand customization of scope of the report to exactly meet your needs

TARGETED MARKET VIEW

Targeted market view to provide pertinent information and save time of readers