Report Code: A16326 | Oct 2022 | Pages: 250 | ||
Tables: 177 | Charts: 64 |
|
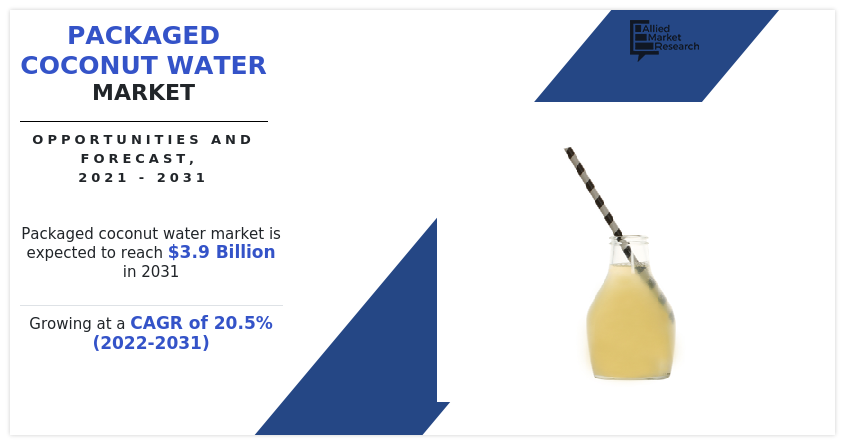
The global packaged coconut water market size was valued at $690 million in 2021, and is projected to reach $3.9 billion by 2031, growing at a CAGR of 20.5% from 2022 to 2031.
Coconut water, which is obtained from the coconut tree, is a nourishing and healthy liquid. The beverage is enriched with essential minerals, vitamins, amino acids, and electrolytes for the body. Fresh coconut water experiences increased demand due to rise in health concerns about dehydration and digestive issues. The coconut water comes in a variety of flavors, including mango, pineapple, lime, matcha tea, and others. It is a pure, sterile, sweet, and hydrating liquid that is extracted from the coconut's body. Coconut water's biochemical composition makes it the perfect hydrating and cooling beverage. The coconut tree has been referred to as the most significant and widely cultivated palm tree in the entire globe. It is a traditional medicinal as well as a tropical beverage, and because of its biochemical properties, it may be converted into wine and vinegar.
Prices for coconut water increased in 2020 as a result of the high demand and low supply caused by the closure of manufacturing facilities and disruptions in the supply chain. Manufacturing facilities for packaging materials have also been closed. Demand for coconut water has declined as a result of retail store closures. However, as more stores opened after the shutdown, demand would rise. The supply-demand disparity will progressively close since shutdown restrictions are no longer in place in many nations.
The packaged coconut water industry is expanding due to increased demand for natural sports drinks, the rise in the usage of coconut-based products in food and beverage applications, and the development of the retail industry. However, a constant decline in coconut production as contrasted to an increase in demand is limiting market expansion. On the other hand, improvements in the taste and flavor of coconut products and food and drink using coconut is projected to open up new business opportunities.
Coconut water is a perfect sports drink because of its low acidity, balanced sugar level, and isotonic mineral composition. These days, consumers prefer beverages made with natural components over those with artificial ones due to the rise in health concerns. Due to this rising demand, there is a corresponding increase in the market for packaged coconut water used as a sports beverage. In addition, packaged coconut water is slowly becoming widely accessible in a variety of retail establishments around the world. Consumers' attention is drawn to low-sugar beverages in supermarkets due to their simple and convenient availability. As a result, packaged coconut water is now more in demand. It is thought that the market's expansion will be constrained by the increase in coconut prices.
The packaged coconut water market is analyzed on the basis of type, nature, packaging, and region. By type, the market is divided into tropical and pure coconut water and mixed coconut water. Further, mixed coconut water segment is segmented into pineapple, mango, watermelon, and others. By nature, the market is divided into organic and conventional. By packaging, it is classified into plastic bottles, tetra packs, and cans. Region-wise, the market is analyzed across North America, Europe, Asia-Pacific, and LAMEA.
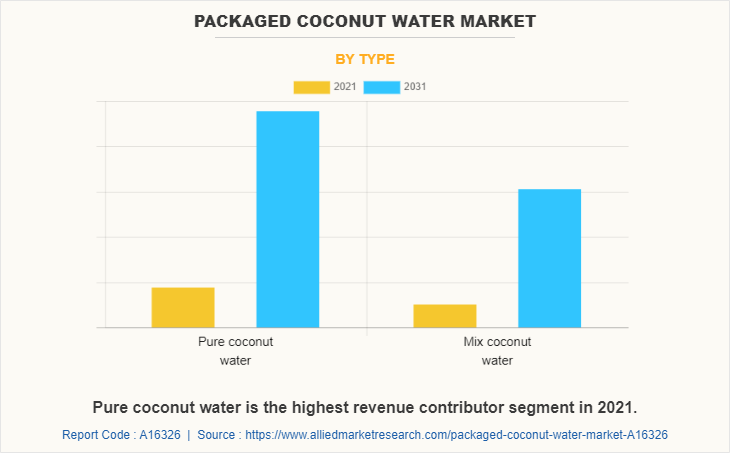
The pure coconut water segment, as per type, dominated the global medical packaged coconut water market in 2021 and is anticipated to maintain its dominance throughout the packaged coconut water market forecast period. Fitness and health are top of mind for consumers. Consumers who are active and concerned about their health now prefer natural energy drink substitutes to those that contain caffeine and sugar. Due to its nutritional qualities, including its electrolytes and nutrients, pure coconut water is becoming more and more popular as a natural sports drink.
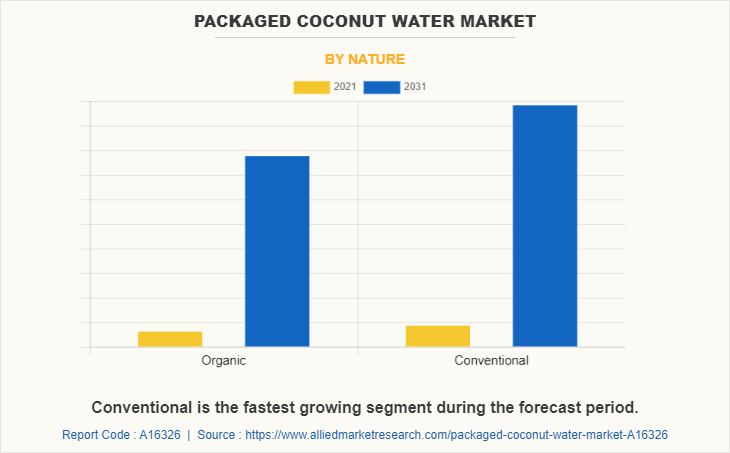
The conventional segment dominates the global packaged coconut water market. Conventionally grown coconut uses chemical fertilizers and pesticides that are helpful in fighting diseases and preventing pest infestations in the trees, thus ensuring proper growth and yield from the trees.
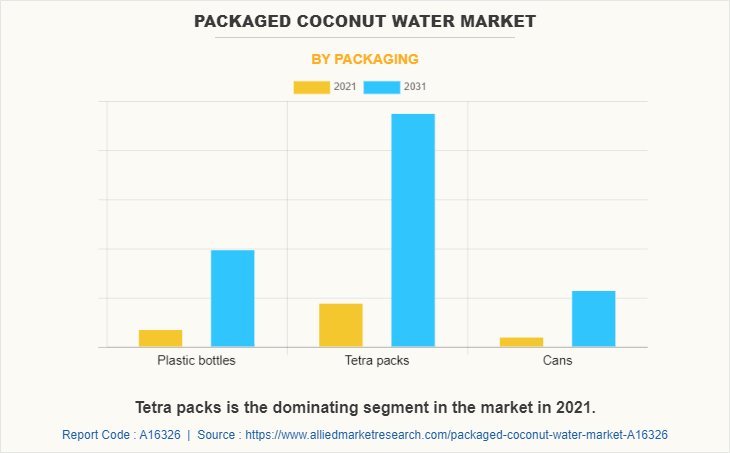
The tetra packs segment exhibits the fastest packaged coconut water market growth in the global packaged coconut water market. This packaging recyclability is one of the factors contributing to its rapid acceptance. In addition, to make it sustainable, the manufacturers have been using only FSC-certified wood. It has a good environmental profile due to its paper-based packaging, which is also incredibly simple to open and handle.
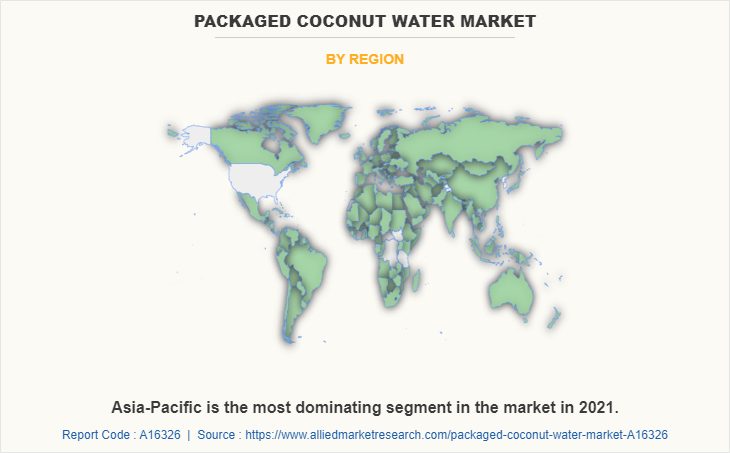
Region-wise, Asia-Pacific dominated the market with the largest packaged coconut water market share during the forecast period. Products made from coconut water are widely used in the food and beverage industries in many Asian nations. The market is expanding significantly in the region along with the increase in knowledge of coconut water as a sports or refreshment drink.
Customers are proactively focused on their health and fitness. Consumers who are active and concerned about their health now favor natural energy drink substitutes over-caffeinated and sugar-based ones. Coconut water has extremely few calories and has low levels of fats and carbohydrates. It offers a lot of antioxidants and medicinal qualities. Blood pressure, renal, and cardiovascular health are all maintained with the aid of coconut water. In addition, it aids in managing diabetes. Because coconut water has nutritional benefits like electrolytes and minerals, it is becoming increasingly popular as a natural sports drink.
Due to the rise of vegan and health-conscious consumers, the demand for beverages made from coconut has been increasing in the past. Most of the time, coconut water and coconut milk are used to make these products. Players can manufacture coconut water and milk drinks with enhanced taste and flavor, including milkshakes, energy drinks, and refreshment drinks. Drinks can have new flavors added, which results in product innovation. To improve the qualities, flavor, or nutritional value of coconut products and food and beverage items using coconut, food, and beverage firms have been investing in R&D. By increasing demand, this attracts more customers. New consumers would soon join the new flavor and taste.
Due to its rising use in the food and beverage industries, the demand for coconut products has been increasing significantly in recent years. However, despite the exponential demand, there was no rise in coconut production. In contrast, Asia, which produces more than three-fourths of the world's coconuts, has seen a modest decline in production. Due to the peak yield of coconut trees being only between the ages of 10 and 30 years, the climate conditions needed for coconut tree plantations, and the small land holdings of coconut farmers, the price of coconuts has increased significantly in the past, but producers have not increased their production capacities in response to the same. It's unlikely that the production of coconut trees will increase greatly in the near future due to the difficulty of scaling up production. Therefore, in order to make the most of their existing output and profit from this rise in demand, companies must rely on creative solutions.
The introduction of pro-coconut farming government legislation, rising investments to expand coconut cultivation, and rising labor for effective farming are presenting lucrative chances for the market's overall expansion during the forecast period. In the past, offline retailers anticipated a higher packaged coconut water market demand because they were supplying the major food needs of the urbanized population. However, in recent years, online retailers have outpaced demand and are providing discounts and making it convenient for potential customers, which is expected to encourage the expansion of the packaged coconut water market during the forecast period.
The demand for coconut water has increased globally as customers become more aware of the benefits of drinking healthy beverages. Minerals and antioxidants that the body needs are abundant in coconut water. The market for coconut cultivation is growing as a result of increased investments and pro-government legislation. Another factor boosting the market for bottled coconut water is rising urbanization in conjunction with changing dietary patterns. A significant barrier to the growth of the packaged water customer base in many countries, including the U.S. and Canada, is the high cost of coconut water. Market expansion is being hampered by the high production costs. One of the things that is challenging the market is the ambiguity around the claim made by the big companies that drinking coconut water is natural.
The major players analyzed for the packaged coconut water industry are Amy & Brian Naturals, BlueRidge, C2O Coconut Water, Celebs Coconut Corporation, CocoCoast, Elegance Brands, Inc., GraceKennedy Group, Harmless Harvest, Mojo Organics Inc., Naked Juice, NewAge Inc., PepsiCo., Taste Niravana International Inc., The Coco-Cola Company, and Wai Koko Coconut Water. Key players operating in the packaged coconut water market have adopted product launches, business expansions, and mergers & acquisitions as key strategies to expand their packaged coconut water market share, increase profitability, and remain competitive in the market.
Packaged Coconut Water Market Report Highlights
Aspects | Details |
---|---|
Market Size By 2031 | USD 3.9 billion |
Growth Rate | CAGR of 20.5% |
Forecast period | 2021 - 2031 |
Report Pages | 250 |
By Type |
|
By Nature |
|
By Packaging |
|
By Region |
|
Key Market Players | Celebes Coconut Corporation, C2o Pure Coconut Water, harmless harvest, The Coco-Cola Company, Elegance Brands Inc., Pepsico, Inc., Amy And Brian, The Naked Juice, NewAge Inc, GraceKennedy Group, Wai Koko Coconut Water, Taste Nirvana International Inc., blueridge restaurant group, CocoCoast, Mojo Organics Inc . |
CHAPTER 1:INTRODUCTION
1.1.Report description
1.2.Key benefits for stakeholders
1.3.Key market segments
1.4.Research methodology
1.4.1.Secondary research
1.4.2.Primary research
1.4.3.Analyst tools and models
CHAPTER 2:EXECUTIVE SUMMARY
2.1.Snapshot
2.2.Key findings
2.2.1.Top investment pocket
2.3.CXO perspective
CHAPTER 3:MARKET OVERVIEW
3.1.Market definition and scope
3.2.Key forces shaping global packaged coconut water industry/market
3.2.1.Bargaining power of suppliers
3.2.2.Bargaining power of buyers
3.2.3.Threat of new entrants
3.2.4.Threat of substitutes
3.2.5.Intensity of competitive rivalry
3.3.Market dynamics
3.3.1.Drivers
3.3.1.1.Increase in awareness about health benefits of coconut water
3.3.1.2.Rise in trend of flavored coconut water
3.3.1.3.Ability of the tetra packaging to protect the contents from contamination
3.3.2.Restraints
3.3.2.1.High cost of packaged coconut water
3.3.2.2.Slight decline in production of coconut relative to the increasing demand
3.3.3.Opportunities
3.3.3.1.Rise in health consciousness among consumers
3.3.3.2.Innovation in taste and flavor of coconut products and coconut-based food & beverages
3.4.COVID-19 impact analysis
3.5.Market share analysis, 2021-2031
CHAPTER 4:PACKAGED COCONUT WATER MARKET, BY TYPE
4.1.Overview
4.1.1.Market size and forecast
4.2.Pure coconut water
4.2.1.Key market trends, growth factors, and opportunities
4.2.2.Market size and forecast
4.2.3.Market analysis, by country
4.3.Mix coconut water
4.3.1.Key market trends, growth factors, and opportunities
4.3.2.Market size and forecast
4.3.2.1.Pineapple
4.3.2.2.Mango
4.3.2.3.Watermelon
4.3.2.4.Others
4.3.3.Market analysis, by country
CHAPTER 5:PACKAGED COCONUT WATER MARKET, BY NATURE
5.1.Overview
5.1.1.Market size and forecast
5.2.Organic
5.2.1.Key market trends, growth factors, and opportunities
5.2.2.Market size and forecast
5.2.3.Market analysis, by country
5.3.Conventional
5.3.1.Key market trends, growth factors, and opportunities
5.3.2.Market size and forecast
5.3.3.Market analysis, by country
CHAPTER 6:PACKAGED COCONUT WATER MARKET, BY PACKAGING
6.1.Overview
6.1.1.Market size and forecast
6.2.Plastic bottles
6.2.1.Key market trends, growth factors, and opportunities
6.2.2.Market size and forecast
6.2.3.Market analysis, by country
6.3.Tetra packs
6.3.1.Key market trends, growth factors, and opportunities
6.3.2.Market size and forecast
6.3.3.Market analysis, by country
6.4.Cans
6.4.1.Key market trends, growth factors, and opportunities
6.4.2.Market size and forecast
6.4.3.Market analysis, by country
CHAPTER 7:PACKAGED COCONUT WATER MARKET, BY REGION
7.1.Overview
7.1.1.Market size and forecast
7.2.North America
7.2.1.Key market trends, growth factors, and opportunities
7.2.2.Market size and forecast, by type
7.2.3.Market size and forecast, by nature
7.2.4.Market size and forecast, by packaging
7.2.5.Market size and forecast, by country
7.2.5.1.U.S.
7.2.5.1.1.Market size and forecast, by type
7.2.5.1.2.Market size and forecast, by nature
7.2.5.1.3.Market size and forecast, by packaging
7.2.5.2.Canada
7.2.5.2.1.Market size and forecast, by type
7.2.5.2.2.Market size and forecast, by nature
7.2.5.2.3.Market size and forecast, by packaging
7.2.5.3.Mexico
7.2.5.3.1.Market size and forecast, by type
7.2.5.3.2.Market size and forecast, by nature
7.2.5.3.3.Market size and forecast, by packaging
7.3.Europe
7.3.1.Key market trends, growth factors, and opportunities
7.3.2.Market size and forecast, by type
7.3.3.Market size and forecast, by nature
7.3.4.Market size and forecast, by packaging
7.3.5.Market size and forecast, by country
7.3.5.1.Germany
7.3.5.1.1.Market size and forecast, by type
7.3.5.1.2.Market size and forecast, by nature
7.3.5.1.3.Market size and forecast, by packaging
7.3.5.2.France
7.3.5.2.1.Market size and forecast, by type
7.3.5.2.2.Market size and forecast, by nature
7.3.5.2.3.Market size and forecast, by packaging
7.3.5.3.UK
7.3.5.3.1.Market size and forecast, by type
7.3.5.3.2.Market size and forecast, by nature
7.3.5.3.3.Market size and forecast, by packaging
7.3.5.4.Spain
7.3.5.4.1.Market size and forecast, by type
7.3.5.4.2.Market size and forecast, by nature
7.3.5.4.3.Market size and forecast, by packaging
7.3.5.5.Italy
7.3.5.5.1.Market size and forecast, by type
7.3.5.5.2.Market size and forecast, by nature
7.3.5.5.3.Market size and forecast, by packaging
7.3.5.6.Russia
7.3.5.6.1.Market size and forecast, by type
7.3.5.6.2.Market size and forecast, by nature
7.3.5.6.3.Market size and forecast, by packaging
7.3.5.7.Rest of Europe
7.3.5.7.1.Market size and forecast, by type
7.3.5.7.2.Market size and forecast, by nature
7.3.5.7.3.Market size and forecast, by packaging
7.4.Asia-Pacific
7.4.1.Key market trends, growth factors, and opportunities
7.4.2.Market size and forecast, by type
7.4.3.Market size and forecast, by nature
7.4.4.Market size and forecast, by packaging
7.4.5.Market size and forecast, by country
7.4.5.1.China
7.4.5.1.1.Market size and forecast, by type
7.4.5.1.2.Market size and forecast, by nature
7.4.5.1.3.Market size and forecast, by packaging
7.4.5.2.Japan
7.4.5.2.1.Market size and forecast, by type
7.4.5.2.2.Market size and forecast, by nature
7.4.5.2.3.Market size and forecast, by packaging
7.4.5.3.India
7.4.5.3.1.Market size and forecast, by type
7.4.5.3.2.Market size and forecast, by nature
7.4.5.3.3.Market size and forecast, by packaging
7.4.5.4.Australia
7.4.5.4.1.Market size and forecast, by type
7.4.5.4.2.Market size and forecast, by nature
7.4.5.4.3.Market size and forecast, by packaging
7.4.5.5.South Korea
7.4.5.5.1.Market size and forecast, by type
7.4.5.5.2.Market size and forecast, by nature
7.4.5.5.3.Market size and forecast, by packaging
7.4.5.6.Indonesia
7.4.5.6.1.Market size and forecast, by type
7.4.5.6.2.Market size and forecast, by nature
7.4.5.6.3.Market size and forecast, by packaging
7.4.5.7.Sri Lanka
7.4.5.7.1.Market size and forecast, by type
7.4.5.7.2.Market size and forecast, by nature
7.4.5.7.3.Market size and forecast, by packaging
7.4.5.8.Rest of Asia-Pacific
7.4.5.8.1.Market size and forecast, by type
7.4.5.8.2.Market size and forecast, by nature
7.4.5.8.3.Market size and forecast, by packaging
7.5.LAMEA
7.5.1.Key market trends, growth factors, and opportunities
7.5.2.Market size and forecast, by type
7.5.3.Market size and forecast, by nature
7.5.4.Market size and forecast, by packaging
7.5.5.Market size and forecast, by country
7.5.5.1.Brazil
7.5.5.1.1.Market size and forecast, by type
7.5.5.1.2.Market size and forecast, by nature
7.5.5.1.3.Market size and forecast, by packaging
7.5.5.2.Argentina
7.5.5.2.1.Market size and forecast, by type
7.5.5.2.2.Market size and forecast, by nature
7.5.5.2.3.Market size and forecast, by packaging
7.5.5.3.United Arab Emirates
7.5.5.3.1.Market size and forecast, by type
7.5.5.3.2.Market size and forecast, by nature
7.5.5.3.3.Market size and forecast, by packaging
7.5.5.4.Nigeria
7.5.5.4.1.Market size and forecast, by type
7.5.5.4.2.Market size and forecast, by nature
7.5.5.4.3.Market size and forecast, by packaging
7.5.5.5.Turkey
7.5.5.5.1.Market size and forecast, by type
7.5.5.5.2.Market size and forecast, by nature
7.5.5.5.3.Market size and forecast, by packaging
7.5.5.6.South Africa
7.5.5.6.1.Market size and forecast, by type
7.5.5.6.2.Market size and forecast, by nature
7.5.5.6.3.Market size and forecast, by packaging
7.5.5.7.Rest of LAMEA
7.5.5.7.1.Market size and forecast, by type
7.5.5.7.2.Market size and forecast, by nature
7.5.5.7.3.Market size and forecast, by packaging
CHAPTER 8:COMPETITION LANDSCAPE
8.1.Competitive dashboard
8.2.Competitive heat map
8.3.Product mapping
8.4.Top winning strategies
8.5.Top Player Positioning
CHAPTER 9:COMPANY PROFILES
9.1.AMY & BRIAN NATURALS
9.1.1.Company overview
9.1.2.Key executives
9.1.3.Company snapshot
9.1.4.Operating business segments
9.1.5.Product portfolio
9.2.BLUE RIDGE BEVERAGE COMPANY, INC.
9.2.1.Company overview
9.2.2.Key executives
9.2.3.Company snapshot
9.2.4.Operating business segments
9.2.5.Product portfolio
9.3.C2O PURE COCONUT WATER LLC
9.3.1.Company overview
9.3.2.Key executives
9.3.3.Company snapshot
9.3.4.Operating business segments
9.3.5.Product portfolio
9.4.CELEBES COCONUT CORPORATION
9.4.1.Company overview
9.4.2.Key executives
9.4.3.Company snapshot
9.4.4.Operating business segments
9.4.5.Product portfolio
9.5.COCOCOAST COMPANY
9.5.1.Company overview
9.5.2.Key executives
9.5.3.Company snapshot
9.5.4.Operating business segments
9.5.5.Product portfolio
9.6.ELEGANCE BRANDS, INC.
9.6.1.Company overview
9.6.2.Key executives
9.6.3.Company snapshot
9.6.4.Operating business segments
9.6.5.Product portfolio
9.7.GRACEKENNEDY GROUP
9.7.1.Company overview
9.7.2.Key executives
9.7.3.Company snapshot
9.7.4.Operating business segments
9.7.5.Product portfolio
9.7.6.Business performance
9.8.HARMLESS HARVEST
9.8.1.Company overview
9.8.2.Key executives
9.8.3.Company snapshot
9.8.4.Operating business segments
9.8.5.Product portfolio
9.8.6.Key strategic moves and developments
9.9.MOJO ORGANICS INC
9.9.1.Company overview
9.9.2.Key executives
9.9.3.Company snapshot
9.9.4.Operating business segments
9.9.5.Product portfolio
9.9.6.Key Innovations and its Impact Over the Market
9.10.NEWAGE, INC.
9.10.1.Company overview
9.10.2.Key executives
9.10.3.Company snapshot
9.10.4.Operating business segments
9.10.5.Product portfolio
9.11.PEPSICO, INC.
9.11.1.Company overview
9.11.2.Key executives
9.11.3.Company snapshot
9.11.4.Operating business segments
9.12.Product portfolio
9.12.1.Business performance
9.12.2.Key strategic moves and developments
9.13.TASTE NIRVANA INTERNATIONAL INC.
9.13.1.Company overview
9.13.2.Key executives
9.13.3.Company snapshot
9.13.4.Operating business segments
9.13.5.Product portfolio
9.13.6.Key Innovations and its Impact Over the Market
9.14.THE COCA-COLA COMPANY
9.14.1.Company overview
9.14.2.Key executives
9.14.3.Company snapshot
9.14.4.Operating business segments
9.14.5.Product portfolio
9.14.6.Business performance
9.14.7.Key strategic moves and developments
9.15.THE KROGER COMPANY
9.15.1.Company overview
9.15.2.Key Executives
9.15.3.Company snapshot
9.15.4.Product portfolio
9.15.5.Business performance
9.15.6.Key strategic moves and developments
9.16.WAI KOKO COCONUT WATER
9.16.1.Company overview
9.16.2.Key executives
9.16.3.Company snapshot
9.16.4.Operating business segments
9.16.5.Product portfolio
LIST OF TABLES
TABLE 01.GLOBAL PACKAGED COCONUT WATER MARKET BY TYPE, 2021–2031 ($MILLION)
TABLE 02.PURE PACKAGED COCONUT WATER MARKET, BY REGION, 2021–2031 ($MILLION)
TABLE 03.MIX PACKAGED COCONUT WATER MARKET, BY REGION, 2021–2031 ($MILLION)
TABLE 04.MIX PACKAGED COCONUT WATER MARKET, BY SUB-TYPE, 2021–2031 ($MILLION)
TABLE 05.PINEAPPLE MIX PACKAGED COCONUT WATER MARKET, BY REGION, 2021–2031 ($MILLION)
TABLE 06.MANGO MIX PACKAGED COCONUT WATER MARKET, BY REGION, 2021–2031 ($MILLION)
TABLE 07.WATERMELON MIX PACKAGED COCONUT WATER MARKET, BY REGION, 2021–2031 ($MILLION)
TABLE 08.OTHERS MIX PACKAGED COCONUT WATER MARKET, BY REGION, 2021–2031 ($MILLION)
TABLE 09.PACKAGED COCONUT WATER MARKET, BY NATURE, 2021–2031 ($MILLION)
TABLE 10.ORGANIC PACKAGED COCONUT WATER MARKET, BY REGION, 2021–2031 ($MILLION)
TABLE 11.CONVENTIONAL PACKAGED COCONUT WATER MARKET, BY REGION, 2021–2031 ($MILLION)
TABLE 12.PACKAGED COCONUT WATER MARKET, BY PACKAGING, 2021–2031 ($MILLION)
TABLE 13.PACKAGED COCONUT WATER MARKET FOR PLASTIC BOTTLES, BY REGION, 2021–2031 ($MILLION)
TABLE 14.PACKAGED COCONUT WATER MARKET FOR TETRA PACKS, BY REGION, 2021–2031 ($MILLION)
TABLE 15.PACKAGED COCONUT WATER MARKET FOR CANS, BY REGION, 2021–2031 ($MILLION)
TABLE 16.PACKAGED COCONUT WATER MARKET, BY REGION, 2021–2031 ($MILLION)
TABLE 17.NORTH AMERICA PACKAGED COCONUT WATER MARKET, BY TYPE, 2021–2031 ($MILLION)
TABLE 18.NORTH AMERICA MIX COCONUT WATER PACKAGED COCONUT WATER MARKET, BY SUB-TYPE, 2021–2031 ($MILLION)
TABLE 19.NORTH AMERICA PACKAGED COCONUT WATER MARKET, BY NATURE, 2021–2031 ($MILLION)
TABLE 20.NORTH AMERICA PACKAGED COCONUT WATER MARKET, BY PACKAGING, 2021–2031 ($MILLION)
TABLE 21.NORTH AMERICA PACKAGED COCONUT WATER MARKET, BY COUNTRY, 2021–2031 ($MILLION)
TABLE 22.U.S. PACKAGED COCONUT WATER MARKET, BY TYPE, 2021–2031 ($MILLION)
TABLE 23.U.S. PACKAGED COCONUT WATER MARKET, BY NATURE, 2021–2031 ($MILLION)
TABLE 24.U.S. PACKAGED COCONUT WATER MARKET, BY PACKAGING, 2021–2031 ($MILLION)
TABLE 25.CANADA PACKAGED COCONUT WATER MARKET, BY TYPE, 2021–2031 ($MILLION)
TABLE 26.CANADA PACKAGED COCONUT WATER MARKET, BY NATURE, 2021–2031 ($MILLION)
TABLE 27.CANADA PACKAGED COCONUT WATER MARKET, BY PACKAGING, 2021–2031 ($MILLION)
TABLE 28.CANADA PACKAGED COCONUT WATER MARKET, BY TYPE, 2021–2031 ($MILLION)
TABLE 29.MEXICO PACKAGED COCONUT WATER MARKET, BY NATURE, 2021–2031 ($MILLION)
TABLE 30.MEXICO PACKAGED COCONUT WATER MARKET, BY PACKAGING, 2021–2031 ($MILLION)
TABLE 31.EUROPE PACKAGED COCONUT WATER MARKET, BY TYPE, 2021–2031 ($MILLION)
TABLE 32.EUROPE MIX COCONUT WATER PACKAGED COCONUT WATER MARKET, BY SUB-TYPE, 2021–2031 ($MILLION)
TABLE 33.EUROPE PACKAGED COCONUT WATER MARKET, BY NATURE, 2021–2031 ($MILLION)
TABLE 34.EUROPE PACKAGED COCONUT WATER MARKET, BY PACKAGING, 2021–2031 ($MILLION)
TABLE 35.EUROPE PACKAGED COCONUT WATER MARKET, BY COUNTRY, 2021–2031 ($MILLION)
TABLE 36.GERMANY PACKAGED COCONUT WATER MARKET, BY TYPE, 2021–2031 ($MILLION)
TABLE 37.GERMANY PACKAGED COCONUT WATER MARKET, BY NATURE, 2021–2031 ($MILLION)
TABLE 38.GERMANY PACKAGED COCONUT WATER MARKET, BY PACKAGING, 2021–2031 ($MILLION)
TABLE 39.FRANCE PACKAGED COCONUT WATER MARKET, BY TYPE, 2021–2031 ($MILLION)
TABLE 40.FRANCE PACKAGED COCONUT WATER MARKET, BY NATURE, 2021–2031 ($MILLION)
TABLE 41.FRANCE PACKAGED COCONUT WATER MARKET, BY PACKAGING, 2021–2031 ($MILLION)
TABLE 42.UK PACKAGED COCONUT WATER MARKET, BY TYPE, 2021–2031 ($MILLION)
TABLE 43.UK PACKAGED COCONUT WATER MARKET, BY NATURE, 2021–2031 ($MILLION)
TABLE 44.UK PACKAGED COCONUT WATER MARKET, BY PACKAGING, 2021–2031 ($MILLION)
TABLE 45.SPAIN PACKAGED COCONUT WATER MARKET, BY TYPE, 2021–2031 ($MILLION)
TABLE 46.SPAIN PACKAGED COCONUT WATER MARKET, BY NATURE, 2021–2031 ($MILLION)
TABLE 47.SPAIN PACKAGED COCONUT WATER MARKET, BY PACKAGING, 2021–2031 ($MILLION)
TABLE 48.ITALY PACKAGED COCONUT WATER MARKET, BY TYPE, 2021–2031 ($MILLION)
TABLE 49.ITALY PACKAGED COCONUT WATER MARKET, BY NATURE, 2021–2031 ($MILLION)
TABLE 50.ITALY PACKAGED COCONUT WATER MARKET, BY PACKAGING, 2021–2031 ($MILLION)
TABLE 51.RUSSIA PACKAGED COCONUT WATER MARKET, BY TYPE, 2021–2031 ($MILLION)
TABLE 52.RUSSIA PACKAGED COCONUT WATER MARKET, BY NATURE, 2021–2031 ($MILLION)
TABLE 53.RUSSIA PACKAGED COCONUT WATER MARKET, BY PACKAGING, 2021–2031 ($MILLION)
TABLE 54.REST OF EUROPE PACKAGED COCONUT WATER MARKET, BY TYPE, 2021–2031 ($MILLION)
TABLE 55.REST OF EUROPE PACKAGED COCONUT WATER MARKET, BY NATURE, 2021–2031 ($MILLION)
TABLE 56.REST OF EUROPE PACKAGED COCONUT WATER MARKET, BY PACKAGING, 2021–2031 ($MILLION)
TABLE 57.ASIA-PACIFIC PACKAGED COCONUT WATER MARKET, BY TYPE, 2021–2031 ($MILLION)
TABLE 58.ASIA-PACIFIC MIX COCONUT WATER PACKAGED COCONUT WATER MARKET, BY SUB-TYPE, 2021–2031 ($MILLION)
TABLE 59.ASIA-PACIFIC PACKAGED COCONUT WATER MARKET, BY NATURE, 2021–2031 ($MILLION)
TABLE 60.ASIA-PACIFIC PACKAGED COCONUT WATER MARKET, BY PACKAGING, 2021–2031 ($MILLION)
TABLE 61.ASIA-PACIFIC PACKAGED COCONUT WATER MARKET, BY COUNTRY, 2021–2031 ($MILLION)
TABLE 62.CHINA PACKAGED COCONUT WATER MARKET, BY TYPE, 2021–2031 ($MILLION)
TABLE 63.CHINA PACKAGED COCONUT WATER MARKET, BY NATURE, 2021–2031 ($MILLION)
TABLE 64.CHINA PACKAGED COCONUT WATER MARKET, BY PACKAGING, 2021–2031 ($MILLION)
TABLE 65.JAPAN PACKAGED COCONUT WATER MARKET, BY TYPE, 2021–2031 ($MILLION)
TABLE 66.JAPAN PACKAGED COCONUT WATER MARKET, BY NATURE, 2021–2031 ($MILLION)
TABLE 67.JAPAN PACKAGED COCONUT WATER MARKET, BY PACKAGING, 2021–2031 ($MILLION)
TABLE 68.INDIA PACKAGED COCONUT WATER MARKET, BY TYPE, 2021–2031 ($MILLION)
TABLE 69.INDIA PACKAGED COCONUT WATER MARKET, BY NATURE, 2021–2031 ($MILLION)
TABLE 70.INDIA PACKAGED COCONUT WATER MARKET, BY PACKAGING, 2021–2031 ($MILLION)
TABLE 71.AUSTRALIA PACKAGED COCONUT WATER MARKET, BY TYPE, 2021–2031 ($MILLION)
TABLE 72.AUSTRALIA PACKAGED COCONUT WATER MARKET, BY NATURE, 2021–2031 ($MILLION)
TABLE 73.AUSTRALIA PACKAGED COCONUT WATER MARKET, BY PACKAGING, 2021–2031 ($MILLION)
TABLE 74.SOUTH KOREA PACKAGED COCONUT WATER MARKET, BY TYPE, 2021–2031 ($MILLION)
TABLE 75.SOUTH KOREA PACKAGED COCONUT WATER MARKET, BY NATURE, 2021–2031 ($MILLION)
TABLE 76.SOUTH KOREA PACKAGED COCONUT WATER MARKET, BY PACKAGING, 2021–2031 ($MILLION)
TABLE 77.INDONESIA PACKAGED COCONUT WATER MARKET, BY TYPE, 2021–2031 ($MILLION)
TABLE 78.INDONESIA PACKAGED COCONUT WATER MARKET, BY NATURE, 2021–2031 ($MILLION)
TABLE 79.INDONESIA PACKAGED COCONUT WATER MARKET, BY PACKAGING, 2021–2031 ($MILLION)
TABLE 80.SRI LANKA PACKAGED COCONUT WATER MARKET, BY TYPE, 2021–2031 ($MILLION)
TABLE 81.SRI LANKA PACKAGED COCONUT WATER MARKET, BY NATURE, 2021–2031 ($MILLION)
TABLE 82.SRI LANKA PACKAGED COCONUT WATER MARKET, BY PACKAGING, 2021–2031 ($MILLION)
TABLE 83.REST OF ASIA-PACIFIC PACKAGED COCONUT WATER MARKET, BY TYPE, 2021–2031 ($MILLION)
TABLE 84.REST OF ASIA-PACIFIC PACKAGED COCONUT WATER MARKET, BY NATURE, 2021–2031 ($MILLION)
TABLE 85.REST OF ASIA-PACIFIC PACKAGED COCONUT WATER MARKET, BY PACKAGING, 2021–2031 ($MILLION)
TABLE 86.LAMEA PACKAGED COCONUT WATER MARKET, BY TYPE, 2021–2031 ($MILLION)
TABLE 87.LAMEA MIX COCONUT WATER PACKAGED COCONUT WATER MARKET, BY SUB-TYPE, 2021–2031 ($MILLION)
TABLE 88.LAMEA PACKAGED COCONUT WATER MARKET, BY NATURE, 2021–2031 ($MILLION)
TABLE 89.LAMEA PACKAGED COCONUT WATER MARKET, BY PACKAGING, 2021–2031 ($MILLION)
TABLE 90.LAMEA PACKAGED COCONUT WATER MARKET, BY COUNTRY, 2021–2031 ($MILLION)
TABLE 91.BRAZIL PACKAGED COCONUT WATER MARKET, BY TYPE, 2021–2031 ($MILLION)
TABLE 92.BRAZIL PACKAGED COCONUT WATER MARKET, BY NATURE, 2021–2031 ($MILLION)
TABLE 93.BRAZIL PACKAGED COCONUT WATER MARKET, BY PACKAGING, 2021–2031 ($MILLION)
TABLE 94.ARGENTINA PACKAGED COCONUT WATER MARKET, BY TYPE, 2021–2031 ($MILLION)
TABLE 95.ARGENTINA PACKAGED COCONUT WATER MARKET, BY NATURE, 2021–2031 ($MILLION)
TABLE 96.ARGENTINA PACKAGED COCONUT WATER MARKET, BY PACKAGING, 2021–2031 ($MILLION)
TABLE 97.UNITED ARAB EMIRATES PACKAGED COCONUT WATER MARKET, BY TYPE, 2021–2031 ($MILLION)
TABLE 98.UNITED ARAB EMIRATES PACKAGED COCONUT WATER MARKET, BY END-USER, 2021–2031 ($MILLION)
TABLE 99.UNITED ARAB EMIRATES PACKAGED COCONUT WATER MARKET, BY PACKAGING, 2021–2031 ($MILLION)
TABLE 100.NIGERIA PACKAGED COCONUT WATER MARKET, BY TYPE, 2021–2031 ($MILLION)
TABLE 101.NIGERIA PACKAGED COCONUT WATER MARKET, BY END-USER, 2021–2031 ($MILLION)
TABLE 102.NIGERIA PACKAGED COCONUT WATER MARKET, BY PACKAGING, 2021–2031 ($MILLION)
TABLE 103.TURKEY PACKAGED COCONUT WATER MARKET, BY TYPE, 2021–2031 ($MILLION)
TABLE 104.TURKEY PACKAGED COCONUT WATER MARKET, BY END-USER, 2021–2031 ($MILLION)
TABLE 105.TURKEY PACKAGED COCONUT WATER MARKET, BY PACKAGING, 2021–2031 ($MILLION)
TABLE 106.SOUTH AFRICA PACKAGED COCONUT WATER MARKET, BY TYPE, 2021–2031 ($MILLION)
TABLE 107.SOUTH AFRICA PACKAGED COCONUT WATER MARKET, BY END-USER, 2021–2031 ($MILLION)
TABLE 108.SOUTH AFRICA PACKAGED COCONUT WATER MARKET, BY PACKAGING, 2021–2031 ($MILLION)
TABLE 109.REST OF LAMEA PACKAGED COCONUT WATER MARKET, BY TYPE, 2021–2031 ($MILLION)
TABLE 110.REST OF LAMEA PACKAGED COCONUT WATER MARKET, BY NATURE, 2021–2031 ($MILLION)
TABLE 111.REST OF LAMEA PACKAGED COCONUT WATER MARKET, BY PACKAGING, 2021–2031 ($MILLION)
TABLE 112.AMY & BRIAN NATURALS - KEY EXECUTIVES
TABLE 113.AMY & BRIAN NATURALS - COMPANY SNAPSHOT
TABLE 114.AMY & BRIAN NATURALS -OPERATING BUSINESS SEGMENTS
TABLE 115.AMY & BRIAN NATURALS - PRODUCT PORTFOLIO
TABLE 116.BLUE RIDGE BEVERAGE COMPANY - KEY EXECUTIVES
TABLE 117.BLUE RIDGE BEVERAGE COMPANY - COMPANY SNAPSHOT
TABLE 118.BLUE RIDGE BEVERAGE COMPANY -OPERATING BUSINESS SEGMENTS
TABLE 119.BLUE RIDGE BEVERAGE COMPANY - PRODUCT PORTFOLIO
TABLE 120.C2O COCONUT WATER - KEY EXECUTIVES
TABLE 121.C2O COCONUT WATER - COMPANY SNAPSHOT
TABLE 122.C2O COCONUT WATER -OPERATING BUSINESS SEGMENTS
TABLE 123.C2O COCONUT WATER - PRODUCT PORTFOLIO
TABLE 124.CELEBES COCONUT CORPORATION - KEY EXECUTIVES
TABLE 125.CELEBES COCONUT CORPORATION - COMPANY SNAPSHOT
TABLE 126.CELEBES COCONUT CORPORATION -OPERATING BUSINESS SEGMENTS
TABLE 127.CELEBES COCONUT CORPORATION - PRODUCT PORTFOLIO
TABLE 128.COCOCOAST - KEY EXECUTIVES
TABLE 129.COCOCOAST - COMPANY SNAPSHOT
TABLE 130.COCOCOAST -OPERATING BUSINESS SEGMENTS
TABLE 131.COCOCOAST - PRODUCT PORTFOLIO
TABLE 132.ELEGANCE BRANDS, INC. - KEY EXECUTIVES
TABLE 133.ELEGANCE BRANDS, INC. - COMPANY SNAPSHOT
TABLE 134.ELEGANCE BRANDS, INC. -OPERATING BUSINESS SEGMENTS
TABLE 135.ELEGANCE BRANDS, INC. - PRODUCT PORTFOLIO
TABLE 136.GRACEKENNEDY GROUP - KEY EXECUTIVES
TABLE 137.GRACEKENNEDY GROUP - COMPANY SNAPSHOT
TABLE 138.GRACEKENNEDY GROUP -OPERATING BUSINESS SEGMENTS
TABLE 139.GRACEKENNEDY GROUP - PRODUCT PORTFOLIO
TABLE 140.GRACEKENNEDY GROUP - NET SALES, 2019-2021, ($MILLION)
TABLE 141.HARMLESS HARVEST - KEY EXECUTIVES
TABLE 142.HARMLESS HARVEST - COMPANY SNAPSHOT
TABLE 143.HARMLESS HARVEST -OPERATING BUSINESS SEGMENTS
TABLE 144.HARMLESS HARVEST - PRODUCT PORTFOLIO
TABLE 145.HARMLESS HARVEST -KEY STRATEGIC MOVES AND DEVELOPMENTS
TABLE 146.MOJO ORGANICS INC - KEY EXECUTIVES
TABLE 147.MOJO ORGANICS INC - COMPANY SNAPSHOT
TABLE 148.MOJO ORGANICS INC -OPERATING BUSINESS SEGMENTS
TABLE 149.MOJO ORGANICS INC - PRODUCT PORTFOLIO
TABLE 150.NEWAGE, INC. - KEY EXECUTIVES
TABLE 151.NEWAGE, INC. - COMPANY SNAPSHOT
TABLE 152.NEWAGE, INC. -OPERATING BUSINESS SEGMENTS
TABLE 153.NEWAGE, INC. - PRODUCT PORTFOLIO
TABLE 154.PEPSICO - KEY EXECUTIVES
TABLE 155.PEPSICO - COMPANY SNAPSHOT
TABLE 156.PEPSICO -OPERATING BUSINESS SEGMENTS
TABLE 157.PEPSICO - PRODUCT PORTFOLIO
TABLE 158.PEPSICO - NET SALES, 2019-2021 ($MILLION)
TABLE 159.PEPSICO -KEY STRATEGIC MOVES AND DEVELOPMENTS
TABLE 160.TASTE NIRVANA INTERNATIONAL INC. - KEY EXECUTIVES
TABLE 161.TASTE NIRVANA INTERNATIONAL INC. - COMPANY SNAPSHOT
TABLE 162.TASTE NIRVANA INTERNATIONAL INC. -OPERATING BUSINESS SEGMENTS
TABLE 163.TASTE NIRVANA INTERNATIONAL INC. - PRODUCT PORTFOLIO
TABLE 164.THE COCA-COLA COMPANY - KEY EXECUTIVES
TABLE 165.THE COCA-COLA COMPANY - COMPANY SNAPSHOT
TABLE 166.THE COCA-COLA COMPANY -OPERATING BUSINESS SEGMENTS
TABLE 167.THE COCA-COLA COMPANY - PRODUCT PORTFOLIO
TABLE 168.THE COCA-COLA COMPANY - NET SALES, 2019-2021 ($MILLION)
TABLE 169.THE COCA-COLA COMPANY -KEY STRATEGIC MOVES AND DEVELOPMENTS
TABLE 170.THE KROGER COMPANY: KEY EXECUTIVES
TABLE 171.THE KROGER COMPANY: COMPANY SNAPSHOT
TABLE 172.THE KROGER COMPANY: PRODUCT PORTFOLIO
TABLE 173.THE KROGER COMPANY: NET SALES, 2019–2021 ($MILLION)
TABLE 174.WAI KOKO COCONUT WATER - KEY EXECUTIVES
TABLE 175.WAI KOKO COCONUT WATER - COMPANY SNAPSHOT
TABLE 176.WAI KOKO COCONUT WATER -OPERATING BUSINESS SEGMENTS
TABLE 177.WAI KOKO COCONUT WATER - PRODUCT PORTFOLIO
LIST OF FIGURES
FIGURE 01.KEY MARKET SEGMENTS
FIGURE 02.PACKAGED COCONUT WATER MARKET SNAPSHOT, 2021–2031
FIGURE 03.TOP INVESTMENT POCKETS
FIGURE 04.HIGH BARGAINING POWER OF SUPPLIERS
FIGURE 05.MODERATE BARGAINING POWER OF BUYERS
FIGURE 06.HIGH THREAT OF NEW ENTRANTS
FIGURE 07.HIGH THREAT OF SUBSTITUTES
FIGURE 08.MODERATE INTENSITY OF COMPETITIVE RIVALRY
FIGURE 09.PACKAGED COCONUT WATER MARKET: DRIVERS, RESTRAINTS, AND OPPORTUNITIES, 2021–2031
FIGURE 10.MARKET SHARE ANALYSIS, BY TYPE, 2021-2031
FIGURE 11.MARKET SHARE ANALYSIS, BY NATURE, 2021-2031
FIGURE 12.MARKET SHARE ANALYSIS, BY PACKAGING, 2021-2031
FIGURE 13.MARKET SHARE ANALYSIS, BY REGION, 2021-2031
FIGURE 14.PACKAGED COCONUT WATER MARKET SHARE, BY TYPE, 2022–2031
FIGURE 15.COMPARATIVE SHARE ANALYSIS OF PURE PACKAGED COCONUT WATER MARKET, BY COUNTRY, 2021 & 2031 (%)
FIGURE 16.COMPARATIVE SHARE ANALYSIS OF MIX PACKAGED COCONUT WATER MARKET, BY COUNTRY, 2021 & 2031 (%)
FIGURE 17.PACKAGED COCONUT WATER MARKET SHARE, BY NATURE, 2021–2031
FIGURE 18.COMPARATIVE SHARE ANALYSIS OF ORGANIC PACKAGED COCONUT WATER MARKET, BY COUNTRY, 2021 & 2031 (%)
FIGURE 19.COMPARATIVE SHARE ANALYSIS OF CONVENTIONAL PACKAGED COCONUT WATER MARKET, BY COUNTRY, 2021 & 2031 (%)
FIGURE 20.PACKAGED COCONUT WATER MARKET SHARE, BY PACKAGING, 2021–2031
FIGURE 21.COMPARATIVE SHARE ANALYSIS OF PACKAGED COCONUT WATER MARKET FOR PLASTIC BOTTLES, BY COUNTRY, 2021 & 2031 (%)
FIGURE 22.COMPARATIVE SHARE ANALYSIS OF PACKAGED COCONUT WATER MARKET FOR TETRA PACKS, BY COUNTRY, 2021 & 2031 (%)
FIGURE 23.COMPARATIVE SHARE ANALYSIS OF PACKAGED COCONUT WATER MARKET FOR CANS, BY COUNTRY, 2021 & 2031 (%)
FIGURE 24.PACKAGED COCONUT WATER MARKET SHARE, BY REGION, 2021–2031
FIGURE 25.U.S. PACKAGED COCONUT WATER MARKET REVENUE, 2021–2031 ($MILLION)
FIGURE 26.CANADA PACKAGED COCONUT WATER MARKET REVENUE, 2021–2031 ($MILLION)
FIGURE 27.MEXICO PACKAGED COCONUT WATER MARKET REVENUE, 2021–2031 ($MILLION)
FIGURE 28.GERMANY PACKAGED COCONUT WATER MARKET REVENUE, 2021–2031 ($MILLION)
FIGURE 29.FRANCE PACKAGED COCONUT WATER MARKET REVENUE, 2021–2031 ($MILLION)
FIGURE 30.UK PACKAGED COCONUT WATER MARKET REVENUE, 2021–2031 ($MILLION)
FIGURE 31.SPAIN PACKAGED COCONUT WATER MARKET REVENUE, 2021–2031 ($MILLION)
FIGURE 32.ITALY PACKAGED COCONUT WATER MARKET REVENUE, 2021–2031 ($MILLION)
FIGURE 33.RUSSIA PACKAGED COCONUT WATER MARKET REVENUE, 2021–2031 ($MILLION)
FIGURE 34.REST OF EUROPE PACKAGED COCONUT WATER MARKET REVENUE, 2021–2031 ($MILLION)
FIGURE 35.CHINA PACKAGED COCONUT WATER MARKET REVENUE, 2021–2031 ($MILLION)
FIGURE 36.JAPAN PACKAGED COCONUT WATER MARKET REVENUE, 2021–2031 ($MILLION)
FIGURE 37.INDIA PACKAGED COCONUT WATER MARKET REVENUE, 2021–2031 ($MILLION)
FIGURE 38.AUSTRALIA PACKAGED COCONUT WATER MARKET REVENUE, 2021–2031 ($MILLION)
FIGURE 39.SOUTH KOREA PACKAGED COCONUT WATER MARKET REVENUE, 2021–2031 ($MILLION)
FIGURE 40.INDONESIA PACKAGED COCONUT WATER MARKET REVENUE, 2021–2031 ($MILLION)
FIGURE 41.SRI LANKA PACKAGED COCONUT WATER MARKET REVENUE, 2021–2031 ($MILLION)
FIGURE 42.REST OF ASIA-PACIFIC PACKAGED COCONUT WATER MARKET REVENUE, 2021–2031 ($MILLION)
FIGURE 43.BRAZIL PACKAGED COCONUT WATER MARKET REVENUE, 2021–2031 ($MILLION)
FIGURE 44.ARGENTINA PACKAGED COCONUT WATER MARKET REVENUE, 2021–2031 ($MILLION)
FIGURE 45.UNITED ARAB EMIRATES PACKAGED COCONUT WATER MARKET REVENUE, 2021–2031 ($MILLION)
FIGURE 46.NIGERIA PACKAGED COCONUT WATER MARKET REVENUE, 2021–2031 ($MILLION)
FIGURE 47.TURKEY PACKAGED COCONUT WATER MARKET REVENUE, 2021–2031 ($MILLION)
FIGURE 48.SOUTH AFRICA PACKAGED COCONUT WATER MARKET REVENUE, 2021–2031 ($MILLION)
FIGURE 49.REST OF LAMEA PACKAGED COCONUT WATER MARKET REVENUE, 2021–2031 ($MILLION)
FIGURE 50.COMPETITIVE DASHBOARD OF TOP 15 KEY PLAYERS
FIGURE 51.COMPETITIVE HEATMAP OF TOP 15 KEY PLAYERS
FIGURE 52.PRODUCT MAPPING OF TOP 15 KEY PLAYERS
FIGURE 53.TOP WINNING STRATEGIES, BY YEAR, 2021-2022
FIGURE 54.TOP WINNING STRATEGIES, BY DEVELOPMENT, 2019–2022 (%)
FIGURE 55.TOP WINNING STRATEGIES, BY COMPANY, 2019–2022
FIGURE 56.PLAYER POSITIONING OF TOP 15 KEY PLAYERS
FIGURE 57.GRACEKENNEDY GROUP: NET SALES, 2019-2021 ($MILLION)
FIGURE 58.GRACEKENNEDY GROUP: REVENUE SHARE BY SEGMENT (%)
FIGURE 59.PEPSICO: NET SALES, 2019-2021 ($MILLION)
FIGURE 60.PEPSICO: REVENUE SHARE BY SEGMENT (%)
FIGURE 61.THE COCA-COLA COMPANY: NET SALES, 2019-2021 ($MILLION)
FIGURE 62.THE COCA-COLA COMPANY: REVENUE SHARE BY SEGMENT (%)
FIGURE 63.THE COCA-COLA COMPANY: REVENUE SHARE BY REGION (%)
FIGURE 64.THE KROGER COMPANY: NET SALES, 2019–2021 ($MILLION)
The perspectives of the leading CXOs in the packaged coconut water industry are presented in this section. The market is boosted by an increase in the demand for energy drinks and consumer preference for hydrating, light, and refreshing beverages over carbonated ones. Growth in the demand for pure coconut water from places like North America and Europe has resulted in an increase in the flow of exports of coconut water from Asian nations. The market for packaged coconut water is anticipated to expand dramatically over the next few years as a result of the growing public knowledge of the health benefits of coconut water. The market is also anticipated to develop as a result of the pure coconut water's health benefits, which include its use as a natural diuretic, dehydrator, digestive aid, and cholesterol-lowering product.
The CXOs further added that customers are proactively interested in fitness and wellness. Consumers who are active and concerned about their health now prefer natural energy drink substitutes to those that contain caffeine and sugar. Low quantities of lipids and carbohydrates and a very low caloric value are found in coconut water. It has a lot of antioxidants and healing effects. Blood pressure levels, kidney function, and cardiovascular health are all maintained by coconut water. It aids in managing diabetes as well. As a result of its nutritional qualities, including its electrolytes and nutrients, the demand for pure coconut water as a natural sports drink is rising quickly. This factor is fueling the market expansion for packaged coconut water.
A. The global packaged coconut water market size was valued at $252.3 million in 2021, and is projected to reach $1,522.9 million by 2031, registering a CAGR of 21.3% from 2022 to 2031.
A. The forecast period in the packaged coconut water market report is 2022 to 2031.
A. The base year calculated in the packaged coconut water market report is 2021.
A. The top companies analyzed for global packaged coconut water market report are Amy & Brian Naturals, BlueRidge, C2O Coconut Water, Celebs Coconut Corporation, CocoCoast, Elegance Brands, Inc., GraceKennedy Group, Harmless Harvest, Mojo Organics Inc., Naked Juice, NewAge Inc., PepsiCo., Taste Niravana International Inc., The Coco-Cola Company, and Wai Koko Coconut Water.
A. The pure coconut water segment is the most influential segment in the packaged coconut water market report.
A. Asia-Pacific holds the maximum market share of the packaged coconut water market.
A. The company profile has been selected on the basis of key developments such as partnership, product launch, merger and acquisition.
A. The market value of the packaged coconut water market in 2021 was $252.3 million.
Start reading instantly.
This Report and over 66,804+ more Reports, Available with Avenue Library. T&C*.
Enterprise
License/PDF
Library
Membership
*Taxes/Fees, if applicable will be added during checkout. All prices in USD
To ensure high-level data integrity, accurate analysis, and impeccable forecasts
For complete satisfaction
On-demand customization of scope of the report to exactly meet your needs
Targeted market view to provide pertinent information and save time of readers
Get insights on topics that are crucial for your business. Stay abreast of your interest areas.
Get Industry Data AlertsTo ensure high-level data integrity, accurate analysis, and impeccable forecasts
For complete satisfaction
On-demand customization of scope of the report to exactly meet your needs
Targeted market view to provide pertinent information and save time of readers