Packaged Soup Market by Product Type (Dried and Wet), End User (Commercial Sector and Household Sector), Packaging (Bottles, Canned and Packets), and Distribution Channel (Supermarket/Hypermarket, Online Store, Convenience Store, Food Service and Others): Global Opportunity Analysis and Industry Forecast, 2021–2027
A06974 | Pages: 244 | Sep 2020 | 1722 Views | | |
Author(s) : Priya , Roshan Deshmukh | Tables: 109 | Charts: 76 | Formats*: | |
COVID-19
Pandemic disrupted the entire world and affected many industries.
Get detailed COVID-19 impact analysis on the Packaged Soup Market
Request Now !
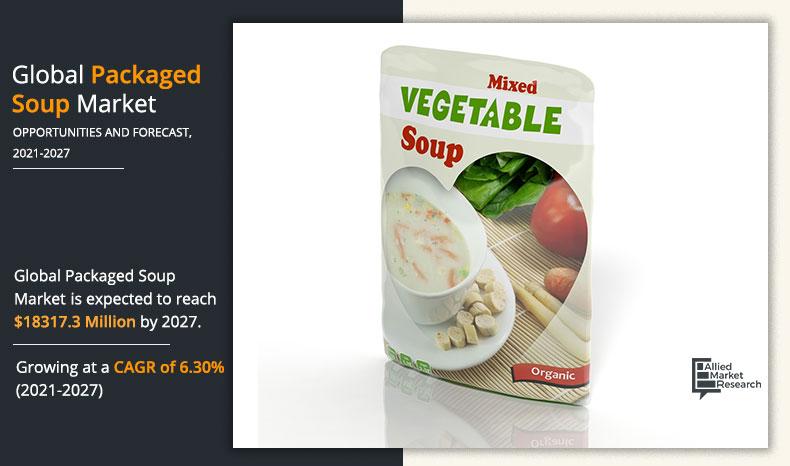
The global packaged soup market was valued at $11,758.9 million in 2019, and is projected to reach $18,317.3 million by 2027, registering a CAGR of 6.3% from 2021 to 2027.
Packaged soup falls under a category of convenience food. It is an instant soup that is designed for simple and fast preparation. It comes in flexible packaging that keeps it safe & fresh from fill through final dispensing with sterile packaging technology. The packaged soups are manufactured either on industrial or mass scale. There are wide varieties of types, flavors, and styles, of packaged soup that are available in the market through various distribution channels including online stores, supermarkets, convenience stores and others. Moreover, it comes in different packaging including cans, bottles, pouches, and cups. The packaged soup market analysis is done based on regions, key players, and segments.
Get more information on this report : Request Sample Pages
The COVID-19 pandemic has shown a positive impact on this market. This is attributed to consumers across the globe who are staying stocked with groceries including packaged food such as packaged soups. This is due to the increasing COVID-19 cases and consumers’ belief that packaged soups have a longer shelf life , are healthy and can stock it thus, restricting themselves to go out frequently. This, in turn, has increased the global demand for packaged soup, which positively impacts the packaged soup market growth globally.
The global packaged soup market is segmented into product type, end user, packaging, distribution channel, and region. By product type, the market is classified into dried and wet. By end user, it is divided into household sector and commercial sector. By packaging, it is segmented into bottles, canned and packets. Based on distribution channel, it is segregated into convenience stores, online store, supermarket/hypermarket, food service and others. Region wise, the market is analyzed across North America ( U.S., Canada, and Mexico), Europe (Germany, France, UK, Italy, Spain and rest of Europe), Asia-Pacific (China, India, Japan, Australia, Indonesia and rest of Asia-Pacific), and LAMEA (Latin America, Middle East, and Africa).
On the basis of product type, the dried segment accounted for the highest packaged soup market share in 2019. This is because dried soup does not need any refrigeration and can be prepared in a short time. It does not get oxidative and enzymatic spoilage and has flavor stability even at room temperature over a longer period (6 to 12 months approx.); thereby, making it popular among consumers globally, especially among working class, millennial, hotels, restaurants, catering and others. However, the wet segment is expected to witness a significant growth in terms of value sales during the forecast period, owing to the growing number of working population across the globe who are leading towards a busier and faster lifestyle, due to which they don’t have much time for cooking. Thus, these consumers are inclining toward ready to drink soups that can be consumed directly after buying from retail stores.
Packaged Soup Market
By Product Type
The Dried segment dominates the global Packaged Soup market and is expected to retain its dominance throughout the forecast period.
By end user, the household sector segment accounted for the highest market share in the global packaged soup market in 2019.This is attributed to the paradigm shift of consumers from homemade traditional soups to packaged soups across various demographics. This is due to the growing demand for convenience food including packaged soup in the household sectors due to their busy lifestyle especially among the working class people. Moreover, countries like China, Japan, the U.S and other countries that consume soup as a part of their daily diet and due to busy schedule are willing to spend on packaged soup. This in turn has fueled the growth of the packaged soup market through household sectors in terms of value sales.
Packaged Soup Market
By Packaging
The Packets segment dominates the global Packaged Soup market and is expected to retain its dominance throughout the forecast period.
Get more information on this report : Request Sample Pages
By packaging, the packets segment accounted for the highest share in the global packaged soup market. The packets segment includes pouch and cup. The key players in the market are using attractive and innovating pouch-based packaging designs for soup as they are very convenient and efficient. The pouches that are presently used in packaging dried soup helps in increasing the shelf life of the product and reduces the risk contamination and changes in their original taste. Moreover, the manufactures are offering packaged soup in pouch or cup as a single serve container which are high in consumer demands as they don’t need to measure. However, the canned segment is expected to witness a significant growth during the forecast period. This is because can packaging offers an increased shelf-life to soup and does not react with food material inside it that does not affect its original taste. Moreover, cans provide great flexibility due to their strong and rigid nature it maintains their original shape even at high impact, thus avoid spillover, making transportation easier. This in turn is anticipated to offer an immense opportunity for canned soup in the market in terms of values sales during the forecast period.
Packaged Soup Market
By End User
The Household Sector segment dominates the global Packaged Soup market and is expected to retain its dominance throughout the forecast period.
Get more information on this report : Request Sample Pages
By distribution channel, in 2019, the supermarket/hypermarket segment accounted for the highest market share in the global packaged soup market. Hypermarket/Supermarket is gaining high popularity owing to availability of a broad range of consumer goods under a single roof, ample parking space, and convenient operation timings. Moreover, increase in urbanization, rise in working class population and competitive pricing is boosting the popularity of supermarket/hypermarkets in the developed and developing regions. Furthermore, these stores offer variety of brands in a product category including packaged soup; thus, offering more options for the customers to buy different flavors and types of packaged soup as per their choice. Thus, these supermarket and hypermarkets have high footfalls which in turn is contributing in boosting the sales of packaged soup. This in turn has fueled the growth of the packaged soup market in terms of values sales.
Packaged Soup Market
By Distribution Channel
The Supermarket/Hypermarket segment dominates the global Packaged Soup market and is expected to retain its dominance throughout the forecast period.
Get more information on this report : Request Sample Pages
Region wise, the market is analyzed across North America, Europe, Asia-Pacific, and LAMEA. North America accounted for the highest market share in 2019. This is attributed to the growing hectic lifestyles of consumers in this region due to which they are inclining toward convenience and ready to eat food products that can be consumed directly or requires less preparation time.
Packaged Soup Market
By Region
The North America segment dominates the global Packaged Soup market and is expected to retain its dominance throughout the forecast period.
Get more information on this report : Request Sample Pages
The key players operating in the global packaged soup market focus on prominent strategies to overcome competition and maintain as well as improve their share worldwide. Some of the major players in the global packaged soup industry analyzed in this report include The Hain Celestial Group, ConAgra Inc., KETTLE CUISINE, LLC, General Mills. B&G Foods, Inc., Campbell Soup Company, Ajinomoto Co., Inc., Unilever., Nestle, and The Kraft Heinz Company.
Key Benefits For Stakeholders
- The report provides a quantitative analysis of the current packaged soup market trends, estimations, and dynamics of the market size from 2021 to 2027 to identify the prevailing opportunities.
- Porter’s five forces analysis highlights the potency of buyers and suppliers to enable stakeholders to make profit-oriented business decisions and strengthen their supplier–buyer network.
- In-depth analysis and the packaged soup market size and segmentation assists in determining the prevailing packaged soup market opportunity
- Major countries in each region have been mapped according to their revenue contribution to the global industry.
- Market player positioning facilitates benchmarking and provides a clear understanding of the present position of market players.
- The report includes the analysis of the regional as well as global market, key players, market segments, application areas, and growth strategies.
Key Market Segments
By Product type
- Dried
- Wet
By End user
- Commercial sector
- Household sector
By Packaging
- Bottles
- Canned
- Packets
By Distribution Channel
- Supermarket/Hypermarket
- Convenience store
- Online store
- Food service
- Others
By Region
- North America
- U.S.
- Canada
- Mexico
- Europe
- Germany
- France
- UK
- Italy
- Spain
- Rest of Europe
- Asia-Pacific
- China
- Japan
- India
- Australia
- Indonesia
- Rest of Asia-Pacific
- LAMEA
- Lain America
- Middle East
- Africa
CHAPTER 1:INTRODUCTION
1.1.Report description
1.2.Key benefits for stakeholders
1.3.Key market segments
1.4.Research methodology
1.4.1.Secondary research
1.4.2.Primary research
1.4.3.Analyst tools and models
CHAPTER 2:EXECUTIVE SUMMARY
2.1.Key findings of the study
2.2.CXO perspective
CHAPTER 3:MARKET OVERVIEW
3.1.Market definition and scope
3.2.Key findings
3.2.1.Top investment pockets
3.3.Porter’s five forces analysis
3.4.COVID-19 impact on packaged soup market
3.5.Market dynamics
3.5.1.Drivers
3.5.1.1.Increasing Consumer demand for convenience food globally
3.5.1.2.Rising number of quick service restaurants globally
3.5.1.3.Product innovation
3.5.2.Restraint
3.5.2.1.Hazardous effects of artificial preservatives
3.5.3.Opportunities
3.5.3.1.Rising number of consumers looking for vegan or plant-based products
3.5.3.2.Rapid growth of online retail sector
CHAPTER 4:PACKAGED SOUP MARKET, BY PRODUCT TYPE
4.1.Overview
4.1.1.Market size and forecast
4.2.Dried
4.2.1.Key market trends, growth factors, and opportunities
4.2.2.Market size and forecast
4.2.3.Market analysis by country
4.3.Wet
4.3.1.Key market trends, growth factors, and opportunities
4.3.2.Market size and forecast
4.3.3.Market analysis by country
CHAPTER 5:GLOBAL PACKAGED SOUP MARKET, BY PACKAGING
5.1.Overview
5.1.1.Market size and forecast
5.2.Bottles
5.2.1.Key market trends, growth factors, and opportunities
5.2.2.Market size and forecast
5.2.3.Market analysis by country
5.3.Canned
5.3.1.Key market trends, growth factors, and opportunities
5.3.2.Market size and forecast
5.3.3.Market analysis by country
5.4.Packets
5.4.1.Key market trends, growth factors, and opportunities
5.4.2.Market size and forecast
5.4.3.Market analysis by country
CHAPTER 6:GLOBAL PACKAGED SOUP MARKET, BY END USER
6.1.Overview
6.1.1.Market size and forecast
6.2.Commercial Sector
6.2.1.Key market trends, growth factors, and opportunities
6.2.2.Market size and forecast
6.2.3.Market analysis by country
6.3.Household Sector
6.3.1.Key market trends, growth factors, and opportunities
6.3.2.Market size and forecast
6.3.3.Market analysis by country
CHAPTER 7:GLOBAL PACKAGED SOUP MARKET, BY DISTRIBUTION CHANNEL
7.1.Overview
7.1.1.Market size and forecast
7.2.Online stores
7.2.1.Key market trends, growth factors, and opportunities
7.2.2.Market size and forecast
7.2.3.Market analysis by country
7.3.Convenience store
7.3.1.Key market trends, growth factors, and opportunities
7.3.2.Market size and forecast
7.3.3.Market analysis by country
7.4.Supermarket/Hypermarket
7.4.1.Key market trends, growth factors, and opportunities
7.4.2.Market size and forecast
7.4.3.Market analysis by country
7.5.Food Service
7.5.1.Key market trends, growth factors, and opportunities
7.5.2.Market size and forecast
7.5.3.Market analysis by country
7.6.Others
7.6.1.Key market trends, growth factors, and opportunities
7.6.2.Market size and forecast
7.6.3.Market analysis by country
CHAPTER 8:PACKAGED SOUP MARKET, BY REGION
8.1.Overview
8.1.1.Market size and forecast, by region
8.2.North America
8.2.1.Key market trends, growth factors, and opportunities
8.2.2.Market size and forecast, by product type
8.2.3.Market size and forecast, by End User
8.2.4.Market size and forecast, by Packaging
8.2.5.Market size and forecast, by Distribution channel
8.2.6.Market size and forecast, by country
8.2.6.1.U.S.
8.2.6.1.1.Market size and forecast, by product type
8.2.6.1.2.Market size and forecast, by End User
8.2.6.1.3.Market size and forecast, by Packaging
8.2.6.1.4.Market size and forecast, by Distribution channel
8.2.6.2.Mexico
8.2.6.2.1.Market size and forecast, by type
8.2.6.2.2.Market size and forecast, by End User
8.2.6.2.3.Market size and forecast, by Packaging
8.2.6.2.4.Market size and forecast, by Distribution channel
8.2.6.3.Canada
8.2.6.3.1.Market size and forecast, by type
8.2.6.3.2.Market size and forecast, by End User
8.2.6.3.3.Market size and forecast, by Packaging
8.2.6.3.4.Market size and forecast, by Distribution channel
8.3.Europe
8.3.1.Key market trends, growth factors, and opportunities
8.3.2.Market size and forecast, by product type
8.3.3.Market size and forecast, by End User
8.3.4.Market size and forecast, by Packaging
8.3.5.Market size and forecast, by Distribution channel
8.3.6.Market size and forecast, by country
8.3.6.1.Germany
8.3.6.1.1.Market size and forecast, by type
8.3.6.1.2.Market size and forecast, by End User
8.3.6.1.3.Market size and forecast, by Packaging
8.3.6.1.4.Market size and forecast, by Distribution channel
8.3.6.2.UK
8.3.6.2.1.Market size and forecast, by type
8.3.6.2.2.Market size and forecast, by End User
8.3.6.2.3.Market size and forecast, by Packaging
8.3.6.2.4.Market size and forecast, by Distribution channel
8.3.6.3.France
8.3.6.3.1.Market size and forecast, by product type
8.3.6.3.2.Market size and forecast, by End User
8.3.6.3.3.Market size and forecast, by Packaging
8.3.6.3.4.Market size and forecast, by Distribution channel
8.3.6.4.Italy
8.3.6.4.1.Market size and forecast, by product type
8.3.6.4.2.Market size and forecast, by End User
8.3.6.4.3.Market size and forecast, by Packaging
8.3.6.4.4.Market size and forecast, by Distribution channel
8.3.6.5.Spain
8.3.6.5.1.Market size and forecast, by product type
8.3.6.5.2.Market size and forecast, by End User
8.3.6.5.3.Market size and forecast, by Packaging
8.3.6.5.4.Market size and forecast, by Distribution channel
8.3.6.6.Rest of Europe
8.3.6.6.1.Market size and forecast, by type
8.3.6.6.2.Market size and forecast, by End User
8.3.6.6.3.Market size and forecast, by Packaging
8.3.6.6.4.Market size and forecast, by Distribution channel
8.4.Asia-Pacific
8.4.1.Key market trends, growth factors, and opportunities
8.4.2.Market size and forecast, by Product type
8.4.3.Market size and forecast, by End User
8.4.4.Market size and forecast, by Packaging
8.4.5.Market size and forecast, by Distribution channel
8.4.6.Market size and forecast, by country
8.4.6.1.India
8.4.6.1.1.Market size and forecast, by type
8.4.6.1.2.Market size and forecast, by End User
8.4.6.1.3.Market size and forecast, by Packaging
8.4.6.1.4.Market size and forecast, by Distribution channel
8.4.6.2.Japan
8.4.6.2.1.Market size and forecast, by product type
8.4.6.2.2.Market size and forecast, by End User
8.4.6.2.3.Market size and forecast, by Packaging
8.4.6.2.4.Market size and forecast, by Distribution channel
8.4.6.3.China
8.4.6.3.1.Market size and forecast, by product type
8.4.6.3.2.Market size and forecast, by End User
8.4.6.3.3.Market size and forecast, by Packaging
8.4.6.3.4.Market size and forecast, by Distribution channel
8.4.6.4.Indonesia
8.4.6.4.1.Market size and forecast, by type
8.4.6.4.2.Market size and forecast, by End User
8.4.6.4.3.Market size and forecast, by Packaging
8.4.6.4.4.Market size and forecast, by Distribution channel
8.4.6.5.Australia
8.4.6.5.1.Market size and forecast, by product type
8.4.6.5.2.Market size and forecast, by End User
8.4.6.5.3.Market size and forecast, by Packaging
8.4.6.5.4.Market size and forecast, by Distribution channel
8.4.6.6.Rest of Asia-Pacific
8.4.6.6.1.Market size and forecast, by product type
8.4.6.6.2.Market size and forecast, by End User
8.4.6.6.3.Market size and forecast, by Packaging
8.4.6.6.4.Market size and forecast, by Distribution channel
8.5.LAMEA
8.5.1.Key market trends, growth factors, and opportunities
8.5.2.Market size and forecast, by product type
8.5.3.Market size and forecast, by End User
8.5.4.Market size and forecast, by Packaging
8.5.5.Market size and forecast, by Distribution channel
8.5.6.Market size and forecast, by country
8.5.6.1.Latin America
8.5.6.1.1.Market size and forecast, by type
8.5.6.1.2.Market size and forecast, by End User
8.5.6.1.3.Market size and forecast, by Packaging
8.5.6.1.4.Market size and forecast, by Distribution channel
8.5.6.2.Middle East
8.5.6.2.1.Market size and forecast, by product type
8.5.6.2.2.Market size and forecast, by End User
8.5.6.2.3.Market size and forecast, by Packaging
8.5.6.2.4.Market size and forecast, by Distribution channel
8.5.6.3.Africa
8.5.6.3.1.Market size and forecast, by product type
8.5.6.3.2.Market size and forecast, by End User
8.5.6.3.3.Market size and forecast, by Packaging
8.5.6.3.4.Market size and forecast, by Distribution channel
CHAPTER 9:COMPETITION LANDSCAPE
9.1.Top winning strategies
9.2.Competitive dashboard
9.3.Competitive heatmap
9.4.Key developments
9.4.1.Business Expansion
9.4.2.Product Launch
CHAPTER 10:COMPANY PROFILES
10.1.AJINOMOTO CO., INC.,
10.1.1.Company overview
10.1.2.Key executives
10.1.3.Company snapshot
10.1.4.Operating business segments
10.1.5.Product portfolio
10.1.6.R&D Expenditure
10.1.7.Business performance
10.1.8.Key strategic moves and developments
10.2.B&G FOODS INC.
10.2.1.Company overview
10.2.2.Key executives
10.2.3.Company snapshot
10.2.4.Product portfolio
10.2.5.Business performance
10.3.CAMPBELL SOUP COMPANY
10.3.1.Company overview
10.3.2.Key executives
10.3.3.Company snapshot
10.3.4.Operating business segments
10.3.5.Product portfolio
10.3.6.R&D Expenditure
10.3.7.Business performance
10.3.8.Key strategic moves and developments
10.4.CONAGRA BRANDS, INC.
10.4.1.Company overview
10.4.2.Key executives
10.4.3.Company snapshot
10.4.4.Operating business segments
10.4.5.Product portfolio
10.4.6.R&D Expenditure
10.4.7.Business performance
10.5.GENERAL MILLS INC.
10.5.1.Company overview
10.5.2.Key Executives
10.5.3.Company snapshot
10.5.4.Operating business segments
10.5.5.Product portfolio
10.5.6.R&D Expenditure
10.5.7.Business performance
10.5.8.Key strategic moves and developments
10.6.KETTLE CUISINE, LLC,
10.6.1.Company overview
10.6.2.Company snapshot
10.6.3.Product portfolio
10.7.NESTLE S. A.
10.7.1.Company overview
10.7.2.Key Executives
10.7.3.Company snapshot
10.7.4.Operating business segments
10.7.5.Product portfolio
10.7.6.Business performance
10.7.7.Key strategic moves and developments
10.8.THE HAIN CELESTIAL GROUP
10.8.1.Company overview
10.8.2.Key Executives
10.8.3.Company snapshot
10.8.4.Product portfolio
10.8.5.R&D Expenditure
10.8.6.Business performance
10.9.THE KRAFT HEINZ COMPANY
10.9.1.Company overview
10.9.2.Key Executives
10.9.3.Company snapshot
10.9.4.Operating business segments
10.9.5.Product portfolio
10.9.6.R&D Expenditure
10.9.7.Business performance
10.9.8.Key strategic moves and developments
10.10.UNILEVER PLC
10.10.1.Company overview
10.10.2.Key Executives
10.10.3.Company snapshot
10.10.4.Operating business segments
10.10.5.Product portfolio
10.10.6.R&D Expenditure
10.10.7.Business performance
LIST OF TABLES
TABLE 01.GLOBAL PACKAGED SOUP MARKET REVENUE, BY PRODUCT TYPE, 2019-2027($MILLION)
TABLE 02.DRIED PACKAGED SOUP MARKET REVENUE, BY REGION, 2019-2027($MILLION)
TABLE 03.WET PACKAGED SOUP MARKET REVENUE, BY REGION, 2019-2027($MILLION)
TABLE 04.GLOBAL PACKAGED SOUP MARKET REVENUE, BY PACKAGING, 2019-2027($MILLION)
TABLE 05.BOTTLES PACKAGED SOUP MARKET REVENUE, BY REGION, 2019-2027($MILLION)
TABLE 06.CANNED PACKAGED SOUP MARKET REVENUE, BY REGION, 2019-2027($MILLION)
TABLE 07.PACKETS PACKAGED SOUP MARKET REVENUE, BY REGION, 2019-2027($MILLION)
TABLE 08.GLOBAL PACKAGED SOUP MARKET REVENUE, BY END USER 2019-2027($MILLION)
TABLE 09.PACKAGED SOUP MARKET REVENUE BY COMMERCIAL SECTOR, BY REGION, 2019-2027($MILLION)
TABLE 10.PACKAGED SOUP MARKET REVENUE BY HOUSEHOLD SECTOR, BY REGION, 2019-2027($MILLION)
TABLE 11.GLOBAL PACKAGED SOUP MARKET REVENUE, BY DISTRIBUTION CHANNEL 2019-2027($MILLION)
TABLE 12.PACKAGED SOUP MARKET REVENUE, BY REGION, 2019-2027($MILLION)
TABLE 13.CONVENIENCE STORE PACKAGED SOUP MARKET REVENUE, BY REGION, 2019-2027($MILLION)
TABLE 14.SUPERMARKET/HYPERMARKET PACKAGED SOUP MARKET REVENUE, BY REGION, 2019-2027($MILLION)
TABLE 15.FOOD SERVICE PACKAGED SOUP MARKET REVENUE, BY REGION, 2019-2027($MILLION)
TABLE 16.OTHERS PACKAGED SOUP MARKET REVENUE, BY REGION, 2019-2027($MILLION)
TABLE 17.PACKAGED SOUP MARKET REVENUE, BY REGION, 2019-2027($MILLION)
TABLE 18.NORTH AMERICA PACKAGED SOUP MARKET REVENUE, BY PRODUCT TYPE, 2019-2027($MILLION)
TABLE 19.NORTH AMERICA PACKAGED SOUP MARKET REVENUE, BY END USER, 2019-2027($MILLION)
TABLE 20.NORTH AMERICA PACKAGED SOUP MARKET REVENUE, BY PACKAGING, 2019-2027($MILLION)
TABLE 21.NORTH AMERICA PACKAGED SOUP MARKET REVENUE, BY DISTRIBUTION CHANNEL, 2019-2027($MILLION)
TABLE 22.NORTH AMERICA PACKAGED SOUP MARKET REVENUE, BY COUNTRY, 2019-2027($MILLION)
TABLE 23.U.S. PACKAGED SOUP MARKET REVENUE, BY PRODUCT TYPE, 2019-2027($MILLION)
TABLE 24.U.S. PACKAGED SOUP MARKET REVENUE, BY END USER, 2019-2027($MILLION)
TABLE 25.U.S. PACKAGED SOUP MARKET REVENUE, BY PACKAGING, 2019-2027($MILLION)
TABLE 26.U.S. PACKAGED SOUP MARKET REVENUE, BY DISTRIBUTION CHANNEL, 2019-2027($MILLION)
TABLE 27.MEXICO PACKAGED SOUP MARKET REVENUE, BY TYPE, 2019-2027($MILLION)
TABLE 28.MEXICO PACKAGED SOUP MARKET REVENUE, BY END USER, 2019-2027($MILLION)
TABLE 29.MEXICO PACKAGED SOUP MARKET REVENUE, BY PACKAGING, 2019-2027($MILLION)
TABLE 30.MEXICO PACKAGED SOUP MARKET REVENUE, BY DISTRIBUTION CHANNEL, 2019-2027($MILLION)
TABLE 31.CANADA PACKAGED SOUP MARKET REVENUE, BY TYPE, 2019-2027($MILLION)
TABLE 32.CANADA PACKAGED SOUP MARKET REVENUE, BY END USER, 2019-2027($MILLION)
TABLE 33.CANADA PACKAGED SOUP MARKET REVENUE, BY PACKAGING, 2019-2027($MILLION)
TABLE 34.CANADA PACKAGED SOUP MARKET REVENUE, BY DISTRIBUTION CHANNEL, 2019-2027($MILLION)
TABLE 35.EUROPE PACKAGED SOUP MARKET REVENUE, BY TYPE, 2019-2027($MILLION)
TABLE 36.EUROPE PACKAGED SOUP MARKET REVENUE, BY END USER, 2019-2027($MILLION)
TABLE 37.EUROPE PACKAGED SOUP MARKET REVENUE, BY PACKAGING, 2019-2027($MILLION)
TABLE 38.EUROPE PACKAGED SOUP MARKET REVENUE, BY DISTRIBUTION CHANNEL, 2019-2027($MILLION)
TABLE 39.EUROPE PACKAGED SOUP MARKET REVENUE, BY COUNTRY, 2019-2027($MILLION)
TABLE 40.GERMANY PACKAGED SOUP MARKET REVENUE, BY TYPE, 2019-2027($MILLION)
TABLE 41.GERMANY PACKAGED SOUP MARKET REVENUE, BY END USER, 2019-2027($MILLION)
TABLE 42.U.S. PACKAGED SOUP MARKET REVENUE, BY PACKAGING, 2019-2027($MILLION)
TABLE 43.GERMANY PACKAGED SOUP MARKET REVENUE, BY DISTRIBUTION CHANNEL, 2019-2027($MILLION)
TABLE 44.UK PACKAGED SOUP MARKET REVENUE, BY TYPE, 2019-2027($MILLION)
TABLE 45.UK PACKAGED SOUP MARKET REVENUE, BY END USER, 2019-2027($MILLION)
TABLE 46.U.S. PACKAGED SOUP MARKET REVENUE, BY PACKAGING, 2019-2027($MILLION)
TABLE 47.UK PACKAGED SOUP MARKET REVENUE, BY DISTRIBUTION CHANNEL, 2019-2027($MILLION)
TABLE 48.FRANCE PACKAGED SOUP MARKET REVENUE, BY PRODUCT TYPE, 2019-2027($MILLION)
TABLE 49.FRANCE PACKAGED SOUP MARKET REVENUE, BY END USER, 2019-2027($MILLION)
TABLE 50.FRANCE PACKAGED SOUP MARKET REVENUE, BY PACKAGING, 2019-2027($MILLION)
TABLE 51.FRANCE PACKAGED SOUP MARKET REVENUE, BY DISTRIBUTION CHANNEL, 2019-2027($MILLION)
TABLE 52.ITALY PACKAGED SOUP MARKET REVENUE, BY PRODUCT TYPE, 2019-2027($MILLION)
TABLE 53.ITALY PACKAGED SOUP MARKET REVENUE, BY END USER, 2019-2027($MILLION)
TABLE 54.ITALY PACKAGED SOUP MARKET REVENUE, BY PACKAGING, 2019-2027($MILLION)
TABLE 55.ITALY PACKAGED SOUP MARKET REVENUE, BY DISTRIBUTION CHANNEL, 2019-2027($MILLION)
TABLE 56.SPAIN PACKAGED SOUP MARKET REVENUE, BY PRODUCT TYPE, 2019-2027($MILLION)
TABLE 57.SPAIN PACKAGED SOUP MARKET REVENUE, BY END USER, 2019-2027($MILLION)
TABLE 58.SPAIN PACKAGED SOUP MARKET REVENUE, BY PACKAGING, 2019-2027($MILLION)
TABLE 59.SPAIN PACKAGED SOUP MARKET REVENUE, BY DISTRIBUTION CHANNEL, 2019-2027($MILLION)
TABLE 60.REST OF EUROPE PACKAGED SOUP MARKET REVENUE, BY TYPE, 2019-2027($MILLION)
TABLE 61.REST OF EUROPE PACKAGED SOUP MARKET REVENUE, BY END USER, 2019-2027($MILLION)
TABLE 62.REST OF EUROPE PACKAGED SOUP MARKET REVENUE, BY PACKAGING, 2019-2027($MILLION)
TABLE 63.REST OF EUROPE PACKAGED SOUP MARKET REVENUE, BY DISTRIBUTION CHANNEL, 2019-2027($MILLION)
TABLE 64.ASIA-PACIFIC PACKAGED SOUP MARKET REVENUE, BY TYPE, 2019-2027($MILLION)
TABLE 65.ASIA-PACIFIC PACKAGED SOUP MARKET REVENUE, BY END USER, 2019-2027($MILLION)
TABLE 66.NORTH AMERICA PACKAGED SOUP MARKET REVENUE, BY PACKAGING, 2019-2027($MILLION)
TABLE 67.ASIA-PACIFIC PACKAGED SOUP MARKET REVENUE, BY DISTRIBUTION CHANNEL, 2019-2027($MILLION)
TABLE 68.ASIA-PACIFIC PACKAGED SOUP MARKET REVENUE, BY COUNTRY, 2019-2027($MILLION)
TABLE 69.INDIA PACKAGED SOUP MARKET REVENUE, BY TYPE, 2019-2027($MILLION)
TABLE 70.INDIA PACKAGED SOUP MARKET REVENUE, BY END USER, 2019-2027($MILLION)
TABLE 71.INDIA PACKAGED SOUP MARKET REVENUE, BY PACKAGING, 2019-2027($MILLION)
TABLE 72.INDIA PACKAGED SOUP MARKET REVENUE, BY DISTRIBUTION CHANNEL, 2019-2027($MILLION)
TABLE 73.JAPAN PACKAGED SOUP MARKET REVENUE, BY PRODUCT TYPE, 2019-2027($MILLION)
TABLE 74.JAPAN PACKAGED SOUP MARKET REVENUE, BY END USER, 2019-2027($MILLION)
TABLE 75.U.S. PACKAGED SOUP MARKET REVENUE, BY PACKAGING, 2019-2027($MILLION)
TABLE 76.JAPAN PACKAGED SOUP MARKET REVENUE, BY DISTRIBUTION CHANNEL, 2019-2027($MILLION)
TABLE 77.CHINA PACKAGED SOUP MARKET REVENUE, BY PRODUCT TYPE, 2019-2027($MILLION)
TABLE 78.CHINA PACKAGED SOUP MARKET REVENUE, BY END USER, 2019-2027($MILLION)
TABLE 79.CHINA PACKAGED SOUP MARKET REVENUE, BY PACKAGING, 2019-2027($MILLION)
TABLE 80.CHINA PACKAGED SOUP MARKET REVENUE, BY DISTRIBUTION CHANNEL, 2019-2027($MILLION)
TABLE 81.INDONESIA PACKAGED SOUP MARKET REVENUE, BY TYPE, 2019-2027($MILLION)
TABLE 82.INDONESIA PACKAGED SOUP MARKET REVENUE, BY END USER, 2019-2027($MILLION)
TABLE 83.THE INDONESIA PACKAGED SOUP MARKET REVENUE, BY PACKAGING, 2019-2027($MILLION)
TABLE 84.INDONESIA PACKAGED SOUP MARKET REVENUE, BY DISTRIBUTION CHANNEL, 2019-2027($MILLION)
TABLE 85.AUSTRALIA PACKAGED SOUP MARKET REVENUE, BY PRODUCT TYPE, 2019-2027($MILLION)
TABLE 86.AUSTRALIA PACKAGED SOUP MARKET REVENUE, BY END USER, 2019-2027($MILLION)
TABLE 87.AUSTRALIA PACKAGED SOUP MARKET REVENUE, BY PACKAGING, 2019-2027($MILLION)
TABLE 88.AUSTRALIA PACKAGED SOUP MARKET REVENUE, BY DISTRIBUTION CHANNEL, 2019-2027($MILLION)
TABLE 89.REST OF ASIA-PACIFIC PACKAGED SOUP MARKET REVENUE, BY PRODUCT TYPE, 2019-2027($MILLION)
TABLE 90.REST OF ASIA-PACIFIC PACKAGED SOUP MARKET REVENUE, BY END USER, 2019-2027($MILLION)
TABLE 91.REST OF ASIA -PACIFIC PACKAGED SOUP MARKET REVENUE, BY PACKAGING, 2019-2027($MILLION)
TABLE 92.REST OF ASIA-PACIFIC PACKAGED SOUP MARKET REVENUE, BY DISTRIBUTION CHANNEL, 2019-2027($MILLION)
TABLE 93.LAMEA PACKAGED SOUP MARKET REVENUE, BY PRODUCT TYPE, 2019-2027($MILLION)
TABLE 94.LAMEA PACKAGED SOUP MARKET REVENUE, BY END USER, 2019-2027($MILLION)
TABLE 95.LAMEA PACKAGED SOUP MARKET REVENUE, BY PACKAGING, 2019-2027($MILLION)
TABLE 96.LAMEA PACKAGED SOUP MARKET REVENUE, BY DISTRIBUTION CHANNEL, 2019-2027($MILLION)
TABLE 97.LAMEA PACKAGED SOUP MARKET REVENUE, BY COUNTRY, 2019-2027($MILLION)
TABLE 98.LATIN AMERICA PACKAGED SOUP MARKET REVENUE, BY PRODUCT TYPE, 2019-2027($MILLION)
TABLE 99.LATIN AMERICA PACKAGED SOUP MARKET REVENUE, BY END USER, 2019-2027($MILLION)
TABLE 100.LATIN AMERICA PACKAGED SOUP MARKET REVENUE, BY PACKAGING, 2019-2027($MILLION)
TABLE 101.LATIN AMERICA PACKAGED SOUP MARKET REVENUE, BY DISTRIBUTION CHANNEL, 2019-2027($MILLION)
TABLE 102.MIDDLE EAST PACKAGED SOUP MARKET REVENUE, BY PRODUCT TYPE, 2019-2027($MILLION)
TABLE 103.MIDDLE EAST PACKAGED SOUP MARKET REVENUE, BY END USER, 2019-2027($MILLION)
TABLE 104.MIDDLE EAST PACKAGED SOUP MARKET REVENUE, BY PACKAGING, 2019-2027($MILLION)
TABLE 105.MIDDLE EAST PACKAGED SOUP MARKET REVENUE, BY DISTRIBUTION CHANNEL, 2019-2027($MILLION)
TABLE 106.AFRICA PACKAGED SOUP MARKET REVENUE, BY TYPE, 2019-2027($MILLION)
TABLE 107.AFRICA PACKAGED SOUP MARKET REVENUE, BY END USER, 2019-2027($MILLION)
TABLE 108.AFRICA PACKAGED SOUP MARKET REVENUE, BY PACKAGING, 2019-2027($MILLION)
TABLE 109.AFRICA PACKAGED SOUP MARKET REVENUE, BY DISTRIBUTION CHANNEL, 2019-2027($MILLION)
TABLE 110.AJINOMOTO CO., INC.: KEY EXECUTIVES
TABLE 111.AJINOMOTO CO, INC.: COMPANY SNAPSHOT
TABLE 112.AJINOMOTO CO, INC.: OPERATING SEGMENTS
TABLE 113.AJINOMOTO CO., INC.: PRODUCT PORTFOLIO
TABLE 114.AJINOMOTO CO., INC.: R&D EXPENDITURE, 2017–2019 ($MILLION)
TABLE 115.AJINOMOTO CO., INC.: NET SALES, 2017–2019 ($MILLION)
TABLE 116.B&G FOODS INC.: KEY EXECUTIVES
TABLE 117.B&G FOODS INC.: COMPANY SNAPSHOT
TABLE 118.B&G FOODS INC.: PRODUCT PORTFOLIO
TABLE 119.B&G FOODS INC.: NET SALES, 2017–2019 ($MILLION)
TABLE 120.CAMPBELL SOUP COMPANY: KEY EXECUTIVES
TABLE 121.CAMPBELL SOUP COMPANY: COMPANY SNAPSHOT
TABLE 122.CAMPBELL SOUP COMPANY: OPERATING SEGMENTS
TABLE 123.CAMPBELL SOUP COMPANY: PRODUCT PORTFOLIO
TABLE 124.CAMPBELL SOUP COMPANY: R&D EXPENDITURE, 2017–2019 ($MILLION)
TABLE 125.CAMPBELL SOUP COMPANY: NET SALES, 2017–2019 ($MILLION)
TABLE 126.CONAGRA BRANDS INC.: KEY EXECUTIVES
TABLE 127.CONAGRA BRANDS INC.: COMPANY SNAPSHOT
TABLE 128.UNILEVER PLC: OPERATING SEGMENTS
TABLE 129.CONAGRA BRANDS INC.: PRODUCT PORTFOLIO
TABLE 130.UNILEVER PLC: R&D EXPENDITURE, 2017–2019 ($MILLION)
TABLE 131.CONAGRA BRANDS INC.: NET SALES, 2017–2019 ($MILLION)
TABLE 132.GENERAL MILLS INC.: KEY EXECUTIVES
TABLE 133.GENERAL MILLS INC.: COMPANY SNAPSHOT
TABLE 134.GENERAL MILLS INC.: OPERATING SEGMENTS
TABLE 135.GENERAL MILLS INC.: PRODUCT PORTFOLIO
TABLE 136.GENERAL MILLS INC.: R&D EXPENDITURE, 2016–2018 ($MILLION)
TABLE 137.GENERAL MILLS INC. : NET SALES, 2016–2018 ($MILLION)
TABLE 138.KETTLE CUISINE, LLC: COMPANY SNAPSHOT
TABLE 139.KETTLE CUISINE, LLC: PRODUCT PORTFOLIO
TABLE 140.NESTLE S.A.: KEY EXECUTIVES
TABLE 141.NESTLE S.A.: COMPANY SNAPSHOT
TABLE 142.NESTLE S.A.: OPERATING SEGMENTS
TABLE 143.NESTLE S.A.: PRODUCT PORTFOLIO
TABLE 144.NESTLE S.A. : NET SALES, 2017–2019 ($MILLION)
TABLE 145.THE HAIN CELESTIAL GROUP: KEY EXECUTIVES
TABLE 146.THE HAIN CELESTIAL GROUP: COMPANY SNAPSHOT
TABLE 147.THE HAIN CELESTIAL GROUP: PRODUCT PORTFOLIO
TABLE 148.THE HAIN CELESTIAL GROUP : R&D EXPENDITURE, 2017–2019 ($MILLION)
TABLE 149.THE HAIN CELESTIAL GROUP: NET SALES, 2017–2019 ($MILLION)
TABLE 150.THE KRAFT HEINZ COMPANY: KEY EXECUTIVES
TABLE 151.THE KRAFT HEINZ COMPANY: COMPANY SNAPSHOT
TABLE 152.THE KRAFT HEINZ COMPANY: OPERATING SEGMENTS
TABLE 153.THE KRAFT HEINZ COMPANY: PRODUCT PORTFOLIO
TABLE 154.THE KRAFT HEINZ COMPANY: R&D EXPENDITURE, 2017–2019 ($MILLION)
TABLE 155.THE KRAFT HEINZ COMPANY: NET SALES, 2017–2019 ($MILLION)
TABLE 156.UNILEVER PLC: KEY EXECUTIVES
TABLE 157.UNILEVER PLC: COMPANY SNAPSHOT
TABLE 158.UNILEVER PLC: OPERATING SEGMENTS
TABLE 159.UNILEVER PLC: PRODUCT PORTFOLIO
TABLE 160.UNILEVER PLC: R&D EXPENDITURE, 2017–2019 ($MILLION)
TABLE 161.UNILEVER PLC: NET SALES, 2017–2019 ($MILLION)
LIST OF FIGURES
FIGURE 01.PACKAGED SOUP MARKET SNAPSHOT
FIGURE 02.PACKAGED SOUP MARKET: SEGMENTATION
FIGURE 03.TOP INVESTMENT POCKETS
FIGURE 04.MODERATE BARGAINING POWER OF SUPPLIERS
FIGURE 05.HIGH BARGAINING POWER OF BUYERS
FIGURE 06.MODERATE THREAT OF SUBSTITUTION
FIGURE 07.HIGH THREAT OF NEW ENTRANTS
FIGURE 08.HIGH INTENSITY OF COMPETITIVE RIVALRY
FIGURE 09.PACKAGED SOUP MARKET: DRIVERS, RESTRAINTS, AND OPPORTUNITIES
FIGURE 10.PACKAGED SOUP MARKET, BY PRODUCT TYPE, 2019 (%)
FIGURE 11.GLOBAL DRIED PACKAGED SOUP MARKET, COMPARATIVE COUNTRY MARKET SHARE ANALYSIS, 2019 AND 2027 (%)
FIGURE 12.GLOBAL WET PACKAGED SOUP MARKET, COMPARATIVE REGIONAL MARKET SHARE ANALYSIS, 2019 AND 2027(%)
FIGURE 13.GLOBAL PACKAGED SOUP MARKET, BY PACKAGING, 2019 (%)
FIGURE 14.GLOBAL BOTTLES PACKAGED SOUP MARKET, COMPARATIVE REGIONAL MARKET SHARE ANALYSIS, 2019 AND 2027 (%)
FIGURE 15.GLOBAL CANNED PACKAGED SOUP MARKET, COMPARATIVE REGIONAL MARKET SHARE ANALYSIS, 2019 AND 2027(%)
FIGURE 16.GLOBAL PACKETS MARKET, COMPARATIVE MARKET SHARE ANALYSIS, 2019 AND 2027(%)
FIGURE 17.GLOBAL PACKAGED SOUP MARKET, BY END USER, 2019 (%)
FIGURE 18.GLOBAL PACKAGED SOUP MARKET REVENUE BY COMMERCIAL SECTOR, COMPARATIVE COUNTRY MARKET SHARE ANALYSIS, 2019 AND 2027(%)
FIGURE 19.GLOBAL PACKAGED SOUP MARKET REVENUE BY HOUSEHOLD SECTOR, COMPARATIVE REGIONAL MARKET SHARE ANALYSIS, 2019 AND 2027(%)
FIGURE 20.GLOBAL PACKAGED SOUP MARKET, BY DISTRIBUTION CHANNEL, 2019 (%)
FIGURE 21.GLOBAL ONLINE STORES PACKAGED SOUP MARKET REVENUE, COMPARATIVE COUNTRY MARKET SHARE ANALYSIS, 2019 AND 2027(%)
FIGURE 22.GLOBAL CONVENIENCE STORE PACKAGED SOUP MARKET, COMPARATIVE REGIONAL MARKET SHARE ANALYSIS, 2019 AND 2027(%)
FIGURE 23.GLOBAL SUPERMARKET/HYPERMARKET PACKAGED SOUP MARKET REVENUE, COMPARATIVE REGIONAL MARKET SHARE ANALYSIS, 2019 AND 2027(%)
FIGURE 24.GLOBAL FOOD SERVICE STORE PACKAGED SOUP MARKET REVENUE, COMPARATIVE REGIONAL MARKET SHARE ANALYSIS, 2019 AND 2027(%)
FIGURE 25.GLOBAL OTHERS PACKAGED SOUP MARKET REVENUE, COMPARATIVE REGIONAL MARKET SHARE ANALYSIS, 2019 AND 2027(%)
FIGURE 26.PACKAGED SOUP MARKET, BY REGION, 2019 (%)
FIGURE 27.U.S. PACKAGED SOUP MARKET REVENUE, 2020-2027($MILLION)
FIGURE 28.MEXICO PACKAGED SOUP MARKET REVENUE, 2019-2027($MILLION)
FIGURE 29.CANADA PACKAGED SOUP MARKET REVENUE, 2019-2027($MILLION)
FIGURE 30.GERMANY PACKAGED SOUP MARKET REVENUE, 2019-2027($MILLION)
FIGURE 31.UK PACKAGED SOUP MARKET REVENUE, 2019-2027($MILLION)
FIGURE 32.FRANCE PACKAGED SOUP MARKET REVENUE, 2019-2027($MILLION)
FIGURE 33.ITALY PACKAGED SOUP MARKET REVENUE, 2019-2027($MILLION)
FIGURE 34.REST OF EUROPE PACKAGED SOUP MARKET REVENUE, 2019-2027($MILLION)
FIGURE 35.REST OF EUROPE PACKAGED SOUP MARKET REVENUE, 2019-2027($MILLION)
FIGURE 36.INDIA PACKAGED SOUP MARKET REVENUE, 2019-2027($MILLION)
FIGURE 37.JAPAN PACKAGED SOUP MARKET REVENUE, 2019-2027($MILLION)
FIGURE 38.CHINA PACKAGED SOUP MARKET REVENUE, 2019-2027($MILLION)
FIGURE 39.INDONESIA PACKAGED SOUP MARKET REVENUE, 2019-2027($MILLION)
FIGURE 40.AUSTRALIA PACKAGED SOUP MARKET REVENUE, 2019-2027($MILLION)
FIGURE 41.REST OF ASIA-PACIFIC PACKAGED SOUP MARKET REVENUE, 2019-2027($MILLION)
FIGURE 42.LATIN AMERICA PACKAGED SOUP MARKET REVENUE, 2019-2027($MILLION)
FIGURE 43.MIDDLE EAST PACKAGED SOUP MARKET REVENUE, 2019-2027($MILLION)
FIGURE 44.AFRICA PACKAGED SOUP MARKET REVENUE, 2019-2027($MILLION)
FIGURE 45.TOP WINNING STRATEGIES, BY YEAR, 2016–2020*
FIGURE 46.TOP WINNING STRATEGIES, BY DEVELOPMENT, 2016–2020* (%)
FIGURE 47.TOP WINNING STRATEGIES, BY COMPANY, 2016–2020*
FIGURE 48.COMPETITIVE DASHBOARD OF TOP 10 KEY PLAYERS
FIGURE 49.COMPETITIVE HEATMAP OF TOP 10 KEY PLAYERS
FIGURE 50.AJINOMOTO CO., INC.: R&D EXPENDITURE, 2017–2019 ($MILLION)
FIGURE 51.AJINOMOTO CO., INC.: NET SALES, 2017–2019 ($MILLION)
FIGURE 52.AJINOMOTO CO., INC.: REVENUE SHARE BY SEGMENT, 2019 (%)
FIGURE 53.B&G FOODS INC.: NET SALES, 2017–2019 ($MILLION)
FIGURE 54.CAMPBELL SOUP COMPANY: R&D EXPENDITURE, 2017–2019 ($MILLION)
FIGURE 55.CAMPBELL SOUP COMPANY: NET SALES, 2017–2019 ($MILLION)
FIGURE 56.CAMPBELL SOUP COMPANY: REVENUE SHARE BY SEGMENT, 2019 (%)
FIGURE 57.CONAGRA BRANDS INC.: R&D EXPENDITURE, 2017–2019 ($MILLION)
FIGURE 58.CONAGRA BRANDS INC.: NET SALES, 2017–2019 ($MILLION)
FIGURE 59.CONAGRA BRANDS INC.: REVENUE SHARE, BY SEGMENT, 2019 (%)
FIGURE 60.GENERAL MILLS INC.: R&D EXPENDITURE, 2016–2018 ($MILLION)
FIGURE 61.GENERAL MILLS INC.: NET SALES, 2017–2019 ($MILLION)
FIGURE 62.GENERAL MILLS INC.: REVENUE SHARE BY SEGMENT, 2018 (%)
FIGURE 63.GENERAL MILLS INC.: REVENUE SHARE BY REGION, 2019 (%)
FIGURE 64.NESTLE S.A.: NET SALES, 2017–2019 ($MILLION)
FIGURE 65.NESTLE S.A.: REVENUE SHARE BY SEGMENT, 2019 (%)
FIGURE 66.NESTLE S.A.: REVENUE SHARE BY REGION, 2019 (%)
FIGURE 67.THE HAIN CELESTIAL GROUP: R&D EXPENDITURE, 2017–2019 ($MILLION)
FIGURE 68.THE HAIN CELESTIAL GROUP: NET SALES, 2017–2019 ($MILLION)
FIGURE 69.THE HAIN CELESTIAL GROUP: REVENUE SHARE BY SEGMENT, 2019 (%)
FIGURE 70.THE KRAFT HEINZ COMPANY: R&D EXPENDITURE, 2017–2019 ($MILLION)
FIGURE 71.THE KRAFT HEINZ COMPANY: NET SALES, 2017–2019 ($MILLION)
FIGURE 72.THE KRAFT HEINZ COMPANY: REVENUE SHARE BY SEGMENT, 2019 (%)
FIGURE 73.UNILEVER PLC: R&D EXPENDITURE, 2017–2019 ($MILLION)
FIGURE 74.UNILEVER PLC: NET SALES, 2017–2019 ($MILLION)
FIGURE 75.UNILEVER PLC: REVENUE SHARE BY SEGMENT, 2019 (%)
FIGURE 76.UNILEVER PLC: REVENUE SHARE BY REGION, 2019 (%)
Key players operating in the global packaged soup market have adopted developmental strategies such as product launch, to strengthen their foothold in the market, in terms of value sales. They emphasize on continuous innovation to formulate products and gain a competitive edge in the global market and to boost the demand for packaged soup.
According to the key market players, increasing consumer demand for convenience foods across the globe boosts growth of the packaged soup market. Thus, the key players are focused on investing in R&D activities to launch improved products for consumers and maintain their position in the market.
According to some key packaged soup companies, rise in trend using convenience food especially among the working class due to their busy lifestyle has fueled the demand for packaged soup across the globe. Moreover, key manufacturers are providing packaged soup in different attractive packaging including bottles, cups and more available in with different portion size to make consumption easy and convenient for consumers. This in turn is fueling the growth of the packaged soup market. However, the rising consumer awareness regarding the hazardous effects associated with the use of artificial preservatives in packaged soup is expected to hamper the packaged soup market growth in terms of value sales during the forecast period.
Q1. What is the total market value of the Packaged Soup Market report?
A. The global packaged soup market is projected to reach $18,317.3 million by 2027
Q2. What would be the forecast period in the Packaged Soup Market report?
A. The forecast period in the packaged soup market report is considered from the year 2021 to 2027
Q3. Which is the base year calculated in the Packaged Soup Market report?
A. 2019 was considered as a base year in the packaged soup market report.
Q4. Which are the top companies hold the market share in the Packaged Soup Market?
A. The Hain Celestial Group, ConAgra Inc., KETTLE CUISINE, LLC, General Mills. B&G Foods, Inc., Campbell Soup Company, Ajinomoto Co., Inc., Unilever., Nestle, and The Kraft Heinz Company are the top companies which hold the market share in the Packaged Soup Market.
Q5. Which is the most influencing segment growing in the Packaged Soup Market report?
A. Wet packaged soup is the most influencing segment growing in the Packaged Soup Market report.
Q6. Which market holds the maximum market share of the Packaged Soup Market?
A. North American market holds the maximum market share of the Packaged Soup Market.
Q7. How the company profile has been selected?
A. The company profile selected on the basis of the number of types of packaged soup they are offering in the global market.
Q8. What is the market value of the Packaged Soup Market in 2019?
A. The global packaged soup market was valued at $11,758.9 million in 2019.
Download Sample
Purchase Full Report of
Packaged Soup Market
- Online Only
- $3,712
- Online cloud access only
- Restricted print, copy, paste & download
- Read only
- Free quarterly industry update
- Free report update (Within 180 days)
- Subscription model sign in
- Data Pack
- $4,125
- Restricted to one authorized user
- One print only
- Available in
Excel - Free quarterly industry update
- Free report update (Within 180 days)
- Subscription model sign in
- Single User
- $6,168
- Restricted to one authorized user
- One print only
- Available in Excel & PDF
- Free quarterly industry update
- Free report update (Within 180 days)
- Subscription model sign in
- Five Users
- $6,929
- Limited to five authorized users
- Print upto five copies
- Available in Excel & PDF
- Free quarterly industry update
- Free report update (Within 180 days)
- Subscription model sign in
-
Enterprise
License/PDF - $9,663
- Unlimited
within
company/enterprise - Available in Excel & PDF
- Free quarterly industry update
- Free report update (Within 180 days)
- Subscription model sign in
- Library Membership
- $ 699/mo
- Published Content
E-access - Company Profiles
E-access - Newly Added Content Access
- 10 PDF
Downloads - 5 Excel Data
Pack Downloads - 250 Company Profiles PDF Downloads
-
Start reading instantly.
Buy Now
This title and over 12,000+ are available on the Avenue Library. T&C*.
*Taxes/Fees, if applicable will be added during checkout. All prices in USD
Why Allied Market Research?
Infallible Methodology
To ensure high-level data integrity, accurate analysis, and impeccable forecasts
Analyst Support
For complete satisfaction
Customization
On-demand customization of scope of the report to exactly meet your needs
TARGETED MARKET VIEW
Targeted market view to provide pertinent information and save time of readers
Featured Reports
Get fresh content delivered
Get insights on topics that are crucial for your business. Stay abreast of your interest areas.
Why Allied Market Research?
Infallible Methodology
To ensure high-level data integrity, accurate analysis, and impeccable forecasts
Analyst Support
For complete satisfaction
Customization
On-demand customization of scope of the report to exactly meet your needs
TARGETED MARKET VIEW
Targeted market view to provide pertinent information and save time of readers