0
New
New
2023
Plastic Recycling Market

Plastic Recycling Market

by Product (Polyethylene (PE), Polyethylene Terephthalate (PET), Polypropylene (PP), Polyvinyl Chloride (PVC), Polystyrene (PS), Others), by Source (Plastic Bottles, Plastic Films, Polymer Foam, Others), by Application (Building and Construction, Packaging, Electrical and Electronics, Textiles, Automotive, Others): Global Opportunity Analysis and Industry Forecast, 2022-2031

Report Code: A08207
Apr 2023 | Pages: 280
Tables: 116
Charts: 62
  • Formats*:

  • pdf

    Single User License, Five User
    License & Enterprise User License

  • xls

    Data Pack Excel License

  • ppt

    It comes with the additional cost
    of $2500.00 contact sales.


Plastic Recycling Market Research, 2031

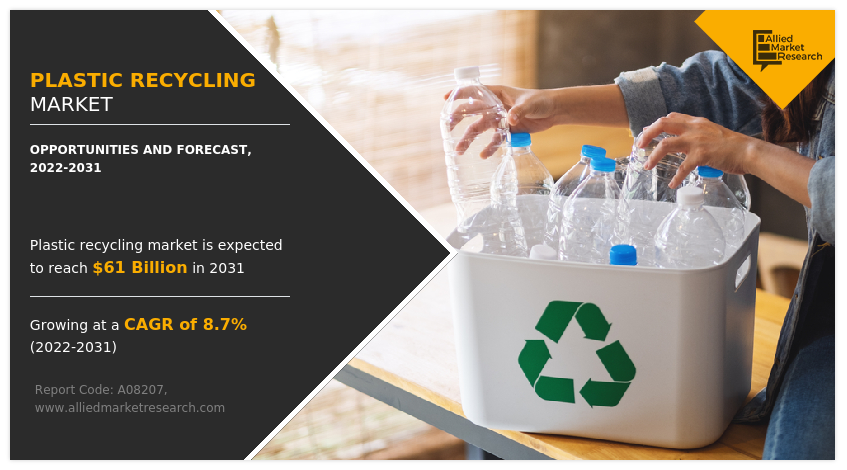
The global plastic recycling market was valued at $27.9 billion in 2021, and is projected to reach $61 billion by 2031, growing at a CAGR of 8.7% from 2022 to 2031. Plastic recycling is the process of retrieving waste or used plastic materials and converting them into new products. Plastic waste is collected, sorted, cleaned, and processed in this process to produce a new material that can be utilized to make other products. The major objective of plastic recycling is to decrease the amount of plastic waste that ends up in dumping grounds and oceans and to conserve natural resources by using recycled plastic instead of new plastic. It is a crucial aspect of waste management and environmental conservation efforts. Several key factors are driving the plastic recycling market.
The COVID-19 outbreak has had a substantial impact on the plastic recycling sector. The outbreak disrupted the supply chain, and the overall economic conditions of numerous countries, and decreased demand for recycled plastic. Due to the pandemic, recycling plants were closed, there was a labor shortage, as well as there, were delays in transportation. As a result, during the outbreak, there was less plastic waste that could be gathered and processed.

Plastic Recycling Market

The rising awareness of the negative impacts of plastic waste on the environment, such as ocean pollution and harm to wildlife, is one of the major factors driving the growth of the market. Due to this, there is now more demand for plastic recycling as a means of reducing plastic waste and lowering its environmental impact. The growing desire by consumers and businesses for environmentally friendly and sustainable goods is another factor driving the plastic recycling industry. Recycled plastic is increasingly being used in goods by many businesses, which has increased demand for the material.

Although there are a number of market drivers for plastic recycling, there are also some major barriers that can hamper the plastic recycling market size. Lack of infrastructure and funding for plastic recycling facilities, particularly in developing nations, is one of the major obstacles. This makes it difficult to gather, sort, and treat plastic waste, which can impede the expansion of the market for plastic recycling in developing countries.

The government policies and programs targeted at boosting recycling and reducing plastic waste are expected to offer ample opportunities to the plastic recycling industry. Governments all around the world are putting into place laws and policies that encourage businesses to use recycled plastics and cut down on their plastic waste.

The industry players are investing a lot of effort on the research and development of smart and unique strategies to sustain their growth in the market. These strategies include product launches, mergers & acquisitions, collaborations, partnerships, and refurbishing of existing technology. For example, in 2022, SCG Chemicals acquired plastic recycling firm Sirplaste, one of the leading plastic recycling companies in Portugal. The acquisition is expected to help SCG Chemicals enter into the High-Quality Post-Consumer Recycled Resin (PCR) markets in Europe and Portugal.

The key players profiled in this report include are REMONDIS SE & Co. KG, Biffa, Stericycle, Republic Services, Inc., WM Intellectual Property Holdings, L.L.C., Veolia, Shell International B.V., Waste Connections, CLEAN HARBORS, INC., and Covetsro AG.

The global plastic recycling market forecast report is segmented on the basis of product, source, application, and region. By product, the market is sub-segmented into polyethylene (PE), polyethylene terephthalate (PET), polypropylene (PP), polyvinyl Chloride (PVC), polystyrene (PS), and others. By Source, the market is classified into plastic bottles, plastic films, polymer foam, and others. By application, the market is classified into building & construction, packaging, electrical & electronics, textiles, automotive, and others. By region, the market is analyzed across North America, Europe, Asia-Pacific, and LAMEA.
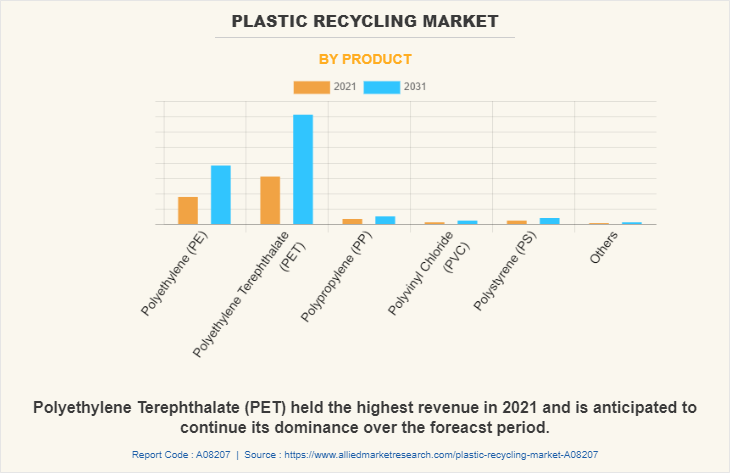
The plastic recycling market is segmented into Product, Source and Application.

Plastic Recycling Market

By product, the polyethylene terephthalate (PET) sub-segment dominated the plastic recycling market share in 2021. PET is a thermoplastic polymer that can be used for a variety of purposes. It is most frequently used to create transparent plastic bottles for juices, soft drinks, and water. Moreover, it is employed in the production of food packaging materials like trays, containers, and films. One of the plastics that is recycled the most widely worldwide is PET. It is commonly accepted for recycling and can be converted into a range of items, including new bottles and containers as well as fibers for carpets, insulation, and clothing.
Plastic Recycling Market

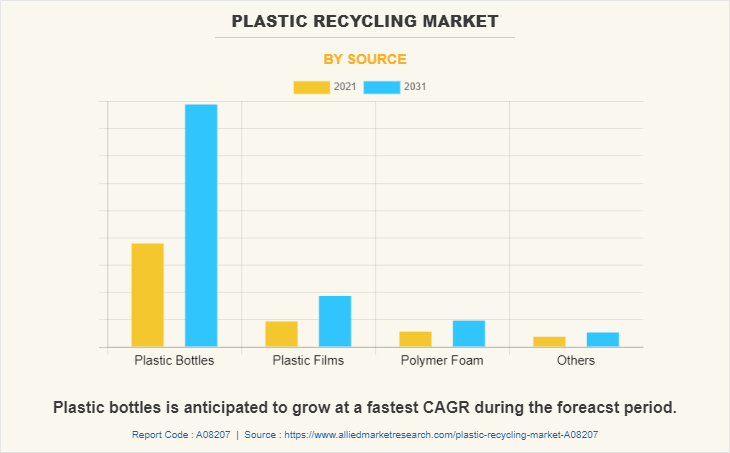
By source, the plastic bottles sub-segment accounted for the largest market share in 2021. There has been growing usage of plastic bottles across the globe owing to their convenience and affordability. They are relatively inexpensive to produce and lightweight, making them a popular option for packaging beverages and other goods. While plastic bottles have numerous advantages, their environmental impact is also significant, including their contribution to plastic pollution. Hence, to address this issue, many organizations and governments have increased their efforts to recycle plastic bottles. Plastic bottle recycling has a lot of advantages. It lowers the amount of plastic waste that is dumped in landfills and oceans, conserves resources by lowering the need for new plastic manufacture, and significantly saves energy by utilizing less energy to produce recycled materials compared to new materials.
Plastic Recycling Market

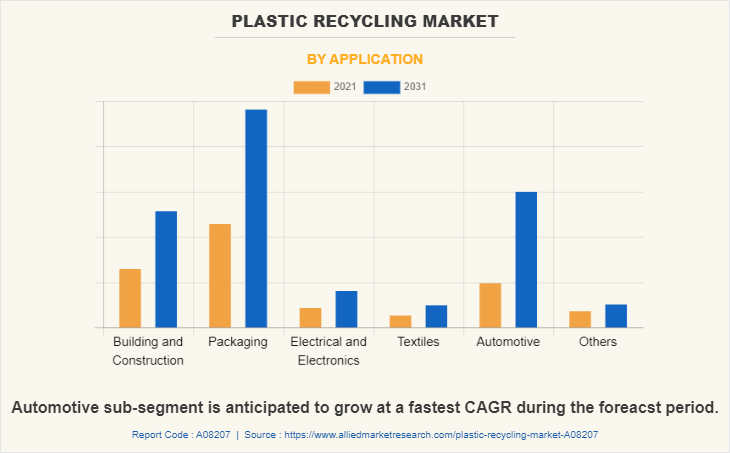
By application, the packaging sub-segment accounted for the largest market share in 2021. Recycled plastic is being increasingly utilized for packaging purposes as an environmentally friendly substitute. Less waste, less energy use, and a smaller carbon footprint are some of the major advantages of using recycled plastic in packaging. Compared to the manufacture of virgin plastic, the production of recycled plastic uses less energy and emits fewer greenhouse gases. All these factors contribute to the growth of the packaging sub-segment.
Plastic Recycling Market

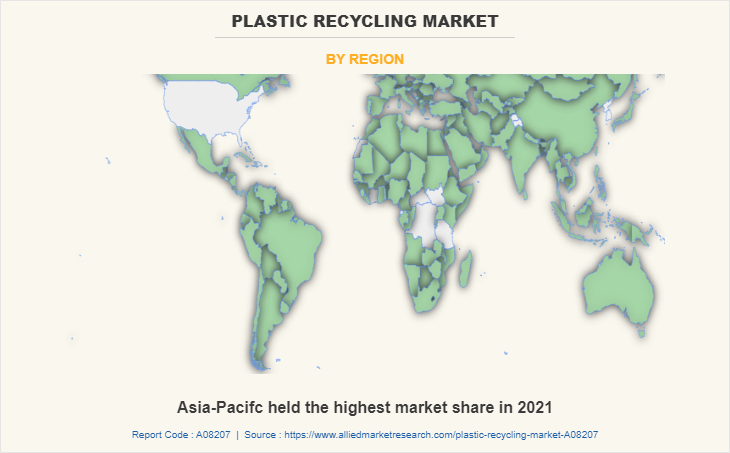
By region, Asia-Pacific region accounted for the largest market share in 2021. There is a rising concern about the environmental effect of plastic waste in this region, especially in nations with high population densities and a lack of waste management infrastructure. This has significantly increased awareness and demand for sustainable waste management practices, including plastic recycling in the Asia-Pacific region. Moreover, the demand for recycled plastic is boosting in this region, due to the growth of the consumer goods and packaging industries.

Impact of COVID-19 on the Global Plastic Recycling Industry

  • The COVID-19 pandemic has had a severe impact on the global plastic recycling market growth. The pandemic has impacted the industry by disrupting supply chains, reduced R&D funding, transportation constraints.

  • Owing to these factors, there was significant reduction in the plastic garbage collection across the globe that could be processed throughout the recycling process.

  • However, post COVID-19 pandemic, the plastic recycling business recovered significantly, and it is anticipated to keep growing as governments are focusing more on sustainability and plastic waste reduction.

Key Benefits For Stakeholders

  • This report provides a quantitative analysis of the market segments, current trends, estimations, and dynamics of the plastic recycling market analysis from 2021 to 2031 to identify the prevailing plastic recycling market opportunities.
  • The market research is offered along with information related to key drivers, restraints, and opportunities.
  • Porter's five forces analysis highlights the potency of buyers and suppliers to enable stakeholders make profit-oriented business decisions and strengthen their supplier-buyer network.
  • In-depth analysis of the plastic recycling market segmentation assists to determine the prevailing market opportunities.
  • Major countries in each region are mapped according to their revenue contribution to the global market.
  • Market player positioning facilitates benchmarking and provides a clear understanding of the present position of the market players.
  • The report includes the analysis of the regional as well as global plastic recycling market trends, key players, market segments, application areas, and market growth strategies.

Plastic Recycling Market Report Highlights

Aspects Details
Market Size By 2031 USD 61 billion
Growth Rate CAGR of 8.7%
Forecast period 2021 - 2031
Report Pages 280
By Product
  • Polystyrene (PS)
  • Polyethylene (PE)
  • Polyethylene Terephthalate (PET)
  • Polypropylene (PP)
  • Polyvinyl Chloride (PVC)
  • Others
By Source
  • Plastic Bottles
  • Plastic Films
  • Polymer Foam
  • Others
By Application
  • Building and Construction
  • Packaging
  • Electrical and Electronics
  • Textiles
  • Automotive
  • Others
By Region
  • North America  (U.S., Canada, Mexico)
  • Europe  (Germany, UK, France, Spain, Italy, Rest of Europe)
  • Asia-Pacific  (China, Japan, India, South Korea, Australia, Rest of Asia-Pacific)
  • LAMEA  (Brazil, Saudi Arabia, UAE, South Africa, Rest of LAMEA)
Key Market Players Berry Global Group Inc, biffa, Covetsro AG, Waste Connections, Inc., Veolia, Clean Harbors, Inc., REMONDIS SE & Co. KG, shell international b.v., Republic Services, Inc., Stericycle

Analyst Review

The plastic recycling market is likely to experience robust growth in the coming years backed by stringent regulatory norms and standards imposed by environmental authorities to channelize the disposing of plastic efficiently in order to reuse and recycle plastic related products across different end verticals. For instance, selected Asian countries namely Singapore, Malaysia, and Thailand are stepping up their regulatory efforts by imposing new laws and national plastic roadmaps to create sustainable environment and encourage plastic recycling activity. However, the major limitation faced by the plastic recycling market is the lack of proper infrastructure, especially in developing countries. There is a need for more advanced technology and facilities to effectively collect, sort, and recycle plastic waste. This activity mainly emphasizes compulsory household waste sorting and dumping efficiently to reduce CO2 emissions and oil consumption deliberately. Furthermore, plastic recycling players are proactively focusing on introducing new technologies to enable more efficient plastics recycling methods which are aligning with the commitments to the new plastics economy mission stated by environmental authorities to reduce, reuse and recycle plastics. Owing to this, the plastic recycling market is expected to showcase high growth in the coming years.  

Among the analyzed regions, Asia-Pacific region accounted for the highest market share in 2021, followed by North America, Europe, and LAMEA. The Asia-Pacific region is home to some of the world's fastest-growing economies, which has led to an increase in the generation of plastic waste in this region.

 
  • CHAPTER 1: INTRODUCTION

    • 1.1. Report description

    • 1.2. Key market segments

    • 1.3. Key benefits to the stakeholders

    • 1.4. Research Methodology

      • 1.4.1. Primary research

      • 1.4.2. Secondary research

      • 1.4.3. Analyst tools and models

  • CHAPTER 2: EXECUTIVE SUMMARY

    • 2.1. CXO Perspective

  • CHAPTER 3: MARKET OVERVIEW

    • 3.1. Market definition and scope

    • 3.2. Key findings

      • 3.2.1. Top impacting factors

      • 3.2.2. Top investment pockets

    • 3.3. Porter’s five forces analysis

    • 3.4. Market dynamics

      • 3.4.1. Drivers

      • 3.4.2. Restraints

      • 3.4.3. Opportunities

    • 3.5. COVID-19 Impact Analysis on the market

    • 3.6. Key Regulation Analysis

    • 3.7. Market Share Analysis

    • 3.8. Patent Landscape

    • 3.9. Regulatory Guidelines

    • 3.10. Value Chain Analysis

  • CHAPTER 4: PLASTIC RECYCLING MARKET, BY PRODUCT

    • 4.1. Overview

      • 4.1.1. Market size and forecast

    • 4.2. Polyethylene (PE)

      • 4.2.1. Key market trends, growth factors and opportunities

      • 4.2.2. Market size and forecast, by region

      • 4.2.3. Market share analysis by country

    • 4.3. Polyethylene Terephthalate (PET)

      • 4.3.1. Key market trends, growth factors and opportunities

      • 4.3.2. Market size and forecast, by region

      • 4.3.3. Market share analysis by country

    • 4.4. Polypropylene (PP)

      • 4.4.1. Key market trends, growth factors and opportunities

      • 4.4.2. Market size and forecast, by region

      • 4.4.3. Market share analysis by country

    • 4.5. Polyvinyl Chloride (PVC)

      • 4.5.1. Key market trends, growth factors and opportunities

      • 4.5.2. Market size and forecast, by region

      • 4.5.3. Market share analysis by country

    • 4.6. Polystyrene (PS)

      • 4.6.1. Key market trends, growth factors and opportunities

      • 4.6.2. Market size and forecast, by region

      • 4.6.3. Market share analysis by country

    • 4.7. Others

      • 4.7.1. Key market trends, growth factors and opportunities

      • 4.7.2. Market size and forecast, by region

      • 4.7.3. Market share analysis by country

  • CHAPTER 5: PLASTIC RECYCLING MARKET, BY SOURCE

    • 5.1. Overview

      • 5.1.1. Market size and forecast

    • 5.2. Plastic Bottles

      • 5.2.1. Key market trends, growth factors and opportunities

      • 5.2.2. Market size and forecast, by region

      • 5.2.3. Market share analysis by country

    • 5.3. Plastic Films

      • 5.3.1. Key market trends, growth factors and opportunities

      • 5.3.2. Market size and forecast, by region

      • 5.3.3. Market share analysis by country

    • 5.4. Polymer Foam

      • 5.4.1. Key market trends, growth factors and opportunities

      • 5.4.2. Market size and forecast, by region

      • 5.4.3. Market share analysis by country

    • 5.5. Others

      • 5.5.1. Key market trends, growth factors and opportunities

      • 5.5.2. Market size and forecast, by region

      • 5.5.3. Market share analysis by country

  • CHAPTER 6: PLASTIC RECYCLING MARKET, BY APPLICATION

    • 6.1. Overview

      • 6.1.1. Market size and forecast

    • 6.2. Building and Construction

      • 6.2.1. Key market trends, growth factors and opportunities

      • 6.2.2. Market size and forecast, by region

      • 6.2.3. Market share analysis by country

    • 6.3. Packaging

      • 6.3.1. Key market trends, growth factors and opportunities

      • 6.3.2. Market size and forecast, by region

      • 6.3.3. Market share analysis by country

    • 6.4. Electrical and Electronics

      • 6.4.1. Key market trends, growth factors and opportunities

      • 6.4.2. Market size and forecast, by region

      • 6.4.3. Market share analysis by country

    • 6.5. Textiles

      • 6.5.1. Key market trends, growth factors and opportunities

      • 6.5.2. Market size and forecast, by region

      • 6.5.3. Market share analysis by country

    • 6.6. Automotive

      • 6.6.1. Key market trends, growth factors and opportunities

      • 6.6.2. Market size and forecast, by region

      • 6.6.3. Market share analysis by country

    • 6.7. Others

      • 6.7.1. Key market trends, growth factors and opportunities

      • 6.7.2. Market size and forecast, by region

      • 6.7.3. Market share analysis by country

  • CHAPTER 7: PLASTIC RECYCLING MARKET, BY REGION

    • 7.1. Overview

      • 7.1.1. Market size and forecast By Region

    • 7.2. North America

      • 7.2.1. Key trends and opportunities

      • 7.2.2. Market size and forecast, by Product

      • 7.2.3. Market size and forecast, by Source

      • 7.2.4. Market size and forecast, by Application

      • 7.2.5. Market size and forecast, by country

        • 7.2.5.1. U.S.
          • 7.2.5.1.1. Key market trends, growth factors and opportunities
          • 7.2.5.1.2. Market size and forecast, by Product
          • 7.2.5.1.3. Market size and forecast, by Source
          • 7.2.5.1.4. Market size and forecast, by Application
        • 7.2.5.2. Canada
          • 7.2.5.2.1. Key market trends, growth factors and opportunities
          • 7.2.5.2.2. Market size and forecast, by Product
          • 7.2.5.2.3. Market size and forecast, by Source
          • 7.2.5.2.4. Market size and forecast, by Application
        • 7.2.5.3. Mexico
          • 7.2.5.3.1. Key market trends, growth factors and opportunities
          • 7.2.5.3.2. Market size and forecast, by Product
          • 7.2.5.3.3. Market size and forecast, by Source
          • 7.2.5.3.4. Market size and forecast, by Application
    • 7.3. Europe

      • 7.3.1. Key trends and opportunities

      • 7.3.2. Market size and forecast, by Product

      • 7.3.3. Market size and forecast, by Source

      • 7.3.4. Market size and forecast, by Application

      • 7.3.5. Market size and forecast, by country

        • 7.3.5.1. Germany
          • 7.3.5.1.1. Key market trends, growth factors and opportunities
          • 7.3.5.1.2. Market size and forecast, by Product
          • 7.3.5.1.3. Market size and forecast, by Source
          • 7.3.5.1.4. Market size and forecast, by Application
        • 7.3.5.2. UK
          • 7.3.5.2.1. Key market trends, growth factors and opportunities
          • 7.3.5.2.2. Market size and forecast, by Product
          • 7.3.5.2.3. Market size and forecast, by Source
          • 7.3.5.2.4. Market size and forecast, by Application
        • 7.3.5.3. France
          • 7.3.5.3.1. Key market trends, growth factors and opportunities
          • 7.3.5.3.2. Market size and forecast, by Product
          • 7.3.5.3.3. Market size and forecast, by Source
          • 7.3.5.3.4. Market size and forecast, by Application
        • 7.3.5.4. Spain
          • 7.3.5.4.1. Key market trends, growth factors and opportunities
          • 7.3.5.4.2. Market size and forecast, by Product
          • 7.3.5.4.3. Market size and forecast, by Source
          • 7.3.5.4.4. Market size and forecast, by Application
        • 7.3.5.5. Italy
          • 7.3.5.5.1. Key market trends, growth factors and opportunities
          • 7.3.5.5.2. Market size and forecast, by Product
          • 7.3.5.5.3. Market size and forecast, by Source
          • 7.3.5.5.4. Market size and forecast, by Application
        • 7.3.5.6. Rest of Europe
          • 7.3.5.6.1. Key market trends, growth factors and opportunities
          • 7.3.5.6.2. Market size and forecast, by Product
          • 7.3.5.6.3. Market size and forecast, by Source
          • 7.3.5.6.4. Market size and forecast, by Application
    • 7.4. Asia-Pacific

      • 7.4.1. Key trends and opportunities

      • 7.4.2. Market size and forecast, by Product

      • 7.4.3. Market size and forecast, by Source

      • 7.4.4. Market size and forecast, by Application

      • 7.4.5. Market size and forecast, by country

        • 7.4.5.1. China
          • 7.4.5.1.1. Key market trends, growth factors and opportunities
          • 7.4.5.1.2. Market size and forecast, by Product
          • 7.4.5.1.3. Market size and forecast, by Source
          • 7.4.5.1.4. Market size and forecast, by Application
        • 7.4.5.2. Japan
          • 7.4.5.2.1. Key market trends, growth factors and opportunities
          • 7.4.5.2.2. Market size and forecast, by Product
          • 7.4.5.2.3. Market size and forecast, by Source
          • 7.4.5.2.4. Market size and forecast, by Application
        • 7.4.5.3. India
          • 7.4.5.3.1. Key market trends, growth factors and opportunities
          • 7.4.5.3.2. Market size and forecast, by Product
          • 7.4.5.3.3. Market size and forecast, by Source
          • 7.4.5.3.4. Market size and forecast, by Application
        • 7.4.5.4. South Korea
          • 7.4.5.4.1. Key market trends, growth factors and opportunities
          • 7.4.5.4.2. Market size and forecast, by Product
          • 7.4.5.4.3. Market size and forecast, by Source
          • 7.4.5.4.4. Market size and forecast, by Application
        • 7.4.5.5. Australia
          • 7.4.5.5.1. Key market trends, growth factors and opportunities
          • 7.4.5.5.2. Market size and forecast, by Product
          • 7.4.5.5.3. Market size and forecast, by Source
          • 7.4.5.5.4. Market size and forecast, by Application
        • 7.4.5.6. Rest of Asia-Pacific
          • 7.4.5.6.1. Key market trends, growth factors and opportunities
          • 7.4.5.6.2. Market size and forecast, by Product
          • 7.4.5.6.3. Market size and forecast, by Source
          • 7.4.5.6.4. Market size and forecast, by Application
    • 7.5. LAMEA

      • 7.5.1. Key trends and opportunities

      • 7.5.2. Market size and forecast, by Product

      • 7.5.3. Market size and forecast, by Source

      • 7.5.4. Market size and forecast, by Application

      • 7.5.5. Market size and forecast, by country

        • 7.5.5.1. Brazil
          • 7.5.5.1.1. Key market trends, growth factors and opportunities
          • 7.5.5.1.2. Market size and forecast, by Product
          • 7.5.5.1.3. Market size and forecast, by Source
          • 7.5.5.1.4. Market size and forecast, by Application
        • 7.5.5.2. Saudi Arabia
          • 7.5.5.2.1. Key market trends, growth factors and opportunities
          • 7.5.5.2.2. Market size and forecast, by Product
          • 7.5.5.2.3. Market size and forecast, by Source
          • 7.5.5.2.4. Market size and forecast, by Application
        • 7.5.5.3. UAE
          • 7.5.5.3.1. Key market trends, growth factors and opportunities
          • 7.5.5.3.2. Market size and forecast, by Product
          • 7.5.5.3.3. Market size and forecast, by Source
          • 7.5.5.3.4. Market size and forecast, by Application
        • 7.5.5.4. South Africa
          • 7.5.5.4.1. Key market trends, growth factors and opportunities
          • 7.5.5.4.2. Market size and forecast, by Product
          • 7.5.5.4.3. Market size and forecast, by Source
          • 7.5.5.4.4. Market size and forecast, by Application
        • 7.5.5.5. Rest of LAMEA
          • 7.5.5.5.1. Key market trends, growth factors and opportunities
          • 7.5.5.5.2. Market size and forecast, by Product
          • 7.5.5.5.3. Market size and forecast, by Source
          • 7.5.5.5.4. Market size and forecast, by Application
  • CHAPTER 8: COMPETITIVE LANDSCAPE

    • 8.1. Introduction

    • 8.2. Top winning strategies

    • 8.3. Product Mapping of Top 10 Player

    • 8.4. Competitive Dashboard

    • 8.5. Competitive Heatmap

    • 8.6. Top player positioning, 2021

  • CHAPTER 9: COMPANY PROFILES

    • 9.1. Veolia

      • 9.1.1. Company overview

      • 9.1.2. Key Executives

      • 9.1.3. Company snapshot

    • 9.2. REMONDIS SE & Co. KG

      • 9.2.1. Company overview

      • 9.2.2. Key Executives

      • 9.2.3. Company snapshot

    • 9.3. biffa

      • 9.3.1. Company overview

      • 9.3.2. Key Executives

      • 9.3.3. Company snapshot

    • 9.4. Stericycle

      • 9.4.1. Company overview

      • 9.4.2. Key Executives

      • 9.4.3. Company snapshot

    • 9.5. Republic Services, Inc.

      • 9.5.1. Company overview

      • 9.5.2. Key Executives

      • 9.5.3. Company snapshot

    • 9.6. shell international b.v.

      • 9.6.1. Company overview

      • 9.6.2. Key Executives

      • 9.6.3. Company snapshot

    • 9.7. Waste Connections, Inc.

      • 9.7.1. Company overview

      • 9.7.2. Key Executives

      • 9.7.3. Company snapshot

    • 9.8. Clean Harbors, Inc.

      • 9.8.1. Company overview

      • 9.8.2. Key Executives

      • 9.8.3. Company snapshot

    • 9.9. Covetsro AG

      • 9.9.1. Company overview

      • 9.9.2. Key Executives

      • 9.9.3. Company snapshot

    • 9.10. Berry Global Group Inc

      • 9.10.1. Company overview

      • 9.10.2. Key Executives

      • 9.10.3. Company snapshot

  • LIST OF TABLES

  • TABLE 01. GLOBAL PLASTIC RECYCLING MARKET, BY PRODUCT, 2021-2031 ($MILLION)
    TABLE 02. PLASTIC RECYCLING MARKET FOR POLYETHYLENE (PE), BY REGION, 2021-2031 ($MILLION)
    TABLE 03. PLASTIC RECYCLING MARKET FOR POLYETHYLENE TEREPHTHALATE (PET), BY REGION, 2021-2031 ($MILLION)
    TABLE 04. PLASTIC RECYCLING MARKET FOR POLYPROPYLENE (PP), BY REGION, 2021-2031 ($MILLION)
    TABLE 05. PLASTIC RECYCLING MARKET FOR POLYVINYL CHLORIDE (PVC), BY REGION, 2021-2031 ($MILLION)
    TABLE 06. PLASTIC RECYCLING MARKET FOR POLYSTYRENE (PS), BY REGION, 2021-2031 ($MILLION)
    TABLE 07. PLASTIC RECYCLING MARKET FOR OTHERS, BY REGION, 2021-2031 ($MILLION)
    TABLE 08. GLOBAL PLASTIC RECYCLING MARKET, BY SOURCE, 2021-2031 ($MILLION)
    TABLE 09. PLASTIC RECYCLING MARKET FOR PLASTIC BOTTLES, BY REGION, 2021-2031 ($MILLION)
    TABLE 10. PLASTIC RECYCLING MARKET FOR PLASTIC FILMS, BY REGION, 2021-2031 ($MILLION)
    TABLE 11. PLASTIC RECYCLING MARKET FOR POLYMER FOAM, BY REGION, 2021-2031 ($MILLION)
    TABLE 12. PLASTIC RECYCLING MARKET FOR OTHERS, BY REGION, 2021-2031 ($MILLION)
    TABLE 13. GLOBAL PLASTIC RECYCLING MARKET, BY APPLICATION, 2021-2031 ($MILLION)
    TABLE 14. PLASTIC RECYCLING MARKET FOR BUILDING AND CONSTRUCTION, BY REGION, 2021-2031 ($MILLION)
    TABLE 15. PLASTIC RECYCLING MARKET FOR PACKAGING, BY REGION, 2021-2031 ($MILLION)
    TABLE 16. PLASTIC RECYCLING MARKET FOR ELECTRICAL AND ELECTRONICS, BY REGION, 2021-2031 ($MILLION)
    TABLE 17. PLASTIC RECYCLING MARKET FOR TEXTILES, BY REGION, 2021-2031 ($MILLION)
    TABLE 18. PLASTIC RECYCLING MARKET FOR AUTOMOTIVE, BY REGION, 2021-2031 ($MILLION)
    TABLE 19. PLASTIC RECYCLING MARKET FOR OTHERS, BY REGION, 2021-2031 ($MILLION)
    TABLE 20. PLASTIC RECYCLING MARKET, BY REGION, 2021-2031 ($MILLION)
    TABLE 21. NORTH AMERICA PLASTIC RECYCLING MARKET, BY PRODUCT, 2021-2031 ($MILLION)
    TABLE 22. NORTH AMERICA PLASTIC RECYCLING MARKET, BY SOURCE, 2021-2031 ($MILLION)
    TABLE 23. NORTH AMERICA PLASTIC RECYCLING MARKET, BY APPLICATION, 2021-2031 ($MILLION)
    TABLE 24. NORTH AMERICA PLASTIC RECYCLING MARKET, BY COUNTRY, 2021-2031 ($MILLION)
    TABLE 25. U.S. PLASTIC RECYCLING MARKET, BY PRODUCT, 2021-2031 ($MILLION)
    TABLE 26. U.S. PLASTIC RECYCLING MARKET, BY SOURCE, 2021-2031 ($MILLION)
    TABLE 27. U.S. PLASTIC RECYCLING MARKET, BY APPLICATION, 2021-2031 ($MILLION)
    TABLE 28. CANADA PLASTIC RECYCLING MARKET, BY PRODUCT, 2021-2031 ($MILLION)
    TABLE 29. CANADA PLASTIC RECYCLING MARKET, BY SOURCE, 2021-2031 ($MILLION)
    TABLE 30. CANADA PLASTIC RECYCLING MARKET, BY APPLICATION, 2021-2031 ($MILLION)
    TABLE 31. MEXICO PLASTIC RECYCLING MARKET, BY PRODUCT, 2021-2031 ($MILLION)
    TABLE 32. MEXICO PLASTIC RECYCLING MARKET, BY SOURCE, 2021-2031 ($MILLION)
    TABLE 33. MEXICO PLASTIC RECYCLING MARKET, BY APPLICATION, 2021-2031 ($MILLION)
    TABLE 34. EUROPE PLASTIC RECYCLING MARKET, BY PRODUCT, 2021-2031 ($MILLION)
    TABLE 35. EUROPE PLASTIC RECYCLING MARKET, BY SOURCE, 2021-2031 ($MILLION)
    TABLE 36. EUROPE PLASTIC RECYCLING MARKET, BY APPLICATION, 2021-2031 ($MILLION)
    TABLE 37. EUROPE PLASTIC RECYCLING MARKET, BY COUNTRY, 2021-2031 ($MILLION)
    TABLE 38. GERMANY PLASTIC RECYCLING MARKET, BY PRODUCT, 2021-2031 ($MILLION)
    TABLE 39. GERMANY PLASTIC RECYCLING MARKET, BY SOURCE, 2021-2031 ($MILLION)
    TABLE 40. GERMANY PLASTIC RECYCLING MARKET, BY APPLICATION, 2021-2031 ($MILLION)
    TABLE 41. UK PLASTIC RECYCLING MARKET, BY PRODUCT, 2021-2031 ($MILLION)
    TABLE 42. UK PLASTIC RECYCLING MARKET, BY SOURCE, 2021-2031 ($MILLION)
    TABLE 43. UK PLASTIC RECYCLING MARKET, BY APPLICATION, 2021-2031 ($MILLION)
    TABLE 44. FRANCE PLASTIC RECYCLING MARKET, BY PRODUCT, 2021-2031 ($MILLION)
    TABLE 45. FRANCE PLASTIC RECYCLING MARKET, BY SOURCE, 2021-2031 ($MILLION)
    TABLE 46. FRANCE PLASTIC RECYCLING MARKET, BY APPLICATION, 2021-2031 ($MILLION)
    TABLE 47. SPAIN PLASTIC RECYCLING MARKET, BY PRODUCT, 2021-2031 ($MILLION)
    TABLE 48. SPAIN PLASTIC RECYCLING MARKET, BY SOURCE, 2021-2031 ($MILLION)
    TABLE 49. SPAIN PLASTIC RECYCLING MARKET, BY APPLICATION, 2021-2031 ($MILLION)
    TABLE 50. ITALY PLASTIC RECYCLING MARKET, BY PRODUCT, 2021-2031 ($MILLION)
    TABLE 51. ITALY PLASTIC RECYCLING MARKET, BY SOURCE, 2021-2031 ($MILLION)
    TABLE 52. ITALY PLASTIC RECYCLING MARKET, BY APPLICATION, 2021-2031 ($MILLION)
    TABLE 53. REST OF EUROPE PLASTIC RECYCLING MARKET, BY PRODUCT, 2021-2031 ($MILLION)
    TABLE 54. REST OF EUROPE PLASTIC RECYCLING MARKET, BY SOURCE, 2021-2031 ($MILLION)
    TABLE 55. REST OF EUROPE PLASTIC RECYCLING MARKET, BY APPLICATION, 2021-2031 ($MILLION)
    TABLE 56. ASIA-PACIFIC PLASTIC RECYCLING MARKET, BY PRODUCT, 2021-2031 ($MILLION)
    TABLE 57. ASIA-PACIFIC PLASTIC RECYCLING MARKET, BY SOURCE, 2021-2031 ($MILLION)
    TABLE 58. ASIA-PACIFIC PLASTIC RECYCLING MARKET, BY APPLICATION, 2021-2031 ($MILLION)
    TABLE 59. ASIA-PACIFIC PLASTIC RECYCLING MARKET, BY COUNTRY, 2021-2031 ($MILLION)
    TABLE 60. CHINA PLASTIC RECYCLING MARKET, BY PRODUCT, 2021-2031 ($MILLION)
    TABLE 61. CHINA PLASTIC RECYCLING MARKET, BY SOURCE, 2021-2031 ($MILLION)
    TABLE 62. CHINA PLASTIC RECYCLING MARKET, BY APPLICATION, 2021-2031 ($MILLION)
    TABLE 63. JAPAN PLASTIC RECYCLING MARKET, BY PRODUCT, 2021-2031 ($MILLION)
    TABLE 64. JAPAN PLASTIC RECYCLING MARKET, BY SOURCE, 2021-2031 ($MILLION)
    TABLE 65. JAPAN PLASTIC RECYCLING MARKET, BY APPLICATION, 2021-2031 ($MILLION)
    TABLE 66. INDIA PLASTIC RECYCLING MARKET, BY PRODUCT, 2021-2031 ($MILLION)
    TABLE 67. INDIA PLASTIC RECYCLING MARKET, BY SOURCE, 2021-2031 ($MILLION)
    TABLE 68. INDIA PLASTIC RECYCLING MARKET, BY APPLICATION, 2021-2031 ($MILLION)
    TABLE 69. SOUTH KOREA PLASTIC RECYCLING MARKET, BY PRODUCT, 2021-2031 ($MILLION)
    TABLE 70. SOUTH KOREA PLASTIC RECYCLING MARKET, BY SOURCE, 2021-2031 ($MILLION)
    TABLE 71. SOUTH KOREA PLASTIC RECYCLING MARKET, BY APPLICATION, 2021-2031 ($MILLION)
    TABLE 72. AUSTRALIA PLASTIC RECYCLING MARKET, BY PRODUCT, 2021-2031 ($MILLION)
    TABLE 73. AUSTRALIA PLASTIC RECYCLING MARKET, BY SOURCE, 2021-2031 ($MILLION)
    TABLE 74. AUSTRALIA PLASTIC RECYCLING MARKET, BY APPLICATION, 2021-2031 ($MILLION)
    TABLE 75. REST OF ASIA-PACIFIC PLASTIC RECYCLING MARKET, BY PRODUCT, 2021-2031 ($MILLION)
    TABLE 76. REST OF ASIA-PACIFIC PLASTIC RECYCLING MARKET, BY SOURCE, 2021-2031 ($MILLION)
    TABLE 77. REST OF ASIA-PACIFIC PLASTIC RECYCLING MARKET, BY APPLICATION, 2021-2031 ($MILLION)
    TABLE 78. LAMEA PLASTIC RECYCLING MARKET, BY PRODUCT, 2021-2031 ($MILLION)
    TABLE 79. LAMEA PLASTIC RECYCLING MARKET, BY SOURCE, 2021-2031 ($MILLION)
    TABLE 80. LAMEA PLASTIC RECYCLING MARKET, BY APPLICATION, 2021-2031 ($MILLION)
    TABLE 81. LAMEA PLASTIC RECYCLING MARKET, BY COUNTRY, 2021-2031 ($MILLION)
    TABLE 82. BRAZIL PLASTIC RECYCLING MARKET, BY PRODUCT, 2021-2031 ($MILLION)
    TABLE 83. BRAZIL PLASTIC RECYCLING MARKET, BY SOURCE, 2021-2031 ($MILLION)
    TABLE 84. BRAZIL PLASTIC RECYCLING MARKET, BY APPLICATION, 2021-2031 ($MILLION)
    TABLE 85. SAUDI ARABIA PLASTIC RECYCLING MARKET, BY PRODUCT, 2021-2031 ($MILLION)
    TABLE 86. SAUDI ARABIA PLASTIC RECYCLING MARKET, BY SOURCE, 2021-2031 ($MILLION)
    TABLE 87. SAUDI ARABIA PLASTIC RECYCLING MARKET, BY APPLICATION, 2021-2031 ($MILLION)
    TABLE 88. UAE PLASTIC RECYCLING MARKET, BY PRODUCT, 2021-2031 ($MILLION)
    TABLE 89. UAE PLASTIC RECYCLING MARKET, BY SOURCE, 2021-2031 ($MILLION)
    TABLE 90. UAE PLASTIC RECYCLING MARKET, BY APPLICATION, 2021-2031 ($MILLION)
    TABLE 91. SOUTH AFRICA PLASTIC RECYCLING MARKET, BY PRODUCT, 2021-2031 ($MILLION)
    TABLE 92. SOUTH AFRICA PLASTIC RECYCLING MARKET, BY SOURCE, 2021-2031 ($MILLION)
    TABLE 93. SOUTH AFRICA PLASTIC RECYCLING MARKET, BY APPLICATION, 2021-2031 ($MILLION)
    TABLE 94. REST OF LAMEA PLASTIC RECYCLING MARKET, BY PRODUCT, 2021-2031 ($MILLION)
    TABLE 95. REST OF LAMEA PLASTIC RECYCLING MARKET, BY SOURCE, 2021-2031 ($MILLION)
    TABLE 96. REST OF LAMEA PLASTIC RECYCLING MARKET, BY APPLICATION, 2021-2031 ($MILLION)
    TABLE 97. VEOLIA: KEY EXECUTIVES
    TABLE 98. VEOLIA: COMPANY SNAPSHOT
    TABLE 99. REMONDIS SE & CO. KG: KEY EXECUTIVES
    TABLE 100. REMONDIS SE & CO. KG: COMPANY SNAPSHOT
    TABLE 101. BIFFA: KEY EXECUTIVES
    TABLE 102. BIFFA: COMPANY SNAPSHOT
    TABLE 103. STERICYCLE: KEY EXECUTIVES
    TABLE 104. STERICYCLE: COMPANY SNAPSHOT
    TABLE 105. REPUBLIC SERVICES, INC.: KEY EXECUTIVES
    TABLE 106. REPUBLIC SERVICES, INC.: COMPANY SNAPSHOT
    TABLE 107. SHELL INTERNATIONAL B.V.: KEY EXECUTIVES
    TABLE 108. SHELL INTERNATIONAL B.V.: COMPANY SNAPSHOT
    TABLE 109. WASTE CONNECTIONS, INC.: KEY EXECUTIVES
    TABLE 110. WASTE CONNECTIONS, INC.: COMPANY SNAPSHOT
    TABLE 111. CLEAN HARBORS, INC.: KEY EXECUTIVES
    TABLE 112. CLEAN HARBORS, INC.: COMPANY SNAPSHOT
    TABLE 113. COVETSRO AG: KEY EXECUTIVES
    TABLE 114. COVETSRO AG: COMPANY SNAPSHOT
    TABLE 115. BERRY GLOBAL GROUP INC: KEY EXECUTIVES
    TABLE 116. BERRY GLOBAL GROUP INC: COMPANY SNAPSHOT
  • LIST OF FIGURES

  • FIGURE 01. PLASTIC RECYCLING MARKET, 2021-2031
    FIGURE 02. SEGMENTATION OF PLASTIC RECYCLING MARKET, 2021-2031
    FIGURE 03. TOP INVESTMENT POCKETS IN PLASTIC RECYCLING MARKET (2022-2031)
    FIGURE 04. PORTER FIVE-1
    FIGURE 05. PORTER FIVE-2
    FIGURE 06. PORTER FIVE-3
    FIGURE 07. PORTER FIVE-4
    FIGURE 08. PORTER FIVE-5
    FIGURE 09. DRIVERS, RESTRAINTS AND OPPORTUNITIES: GLOBALPLASTIC RECYCLING MARKET
    FIGURE 10. IMPACT OF KEY REGULATION: PLASTIC RECYCLING MARKET
    FIGURE 11. MARKET SHARE ANALYSIS: PLASTIC RECYCLING MARKET
    FIGURE 12. PATENT ANALYSIS BY COMPANY
    FIGURE 13. PATENT ANALYSIS BY COUNTRY
    FIGURE 14. REGULATORY GUIDELINES: PLASTIC RECYCLING MARKET
    FIGURE 15. VALUE CHAIN ANALYSIS: PLASTIC RECYCLING MARKET
    FIGURE 16. PLASTIC RECYCLING MARKET, BY PRODUCT, 2021(%)
    FIGURE 17. COMPARATIVE SHARE ANALYSIS OF PLASTIC RECYCLING MARKET FOR POLYETHYLENE (PE), BY COUNTRY 2021 AND 2031(%)
    FIGURE 18. COMPARATIVE SHARE ANALYSIS OF PLASTIC RECYCLING MARKET FOR POLYETHYLENE TEREPHTHALATE (PET), BY COUNTRY 2021 AND 2031(%)
    FIGURE 19. COMPARATIVE SHARE ANALYSIS OF PLASTIC RECYCLING MARKET FOR POLYPROPYLENE (PP), BY COUNTRY 2021 AND 2031(%)
    FIGURE 20. COMPARATIVE SHARE ANALYSIS OF PLASTIC RECYCLING MARKET FOR POLYVINYL CHLORIDE (PVC), BY COUNTRY 2021 AND 2031(%)
    FIGURE 21. COMPARATIVE SHARE ANALYSIS OF PLASTIC RECYCLING MARKET FOR POLYSTYRENE (PS), BY COUNTRY 2021 AND 2031(%)
    FIGURE 22. COMPARATIVE SHARE ANALYSIS OF PLASTIC RECYCLING MARKET FOR OTHERS, BY COUNTRY 2021 AND 2031(%)
    FIGURE 23. PLASTIC RECYCLING MARKET, BY SOURCE, 2021(%)
    FIGURE 24. COMPARATIVE SHARE ANALYSIS OF PLASTIC RECYCLING MARKET FOR PLASTIC BOTTLES, BY COUNTRY 2021 AND 2031(%)
    FIGURE 25. COMPARATIVE SHARE ANALYSIS OF PLASTIC RECYCLING MARKET FOR PLASTIC FILMS, BY COUNTRY 2021 AND 2031(%)
    FIGURE 26. COMPARATIVE SHARE ANALYSIS OF PLASTIC RECYCLING MARKET FOR POLYMER FOAM, BY COUNTRY 2021 AND 2031(%)
    FIGURE 27. COMPARATIVE SHARE ANALYSIS OF PLASTIC RECYCLING MARKET FOR OTHERS, BY COUNTRY 2021 AND 2031(%)
    FIGURE 28. PLASTIC RECYCLING MARKET, BY APPLICATION, 2021(%)
    FIGURE 29. COMPARATIVE SHARE ANALYSIS OF PLASTIC RECYCLING MARKET FOR BUILDING AND CONSTRUCTION, BY COUNTRY 2021 AND 2031(%)
    FIGURE 30. COMPARATIVE SHARE ANALYSIS OF PLASTIC RECYCLING MARKET FOR PACKAGING, BY COUNTRY 2021 AND 2031(%)
    FIGURE 31. COMPARATIVE SHARE ANALYSIS OF PLASTIC RECYCLING MARKET FOR ELECTRICAL AND ELECTRONICS, BY COUNTRY 2021 AND 2031(%)
    FIGURE 32. COMPARATIVE SHARE ANALYSIS OF PLASTIC RECYCLING MARKET FOR TEXTILES, BY COUNTRY 2021 AND 2031(%)
    FIGURE 33. COMPARATIVE SHARE ANALYSIS OF PLASTIC RECYCLING MARKET FOR AUTOMOTIVE, BY COUNTRY 2021 AND 2031(%)
    FIGURE 34. COMPARATIVE SHARE ANALYSIS OF PLASTIC RECYCLING MARKET FOR OTHERS, BY COUNTRY 2021 AND 2031(%)
    FIGURE 35. PLASTIC RECYCLING MARKET BY REGION, 2021
    FIGURE 36. U.S. PLASTIC RECYCLING MARKET, 2021-2031 ($MILLION)
    FIGURE 37. CANADA PLASTIC RECYCLING MARKET, 2021-2031 ($MILLION)
    FIGURE 38. MEXICO PLASTIC RECYCLING MARKET, 2021-2031 ($MILLION)
    FIGURE 39. GERMANY PLASTIC RECYCLING MARKET, 2021-2031 ($MILLION)
    FIGURE 40. UK PLASTIC RECYCLING MARKET, 2021-2031 ($MILLION)
    FIGURE 41. FRANCE PLASTIC RECYCLING MARKET, 2021-2031 ($MILLION)
    FIGURE 42. SPAIN PLASTIC RECYCLING MARKET, 2021-2031 ($MILLION)
    FIGURE 43. ITALY PLASTIC RECYCLING MARKET, 2021-2031 ($MILLION)
    FIGURE 44. REST OF EUROPE PLASTIC RECYCLING MARKET, 2021-2031 ($MILLION)
    FIGURE 45. CHINA PLASTIC RECYCLING MARKET, 2021-2031 ($MILLION)
    FIGURE 46. JAPAN PLASTIC RECYCLING MARKET, 2021-2031 ($MILLION)
    FIGURE 47. INDIA PLASTIC RECYCLING MARKET, 2021-2031 ($MILLION)
    FIGURE 48. SOUTH KOREA PLASTIC RECYCLING MARKET, 2021-2031 ($MILLION)
    FIGURE 49. AUSTRALIA PLASTIC RECYCLING MARKET, 2021-2031 ($MILLION)
    FIGURE 50. REST OF ASIA-PACIFIC PLASTIC RECYCLING MARKET, 2021-2031 ($MILLION)
    FIGURE 51. BRAZIL PLASTIC RECYCLING MARKET, 2021-2031 ($MILLION)
    FIGURE 52. SAUDI ARABIA PLASTIC RECYCLING MARKET, 2021-2031 ($MILLION)
    FIGURE 53. UAE PLASTIC RECYCLING MARKET, 2021-2031 ($MILLION)
    FIGURE 54. SOUTH AFRICA PLASTIC RECYCLING MARKET, 2021-2031 ($MILLION)
    FIGURE 55. REST OF LAMEA PLASTIC RECYCLING MARKET, 2021-2031 ($MILLION)
    FIGURE 56. TOP WINNING STRATEGIES, BY YEAR
    FIGURE 57. TOP WINNING STRATEGIES, BY DEVELOPMENT
    FIGURE 58. TOP WINNING STRATEGIES, BY COMPANY
    FIGURE 59. PRODUCT MAPPING OF TOP 10 PLAYERS
    FIGURE 60. COMPETITIVE DASHBOARD
    FIGURE 61. COMPETITIVE HEATMAP: PLASTIC RECYCLING MARKET
    FIGURE 62. TOP PLAYER POSITIONING, 2021


PURCHASE OPTIONS

Call or Email us

U.S.-Canada Toll-free: +1-800-792-5285
Int'l : +1-503-894-6022
Europe : +44-845-528-1300
Email : help@alliedmarketresearch.com
 
FREQUENTLY ASKED QUESTIONS?

A. The stringent environmental norms & standards are a major factor responsible for market growth. Other factors boosting the plastic recycling industry are demand from building & construction, automotive, packaging, e-commerce, and other industries.

A. The major growth strategies adopted by plastic recycling market players are acquiring small & medium sized plastic recycling players to expand their geographical reach.

A. Asia-Pacific is expected to provide more business opportunities for the global plastic recycling market in future.

A. REMONDIS SE & Co. KG, Veolia, Waste Connections are the major players in the plastic recycling market.

A. By product, the polyethylene terephthalate (PET) acquired the maximum share of the global plastic recycling market in 2021.

A. Automotive industry is the major customer in the global plastic recycling market.

A. The report provides an extensive qualitative and quantitative analysis of the current trends and future estimations of the global plastic recycling market from 2021 to 2031 to determine the prevailing opportunities.

Looking for Customization?

 Customization Request

Have a Question?

 Speak with Analyst

Any Confusion?

 Inquire Before Buying

Have a glance of the Report

  Request Sample
RELATED TAGS

Purchase Full Report of
Plastic Recycling Market

Start reading instantly.
This Report and over 67,404+ more Reports, Available with Avenue Library. T&C*.

  • Online Only
  • $3,570
  • Online cloud access only
  • Restricted print, copy, paste & download
  • Read only
  • Free industry update
    (Within 180 days)
  • Free report update in next update cycle
    (Apr 2024 - Apr 2025)
  • Data Pack
  • $3,840
  • Restricted to one authorized user
  • One print only
  • Available in
    Excel
  • Free industry update
    (Within 180 days)
  •   Free report update in next update cycle
    (Apr 2024 - Apr 2025)
  • Single User
  • $5,730
  • Restricted to one authorized user
  • One print only
  • Available in
    PDF
  • Free industry update
    (Within 180 days)
  •   Free report update in next update cycle
    (Apr 2024 - Apr 2025)
  • Five Users
  • $6,450
  • Limited to five authorized users
  • Print upto five copies
  • Available in
    PDF
  • Free industry update
    (Within 180 days)
  •   Free report update in next update cycle
    (Apr 2024 - Apr 2025)
  • Enterprise
    License/PDF

  • $9,600
  • Unlimited
    within
    company/enterprise
  • Available in Excel & PDF
  • Free industry update
    (Within 180 days)
  •   Free report update in next update cycle
    (Apr 2024 - Apr 2025)
  • Library
    Membership

  • $999 $ 1,175
    Per User/ Per month/ Billed annually
  • Published Content
    E-access
  • Company Profiles
    E-access
  • Newly Added Content Access
  • 10 PDF
    Downloads
  • 5 Excel Data
    Pack Downloads
  • 250 Company Profiles PDF Downloads
  • Buy Now

*Taxes/Fees, if applicable will be added during checkout. All prices in USD

RELATED REPORTS
 

Why Allied Market Research?


Infallible Methodology

To ensure high-level data integrity, accurate analysis, and impeccable forecasts

Analyst Support

For complete satisfaction

Customization

On-demand customization of scope of the report to exactly meet your needs

TARGETED MARKET VIEW

Targeted market view to provide pertinent information and save time of readers

Get fresh content delivered

Get insights on topics that are crucial for your business. Stay abreast of your interest areas.

Get Industry Data Alerts

Why Allied Market Research?

Infallible Methodology

To ensure high-level data integrity, accurate analysis, and impeccable forecasts

Analyst Support

For complete satisfaction

Customization

On-demand customization of scope of the report to exactly meet your needs

TARGETED MARKET VIEW

Targeted market view to provide pertinent information and save time of readers