0
2022
Power-to-gas Market

Power-to-gas Market

by Technology (Electrolysis, Methanation), by Capacity (Less than 100 kW, 100-999 kW, 1000 kW and Above), by Use Case (Wind, Solar, Biomass), by Application (Residential, Commercial, Utility): Global Opportunity Analysis and Industry Forecast, 2021-2031

Report Code: A15975
Jul 2022 | Pages: 286
Tables: 195
Charts: 62
  • Formats*:

  • pdf

    Single User License, Five User
    License & Enterprise User License

  • xls

    Data Pack Excel License

  • ppt

    It comes with the additional cost
    of $2500.00 contact sales.


Power-to-gas Market Research, 2031

The global power-to-gas market size was valued at $30.3 million in 2021, and is power-to-gas industry is projected to reach $84.4 million by 2031, growing at a CAGR of 10.8% from 2022 to 2031.

After the global vaccination, governments of various countries have taken initiatives to increase the investment in the renewable energy related industries, especially solar and wind power systems. Increase in investment is mostly to improve the national energy security during the pandemic and other crisis. The presence of above mentioned activities and change in policies due to the outbreak of the COVID-19 pandemic have positive impact on the development of the market during the forecast period.

Power-to-gas Market, Power-to-gas Industry, Power-to-gas Market Size, Power-to-gas Market Share, Power-to-gas Market Growth, Power-to-gas Market Analysis, Power-to-gas Market Forecast, Power-to-gas Market Trends

The power-to-gas market is segmented into Technology, Capacity, Use Case and Application.

Power-to-gas technology adopts the electrolysis process to produce hydrogen gas from renewable or excess electricity that is available. The first step in the process is to produce synthetic hydrogen (H2) from water and renewable power via electrolysis. This hydrogen can be used directly as a final energy carrier or converted to methane, synthesis gas, electricity, liquid fuels, or chemicals during the second stage process. Under the second stage process, hydrogen reacts with carbon dioxide to produce methane.

Power to gas system is an effective way of integrating renewables sources with power generation sources. The aim of this technology is to store energy for long term by converting it to other easily storable energy carriers, and at the same time reduces the load on the electricity grid by controlling operations. The converted hydrogen and methane can also be converted back into electricity, as it can be used as backup power source.

The increase in demand for renewable hydrogen, which has the potential to decarbonize multiple sectors is expected to drive the market growth. The driver for the growth of the market is the cost reduction of the electrolyzer technology. According to the International Energy Agency, the electrolyzer stacks are responsible for 50% and 60% of the capital expenditure, and remaining factors like power electronics, gas-conditioning, and plant components are accounting for the remainder of the expenditure, which is a factor hampering the power-to-gas market growth.

Air quality regulations are increasing the need for hydrogen as a clean fuel for clean transport emissions across the globe. Energy storage provision has started to become an obligatory requirement in areas, including California. The grid balancing and rapid response demand-side services are offering high proportion of integration of renewable energy supply. Also, auto OEMs are rolling out Fuel Cell Electric Vehicles (FCEVs), which require high purity hydrogen fuel. The Global Hydrogen Refuelling Station infrastructure programmes are underway with remarkable deployment plans. In addition, the price volatility of fossil fuels is driving an industrial substitution to more sustainable chemical processes, which is the major factor augmenting the growth of the power to gas market.

The presence of the latest development in the hydrogen production technology, and hydrogen engine technology is expected to have a positive impact on the growth of the market. For instance, The Hydrogen Council, a CEO-led Initiative of 92 global companies to develop the hydrogen economy, published report on January 19, 2021, which says that low carbon hydrogen supply at scale is economically and environmentally feasible. ThyssenKrupp AG is currently setting up a new facility in Varennes, Québec, Canada, with an aim to generate 11,100 metric tons of green hydrogen per year. On January 13, 2021, Linde PLC Company announced that it plans to build the world‐™s largest electrolyzer plant by the third quarter of 2022. According to the EU member states, the target for complete hydrogen mobility is expected to be completed by 2030. Majority of hydrogen required is anticipated to be supplied by power-to-gas companies.

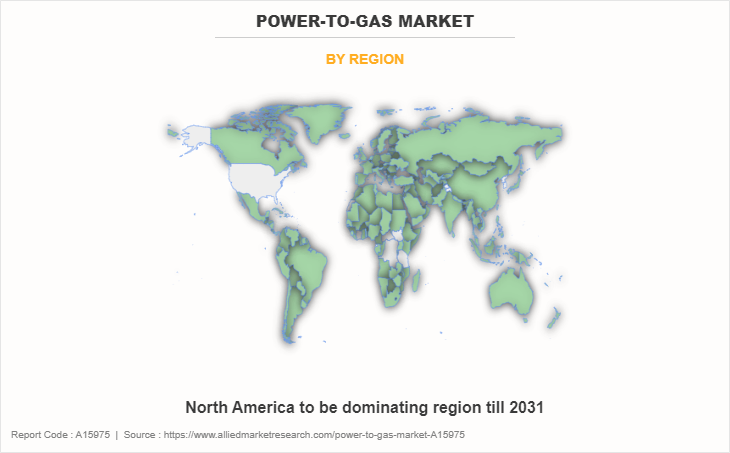
On the basis of technology, the market is segmented into electrolysis and methanation. On the basis of capacity, the market is bifurcated into less than 100KW, 100-999KW, and 1000KW and above. On the basis of use case, the market is segmented into wind, solar, and biomass. On the basis of application, the market is segmented into residential, commercial, and utility. Region-wise, the market is studied across North America, Europe, Asia-Pacific, and LAMEA. Presently, Europe accounts for the largest power-to-gas market share, followed by North America and Asia-Pacific.

The major companies profiled in this report include, Hydrogenics, ITM Power, McPhy Energy, Siemens AG, MAN Energy Solutions, Nel Hydrogen, ThyssenKrupp, Electrochaea, Exytron, GreenHydrogen, Hitachi Zosen Inova Etogas, Fuelcell Energy, Avacon, Carbotech, and Aquahydrex. Rapid development of industrialization and modernization and exhaustion of fossil fuel resources have led to the innovation of alternative fuels such as hydrogen. The increase in the demand for hydrogen in various sectors has fuelled the growth of power to gas market. Additional growth strategies such as expansion of production capacities, acquisition, partnership, and research & innovation in the solar energy application have led to attain key developments in the global power to gas market trends.
Power-to-gas Market
By Region

2031
Europe 
North America
Asia-Pacific
LAMEA

North America to be dominating region till 2031

Get more information on this report : Request Sample Pages

The Europe market is shared between various countries such as France, Germany, Italy, Spain, UK, and others. Germany, Italy, and UK are countries in Europe that use the most solar energy. The presence of stringent regulations regarding the reduction of carbon footprint across the country and rapid development in recent years, which lead to surpassing the expectations in terms of steep cost reduction, user-friendliness, and its commercial applications in variety of sector have fuelled manufacturers to expand their manufacturing capabilities. Intense R&D activities and the pressure of people awareness regarding the prospects of hydrogen fuel cell on environment have a positive impact on the market growth. European Union and various national associations with corporate members are helping policy makers to enable power to gas technology to deliver its immense potential to meet the EU‐™s 2030 targets, while providing maximum benefit for Europe‐™s climate, and significantly contribute to the European Green Deal. Technological advances and lower costs of capital have propelled renewables into the mainstream energy market. Furthermore, the boom of green investments in Europe and the ambitious policies are expected to dominate the global renewable energy in terms of capacity, technology development, and energy demand. The above mentioned initiatives are major factors expected to drive the power-to-gas market forecast growth in this region during the forecast period.
Power-to-gas Market
By Technology

Your browser does not support the canvas element.

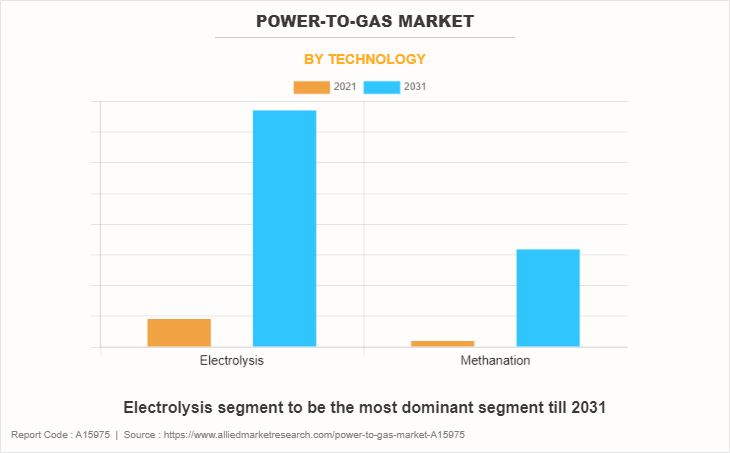
Electrolysis segment to be the most dominant segment till 2031

Get more information on this report : Request Sample Pages

The electrolysis segment dominates the global power to gas market. Electrolysis is a process where hydrogen is produced from the splitting of water molecules and does not involve fossil fuels. Hydrogen generated from this kind of process is generally known as green hydrogen but this method is generally more expensive than the fossil-fuel production method.

The increase in awareness among the people regarding the greenhouse gases and increasing demand for the energy and fossil fuels have driven the growth of the electrolysis process in the power to gas market. Around 4% of global hydrogen production came from electrolysis in 2020, which was around 8GW. The rapid development in various technologies and electrical efficiency of these hydrogen generators are important factors for the growth of the hydrogen production technology. Increase in investment among the developing countries across the globe towards the production of green hydrogen to reach net zero carbon targets by 2050 have driven the market.
Power-to-gas Market
By Capacity

Your browser does not support the canvas element.

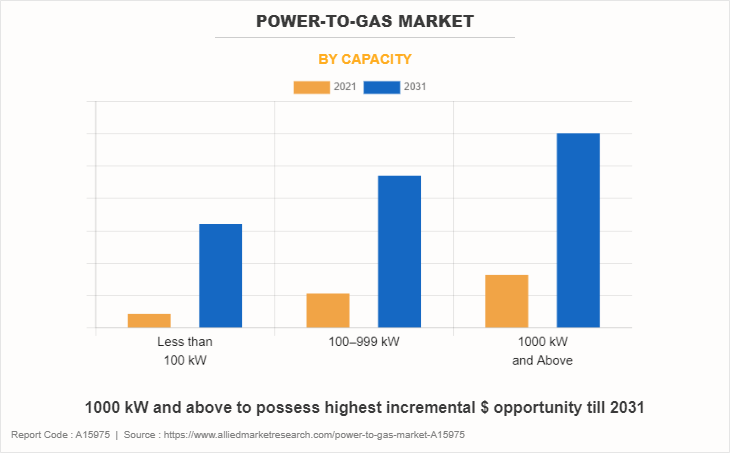
1000 kW and above to possess highest incremental $ opportunity till 2031

Get more information on this report : Request Sample Pages

The 1000KW and above segment dominates the global power to gas market. Above 1000KW capacity of power to gas technology is used in large scale utilities or industries, which are heavy consumers of electricity. The need for power for manufacturing various chemical industries, automotive industries, and others have led to the search for efficient alternative to provide clean energy source for sustainability.

The presence of various advantages of utilization of the renewable energy sources to power various industries and in the presence of low demand for power, the excess energy generated from the renewable power plants are converted to valuable fuels through power to gas technology for future utilization. Such factors are expected to drive the growth of the market.
Power-to-gas Market
By Use Case

Your browser does not support the canvas element.

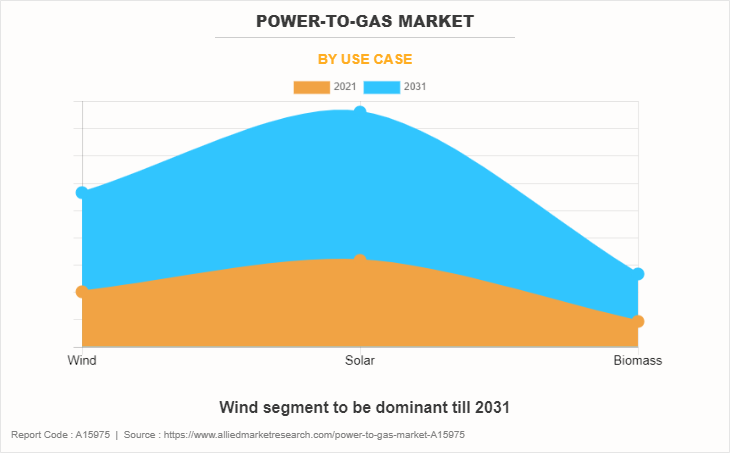
Wind segment to be dominant till 2031

Get more information on this report : Request Sample Pages

The solar segment dominates the global power to gas market. The rapid industrialization and decrease in fossil fuel resources across the globe have led to demand for alternative fuel source such as hydrogen. Increase in the utilization hydrogen in green energy vehicle, such as hydrogen car is also a factor driving the growth of the market. Rise in demand and need for efficient energy storage technology has led to the demand for the power to gas technology products in various power consuming industry.

The increase in the demand for power due to rapid industrialization and modernization has propelled the application of solar energy sector. The application of solar power generation devices in large scale malls and other commercial buildings need highly efficient storage systems and low cost solar panels to generate power at its peak demand, which is a major reason for the growth of the solar energy industry. Hence, storing electricity during off peak period in remote areas or during seasonal variations is a major factor driving the utilization of solar in the power to gas market.
Power-to-gas Market
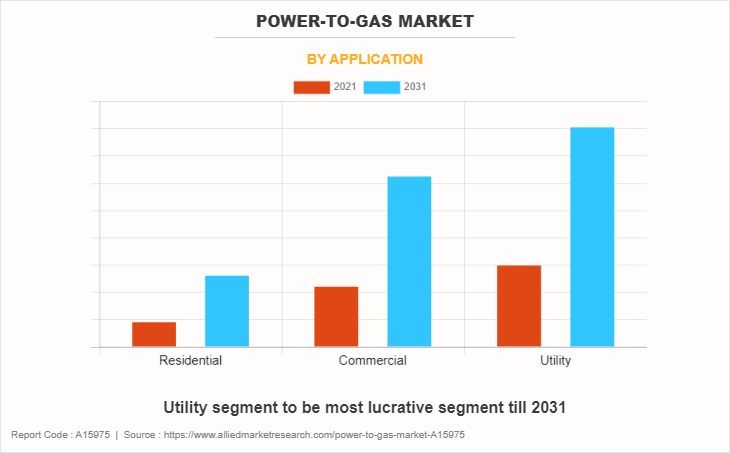
By Application

Your browser does not support the canvas element.

Utility segment to be most lucrative segment till 2031

Get more information on this report : Request Sample Pages

The utility segment dominates the global power to gas market. Large scale wind & solar farms generate huge amount of renewable energy. During the peak utilization time, energy generated from these renewable energy sources is directly fed to the power gird or is used by manufacturing companies and nearby residential complexes.  Power to gas technology is used to save excess renewable energy in an efficient way, where electricity is used to power electrolyser and produce hydrogen, which can be used to produce various commercial gases such as methane.

The rapid industrialization and decrease in fossil fuel resources across the globe have led to demand for alternative fuel sources, such as hydrogen. Increase in utilization of hydrogen in green energy vehicle, such as hydrogen car is also a factor driving the growth of the market. The rise in demand and need for efficient energy storage technology has led to the demand for the power to gas products in various power consuming industries. The wide range of utilization of hydrogen in various industrial applications provide ample opportunities for the growth of the power to gas market. 

COVID-19 analysis:

COVID-19 has severely impacted the global economy with devastating effects on global trade, which has simultaneously affected households, business, financial institution, industrial establishments, and infrastructure companies. The novel coronavirus has affected several economies and caused lockdown in many countries, which has limited the growth of the market. The COVID-19 pandemic has had a severe impact on the power to gas market. There is a significant drop in demand in the global gas market. Chemical production, transportation, and industrial production industries were hampered for around four to six months due to the COVID-19 pandemic. The current expansion plans of electrolysis and methanation have been delayed by minimum one year. In the long term, the pandemic may prove to be beneficial to the power to gas market. Global governments are expected to focus on green gas and reduction of harmful emissions into the environment.

After the global vaccination, governments of various countries have taken initiatives to increase the investment in the renewable energy related industries, especially solar and wind power systems. Increase in investment is mostly to improve the national energy security during the pandemic and other crisis. The presence of above mentioned activities and change in policies due to the outbreak of the COVID-19 pandemic have positive impact on the development of the market during the forecast period.

Key Benefits For Stakeholders

  • This report provides a quantitative analysis of the market segments, current trends, estimations, and dynamics of the power-to-gas market analysis from 2021 to 2031 to identify the prevailing power-to-gas market opportunities.
  • The market research is offered along with information related to key drivers, restraints, and opportunities.
  • Porter's five forces analysis highlights the potency of buyers and suppliers to enable stakeholders make profit-oriented business decisions and strengthen their supplier-buyer network.
  • In-depth analysis of the power-to-gas market segmentation assists to determine the prevailing market opportunities.
  • Major countries in each region are mapped according to their revenue contribution to the global market.
  • Market player positioning facilitates benchmarking and provides a clear understanding of the present position of the market players.
  • The report includes the analysis of the regional as well as global power-to-gas market trends, key players, market segments, application areas, and market growth strategies.

Power-to-gas Market Report Highlights

Aspects Details
By Technology
  • Electrolysis
  • Methanation
By Capacity
  • Less than 100 kW
  • 100–999 kW
  • 1000 kW and Above
By Use Case
  • Wind
  • Solar
  • Biomass
By Application
  • Residential
  • Commercial
  • Utility
By Region
  • North America  (U.S., Canada, Mexico)
  • Europe  (Germany, U.K., France, Italy, Spain, Rest of Europe)
  • Asia-Pacific  (China, Japan, India, South Korea, Rest Of Asia Pacific)
  • LAMEA  (Brazil, Saudi Arabia, South Africa, Rest of LAMEA)
Key Market Players Nel Hydrogen, McPhy Energy, GreenHydrogen, Fuelcell Energy, Hydrogenics, Avacon, ThyssenKrupp, MAN Energy Solutions, Carbotech, Exytron, Electrochaea, Aquahydrex, ITM Power, Hitachi Zosen Inova Etogas, Siemens AG
 

CHAPTER 1: INTRODUCTION

1.1. Report description
1.2. Key benefits for stakeholders
1.3. Key market segments
1.4. Research methodology

1.4.1. Secondary research
1.4.2. Primary research

1.5. Analyst tools and models

CHAPTER 2: EXECUTIVE SUMMARY

2.1. Key findings of the study
2.2. CXO perspective

CHAPTER 3: MARKET OVERVIEW

3.1. Market definition and scope
3.2. Key findings

3.2.1. Top investment pockets

3.3. Porter’s five forces analysis
3.4. Market dynamics

3.4.1. Drivers

3.4.1.1. Regulations to promote hydrogen production technologies
3.4.1.2. Increase in market share of renewable energy in power generation
3.4.1.3. Increase in utilization of hydrogen and CNG in transportation sector

3.4.2. Restraints

3.4.2.1. Loss of energy and presence of low-cost batteries

3.4.3. Opportunities

3.4.3.1. Development of various eco-friendly power-to-gas production technologies

3.5. Value chain analysis
3.6. Impact of key regulations on the global power-to-gas market
3.7. Impact of COVID-19 on global power-to-gas market

CHAPTER 4: POWER-TO-GAS MARKET, BY TECHNOLOGY

4.1. Overview

4.1.1. Market size and forecast

4.2. Electrolysis

4.2.1. Key market trends, growth factors, and opportunities
4.2.2. Market size and forecast, by region
4.2.3. Comparative share analysis, by country

4.3. Methanation

4.3.1. Key market trends, growth factors, and opportunities
4.3.2. Market size and forecast, by region
4.3.3. Comparative share analysis, by country

CHAPTER 5: POWER-TO-GAS MARKET, BY CAPACITY

5.1. Overview

5.1.1. Market size and forecast

5.2. Less than 100 kW

5.2.1. Key market trends, growth factors, and opportunities
5.2.2. Market size and forecast, by region
5.2.3. Comparative Share Analysis by Country

5.3. 100–999 kW

5.3.1. Key market trends, growth factors, and opportunities
5.3.2. Market size and forecast, by region
5.3.3. Comparative share analysis by country

5.4. 1000 kW and above

5.4.1. Key market trends, growth factors, and opportunities
5.4.2. Market size and forecast, by region
5.4.3. Comparative Share Analysis by Country

CHAPTER 6: POWER-TO-GAS MARKET, BY USE CASE

6.1. Overview

6.1.1. Market size and forecast

6.2. Wind

6.2.1. Key market trends, growth factors, and opportunities
6.2.2. Market size and forecast, by region
6.2.3. Comparative Share Analysis by Country

6.3. Solar

6.3.1. Key market trends, growth factors, and opportunities
6.3.2. Market size and forecast, by region
6.3.3. Comparative share analysis by country

6.4. Biomass

6.4.1. Key market trends, growth factors, and opportunities
6.4.2. Market size and forecast, by region
6.4.3. Comparative share analysis by country

CHAPTER 7: POWER-TO-GAS MARKET, BY APPLICATION

7.1. Overview

7.1.1. Market size and forecast

7.2. Residential

7.2.1. Key market trends, growth factors, and opportunities
7.2.2. Market size and forecast, by region
7.2.3. Comparative Share Analysis by Country

7.3. Commercial

7.3.1. Key market trends, growth factors, and opportunities
7.3.2. Market size and forecast, by region
7.3.3. Comparative share analysis by country

7.4. Utility

7.4.1. Key market trends, growth factors, and opportunities
7.4.2. Market size and forecast, by region
7.4.3. Comparative Share Analysis by Country

CHAPTER 8: POWER-TO-GAS MARKET, BY REGION

8.1. Overview

8.1.1. Market size and forecast, by region

8.2. North America

8.2.1. Key market trends, growth factors, and opportunities
8.2.2. Market size and forecast, by technology
8.2.3. Market size and forecast, by capacity
8.2.4. Market size and forecast, by use case
8.2.5. Market size and forecast, by application
8.2.6. Market analysis, by country

8.2.6.1. U.S.

8.2.6.1.1. Market size and forecast, by technology
8.2.6.1.2. Market size and forecast, by capacity
8.2.6.1.3. Market size and forecast, by use case
8.2.6.1.4. Market size and forecast, by application

8.2.6.2. Canada

8.2.6.2.1. Market size and forecast, by technology
8.2.6.2.2. Market size and forecast, by capacity
8.2.6.2.3. Market size and forecast, by use case
8.2.6.2.4. Market size and forecast, by application

8.2.6.3. Mexico

8.2.6.3.1. Market size and forecast, by technology
8.2.6.3.2. Market size and forecast, by capacity
8.2.6.3.3. Market size and forecast, by use case
8.2.6.3.4. Market size and forecast, by application

8.3. Europe

8.3.1. Key market trends, growth factors, and opportunities
8.3.2. Market size and forecast, by technology
8.3.3. Market size and forecast, by capacity
8.3.4. Market size and forecast, by use case
8.3.5. Market size and forecast, by application
8.3.6. Market analysis, by country

8.3.6.1. Germany

8.3.6.1.1. Market size and forecast, by technology
8.3.6.1.2. Market size and forecast, by capacity
8.3.6.1.3. Market size and forecast, by use case
8.3.6.1.4. Market size and forecast, by application

8.3.6.2. UK

8.3.6.2.1. Market size and forecast, by technology
8.3.6.2.2. Market size and forecast, by capacity
8.3.6.2.3. Market size and forecast, by use case
8.3.6.2.4. Market size and forecast, by application

8.3.6.3. France

8.3.6.3.1. Market size and forecast, by technology
8.3.6.3.2. Market size and forecast, by capacity
8.3.6.3.3. Market size and forecast, by use case
8.3.6.3.4. Market size and forecast, by application

8.3.6.4. Italy

8.3.6.4.1. Market size and forecast, by technology
8.3.6.4.2. Market size and forecast, by capacity
8.3.6.4.3. Market size and forecast, by use case
8.3.6.4.4. Market size and forecast, by application

8.3.6.5. Spain

8.3.6.5.1. Market size and forecast, by technology
8.3.6.5.2. Market size and forecast, by capacity
8.3.6.5.3. Market size and forecast, by use case
8.3.6.5.4. Market size and forecast, by application

8.3.6.6. Rest of Europe

8.3.6.6.1. Market size and forecast, by technology
8.3.6.6.2. Market size and forecast, by capacity
8.3.6.6.3. Market size and forecast, by use case
8.3.6.6.4. Market size and forecast, by application

8.4. Asia-Pacific

8.4.1. Key market trends, growth factors, and opportunities
8.4.2. Market size and forecast, by technology
8.4.3. Market size and forecast, by capacity
8.4.4. Market size and forecast, by use case
8.4.5. Market size and forecast, by application
8.4.6. Market analysis, by country

8.4.6.1. China

8.4.6.1.1. Market size and forecast, by technology
8.4.6.1.2. Market size and forecast, by capacity
8.4.6.1.3. Market size and forecast, by use case
8.4.6.1.4. Market size and forecast, by application

8.4.6.2. Japan

8.4.6.2.1. Market size and forecast, by technology
8.4.6.2.2. Market size and forecast, by capacity
8.4.6.2.3. Market size and forecast, by use case
8.4.6.2.4. Market size and forecast, by application

8.4.6.3. India

8.4.6.3.1. Market size and forecast, by technology
8.4.6.3.2. Market size and forecast, by capacity
8.4.6.3.3. Market size and forecast, by use case
8.4.6.3.4. Market size and forecast, by application

8.4.6.4. South Korea

8.4.6.4.1. Market size and forecast, by technology
8.4.6.4.2. Market size and forecast, by capacity
8.4.6.4.3. Market size and forecast, by use case
8.4.6.4.4. Market size and forecast, by application

8.4.6.5. Rest of Asia-Pacific

8.4.6.5.1. Market size and forecast, by technology
8.4.6.5.2. Market size and forecast, by capacity
8.4.6.5.3. Market size and forecast, by use case
8.4.6.5.4. Market size and forecast, by application

8.5. LAMEA

8.5.1. Key market trends, growth factors, and opportunities
8.5.2. Market size and forecast, by technology
8.5.3. Market size and forecast, by capacity
8.5.4. Market size and forecast, by use case
8.5.5. Market size and forecast, by application
8.5.6. Market analysis, by country

8.5.6.1. Brazil

8.5.6.1.1. Market size and forecast, by technology
8.5.6.1.2. Market size and forecast, by capacity
8.5.6.1.3. Market size and forecast, by use case
8.5.6.1.4. Market size and forecast, by application

8.5.6.2. Saudi Arabia

8.5.6.2.1. Market size and forecast, by technology
8.5.6.2.2. Market size and forecast, by capacity
8.5.6.2.3. Market size and forecast, by use case
8.5.6.2.4. Market size and forecast, by application

8.5.6.3. South Africa

8.5.6.3.1. Market size and forecast, by technology
8.5.6.3.2. Market size and forecast, by capacity
8.5.6.3.3. Market size and forecast, by use case
8.5.6.3.4. Market size and forecast, by application

8.5.6.4. Rest of LAMEA

8.5.6.4.1. Market size and forecast, by technology
8.5.6.4.2. Market size and forecast, by capacity
8.5.6.4.3. Market size and forecast, by use case
8.5.6.4.4. Market size and forecast, by application

CHAPTER 9: COMPETITIVE LANDSCAPE

9.1. Introduction

9.1.1. Market player positioning, 2021

9.2. Top winning strategies

9.2.1. Top winning strategies, by year
9.2.2. Top winning strategies, by development
9.2.3. Top winning strategies, by company

9.3. Key developments

9.3.1. Key collaborations
9.3.2. Key acquisitions
9.3.3. Key business expansions

CHAPTER 10: COMPANY PROFILES

10.1. AVACON AG

10.1.1. Company overview
10.1.2. Key executives
10.1.3. Company snapshot
10.1.4. Product portfolio
10.1.5. Key strategic moves and developments

10.2. AQUAHYDREX

10.2.1. Company overview
10.2.2. Key executives
10.2.3. Company snapshot
10.2.4. Product portfolio

10.3. CARBOTECH

10.3.1. Company overview
10.3.2. Key executives
10.3.3. Company snapshot
10.3.4. Product portfolio
10.3.5. Key strategic moves and developments

10.4. ELECTROCHAEA GMBH

10.4.1. Company overview
10.4.2. Key executives
10.4.3. Company snapshot
10.4.4. Product portfolio
10.4.5. Key strategic moves and developments

10.5. EXYTRON GMBH

10.5.1. Company overview
10.5.2. Key executives
10.5.3. Company snapshot
10.5.4. Product portfolio

10.6. FUELCELL ENERGY INC.

10.6.1. Company overview
10.6.2. Key executives
10.6.3. Company snapshot
10.6.4. Operating business segments
10.6.5. Product portfolio
10.6.6. Business performance
10.6.7. Key strategic moves and developments

10.7. GREEN HYDROGEN SYSTEMS

10.7.1. Company overview
10.7.2. Key executives
10.7.3. Company snapshot
10.7.4. Product portfolio
10.7.5. Business performance
10.7.6. Key strategic moves and developments

10.8. HITACHI ZOSEN INOVA AG

10.8.1. Company overview
10.8.2. Key executives
10.8.3. Company snapshot
10.8.4. Product portfolio
10.8.5. Key strategic moves and developments

10.9. HYDROGENICS

10.9.1. Company overview
10.9.2. Key executives
10.9.3. Company snapshot
10.9.4. Product portfolio
10.9.5. Key strategic moves and developments

10.10. ITM POWER

10.10.1. Company overview
10.10.2. Key executives
10.10.3. Company snapshot
10.10.4. Product portfolio
10.10.5. Business performance
10.10.6. Key strategic moves and developments

10.11. SIEMENS AG

10.11.1. Company overview
10.11.2. Key executives
10.11.3. Company snapshot
10.11.4. Product portfolio
10.11.5. Operating business segments
10.11.6. R&D expenditure
10.11.7. Business performance

10.12. MAN ENERGY SOLUTIONS SE

10.12.1. Company overview
10.12.2. Key executives
10.12.3. Company snapshot
10.12.4. Product portfolio
10.12.5. Key strategic moves and developments

10.13. MCPHY ENERGY S.A.

10.13.1. Company overview
10.13.2. Key executives
10.13.3. Company snapshot
10.13.4. Product portfolio
10.13.5. Business performance
10.13.6. Key strategic moves and developments

10.14. NEL HYDROGEN

10.14.1. Company overview
10.14.2. Key executives
10.14.3. Company snapshot
10.14.4. Product portfolio
10.14.5. Key strategic moves and developments

10.15. THYSSENKRUPP AG

10.15.1. Company overview
10.15.2. Key executives
10.15.3. Company snapshot
10.15.4. Operating business segments
10.15.5. Product portfolio
10.15.6. Business performance
 

LIST OF TABLES

  • TABLE 01. POWER-TO-GAS MARKET, BY TECHNOLOGY, 2021-2031 ($THOUSAND)
    TABLE 02. POWER-TO-GAS MARKET REVENUE, FOR ELECTROLYSIS, BY REGION , 2021-2031 ($THOUSAND)
    TABLE 03. POWER-TO-GAS MARKET REVENUE, FOR METHANATION, BY REGION , 2021-2031 ($THOUSAND)
    TABLE 04. POWER-TO-GAS MARKET, BY CAPACITY, 2021-2031 ($THOUSAND)
    TABLE 05. POWER-TO-GAS MARKET REVENUE, FOR LESS THAN 100 KW, BY REGION , 2021-2031 ($THOUSAND)
    TABLE 06. POWER-TO-GAS MARKET REVENUE, FOR 100–999 KW, BY REGION , 2021-2031 ($THOUSAND)
    TABLE 07. POWER-TO-GAS MARKET REVENUE, FOR 1000 KW AND ABOVE, BY REGION , 2021-2031 ($THOUSAND)
    TABLE 08. POWER-TO-GAS MARKET, BY USE CASE, 2021-2031 ($THOUSAND)
    TABLE 09. POWER-TO-GAS MARKET REVENUE, FOR WIND, BY REGION , 2021-2031 ($THOUSAND)
    TABLE 10. POWER-TO-GAS MARKET REVENUE, FOR SOLAR, BY REGION , 2021-2031 ($THOUSAND)
    TABLE 11. POWER-TO-GAS MARKET REVENUE, FOR BIOMASS, BY REGION , 2021-2031 ($THOUSAND)
    TABLE 12. POWER-TO-GAS MARKET, BY APPLICATION, 2021-2031 ($THOUSAND)
    TABLE 13. POWER-TO-GAS MARKET REVENUE, FOR RESIDENTIAL, BY REGION , 2021-2031 ($THOUSAND)
    TABLE 14. POWER-TO-GAS MARKET REVENUE, FOR COMMERCIAL, BY REGION , 2021-2031 ($THOUSAND)
    TABLE 15. POWER-TO-GAS MARKET REVENUE, FOR UTILITY, BY REGION , 2021-2031 ($THOUSAND)
    TABLE 16. POWER-TO-GAS MARKET, BY REGION, 2021-2031 ($THOUSAND)
    TABLE 17. NORTH AMERICA POWER-TO-GAS MARKET, BY TECHNOLOGY, 2021-2031 ($THOUSAND)
    TABLE 18. NORTH AMERICA POWER-TO-GAS MARKET, BY CAPACITY, 2021-2031 ($THOUSAND)
    TABLE 19. NORTH AMERICA POWER-TO-GAS MARKET, BY USE CASE, 2021-2031 ($THOUSAND)
    TABLE 20. NORTH AMERICA POWER-TO-GAS MARKET, BY APPLICATION, 2021-2031 ($THOUSAND)
    TABLE 21. NORTH AMERICA POWER-TO-GAS MARKET, BY COUNTRY, 2021-2031 ($THOUSAND)
    TABLE 22. U.S. POWER-TO-GAS MARKET BY TECHNOLOGY 2021-2031 ($THOUSAND)
    TABLE 23. U.S. POWER-TO-GAS MARKET BY CAPACITY 2021-2031 ($THOUSAND)
    TABLE 24. U.S. POWER-TO-GAS MARKET BY USE CASE 2021-2031 ($THOUSAND)
    TABLE 25. U.S. POWER-TO-GAS MARKET BY APPLICATION 2021-2031 ($THOUSAND)
    TABLE 26. CANADA POWER-TO-GAS MARKET BY TECHNOLOGY 2021-2031 ($THOUSAND)
    TABLE 27. CANADA POWER-TO-GAS MARKET BY CAPACITY 2021-2031 ($THOUSAND)
    TABLE 28. CANADA POWER-TO-GAS MARKET BY USE CASE 2021-2031 ($THOUSAND)
    TABLE 29. CANADA POWER-TO-GAS MARKET BY APPLICATION 2021-2031 ($THOUSAND)
    TABLE 30. MEXICO POWER-TO-GAS MARKET BY TECHNOLOGY 2021-2031 ($THOUSAND)
    TABLE 31. MEXICO POWER-TO-GAS MARKET BY CAPACITY 2021-2031 ($THOUSAND)
    TABLE 32. MEXICO POWER-TO-GAS MARKET BY USE CASE 2021-2031 ($THOUSAND)
    TABLE 33. MEXICO POWER-TO-GAS MARKET BY APPLICATION 2021-2031 ($THOUSAND)
    TABLE 34. EUROPE POWER-TO-GAS MARKET, BY TECHNOLOGY, 2021-2031 ($THOUSAND)
    TABLE 35. EUROPE POWER-TO-GAS MARKET, BY CAPACITY, 2021-2031 ($THOUSAND)
    TABLE 36. EUROPE POWER-TO-GAS MARKET, BY USE CASE, 2021-2031 ($THOUSAND)
    TABLE 37. EUROPE POWER-TO-GAS MARKET, BY APPLICATION, 2021-2031 ($THOUSAND)
    TABLE 38. EUROPE POWER-TO-GAS MARKET, BY COUNTRY, 2021-2031 ($THOUSAND)
    TABLE 39. GERMANY POWER-TO-GAS MARKET BY TECHNOLOGY 2021-2031 ($THOUSAND)
    TABLE 40. GERMANY POWER-TO-GAS MARKET BY CAPACITY 2021-2031 ($THOUSAND)
    TABLE 41. GERMANY POWER-TO-GAS MARKET BY APPLICATION 2021-2031 ($THOUSAND)
    TABLE 42. GERMANY POWER-TO-GAS MARKET BY APPLICATION 2021-2031 ($THOUSAND)
    TABLE 43. UK POWER-TO-GAS MARKET BY TECHNOLOGY 2021-2031 ($THOUSAND)
    TABLE 44. UK POWER-TO-GAS MARKET BY CAPACITY 2021-2031 ($THOUSAND)
    TABLE 45. UK POWER-TO-GAS MARKET BY USE CASE 2021-2031 ($THOUSAND)
    TABLE 46. UK POWER-TO-GAS MARKET BY APPLICATION 2021-2031 ($THOUSAND)
    TABLE 47. FRANCE POWER-TO-GAS MARKET BY TECHNOLOGY 2021-2031 ($THOUSAND)
    TABLE 48. FRANCE POWER-TO-GAS MARKET BY CAPACITY 2021-2031 ($THOUSAND)
    TABLE 49. FRANCE POWER-TO-GAS MARKET BY USE CASE 2021-2031 ($THOUSAND)
    TABLE 50. FRANCE POWER-TO-GAS MARKET BY APPLICATION 2021-2031 ($THOUSAND)
    TABLE 51. ITALY POWER-TO-GAS MARKET BY TECHNOLOGY 2021-2031 ($THOUSAND)
    TABLE 52. ITALY POWER-TO-GAS MARKET BY CAPACITY 2021-2031 ($THOUSAND)
    TABLE 53. ITALY POWER-TO-GAS MARKET BY USE CASE 2021-2031 ($THOUSAND)
    TABLE 54. ITALY POWER-TO-GAS MARKET BY APPLICATION 2021-2031 ($THOUSAND)
    TABLE 55. SPAIN POWER-TO-GAS MARKET BY TECHNOLOGY 2021-2031 ($THOUSAND)
    TABLE 56. SPAIN POWER-TO-GAS MARKET BY CAPACITY 2021-2031 ($THOUSAND)
    TABLE 57. SPAIN POWER-TO-GAS MARKET BY USE CASE 2021-2031 ($THOUSAND)
    TABLE 58. SPAIN POWER-TO-GAS MARKET BY APPLICATION 2021-2031 ($THOUSAND)
    TABLE 59. REST OF EUROPE POWER-TO-GAS MARKET BY TECHNOLOGY 2021-2031 ($THOUSAND)
    TABLE 60. REST OF EUROPE POWER-TO-GAS MARKET BY CAPACITY 2021-2031 ($THOUSAND)
    TABLE 61. REST OF EUROPE POWER-TO-GAS MARKET BY USE CASE 2021-2031 ($THOUSAND)
    TABLE 62. REST OF EUROPE POWER-TO-GAS MARKET BY APPLICATION 2021-2031 ($THOUSAND)
    TABLE 63. ASIA-PACIFIC POWER-TO-GAS MARKET, BY TECHNOLOGY, 2021-2031 ($THOUSAND)
    TABLE 64. ASIA-PACIFIC POWER-TO-GAS MARKET, BY CAPACITY, 2021-2031 ($THOUSAND)
    TABLE 65. ASIA-PACIFIC POWER-TO-GAS MARKET, BY USE CASE, 2021-2031 ($THOUSAND)
    TABLE 66. ASIA-PACIFIC POWER-TO-GAS MARKET, BY APPLICATION, 2021-2031 ($THOUSAND)
    TABLE 67. ASIA-PACIFIC POWER-TO-GAS MARKET, BY COUNTRY, 2021-2031 ($THOUSAND)
    TABLE 68. CHINA POWER-TO-GAS MARKET BY TECHNOLOGY 2021-2031 ($THOUSAND)
    TABLE 69. CHINA POWER-TO-GAS MARKET BY CAPACITY 2021-2031 ($THOUSAND)
    TABLE 70. CHINA POWER-TO-GAS MARKET BY USE CASE 2021-2031 ($THOUSAND)
    TABLE 71. CHINA POWER-TO-GAS MARKET BY APPLICATION 2021-2031 ($THOUSAND)
    TABLE 72. JAPAN POWER-TO-GAS MARKET BY TECHNOLOGY 2021-2031 ($THOUSAND)
    TABLE 73. JAPAN POWER-TO-GAS MARKET BY CAPACITY 2021-2031 ($THOUSAND)
    TABLE 74. JAPAN POWER-TO-GAS MARKET BY USE CASE 2021-2031 ($THOUSAND)
    TABLE 75. JAPAN POWER-TO-GAS MARKET BY APPLICATION 2021-2031 ($THOUSAND)
    TABLE 76. INDIA POWER-TO-GAS MARKET BY TECHNOLOGY 2021-2031 ($THOUSAND)
    TABLE 77. INDIA POWER-TO-GAS MARKET BY CAPACITY 2021-2031 ($THOUSAND)
    TABLE 78. INDIA POWER-TO-GAS MARKET BY USE CASE 2021-2031 ($THOUSAND)
    TABLE 79. INDIA POWER-TO-GAS MARKET BY APPLICATION 2021-2031 ($THOUSAND)
    TABLE 80. SOUTH KOREA POWER-TO-GAS MARKET BY TECHNOLOGY 2021-2031 ($THOUSAND)
    TABLE 81. SOUTH KOREA POWER-TO-GAS MARKET BY CAPACITY 2021-2031 ($THOUSAND)
    TABLE 82. SOUTH KOREA POWER-TO-GAS MARKET BY USE CASE 2021-2031 ($THOUSAND)
    TABLE 83. SOUTH KOREA POWER-TO-GAS MARKET BY APPLICATION 2021-2031 ($THOUSAND)
    TABLE 84. REST OF ASIA-PACIFIC POWER-TO-GAS MARKET BY TECHNOLOGY 2021-2031 ($THOUSAND)
    TABLE 85. REST OF ASIA-PACIFIC POWER-TO-GAS MARKET BY CAPACITY 2021-2031 ($THOUSAND)
    TABLE 86. REST OF ASIA-PACIFIC POWER-TO-GAS MARKET BY USE CASE 2021-2031 ($THOUSAND)
    TABLE 87. REST OF ASIA-PACIFIC POWER-TO-GAS MARKET BY APPLICATION 2021-2031 ($THOUSAND)
    TABLE 88. LAMEA POWER-TO-GAS MARKET, BY TECHNOLOGY, 2021-2031 ($THOUSAND)
    TABLE 89. LAMEA POWER-TO-GAS MARKET, BY CAPACITY, 2021-2031 ($THOUSAND)
    TABLE 90. LAMEA POWER-TO-GAS MARKET, BY USE CASE, 2021-2031 ($THOUSAND)
    TABLE 91. LAMEA POWER-TO-GAS MARKET, BY APPLICATION, 2021-2031 ($THOUSAND)
    TABLE 92. LAMEA POWER-TO-GAS MARKET, BY COUNTRY, 2021-2031 ($THOUSAND)
    TABLE 93. BRAZIL POWER-TO-GAS MARKET BY TECHNOLOGY 2021-2031 ($THOUSAND)
    TABLE 94. BRAZIL POWER-TO-GAS MARKET BY CAPACITY 2021-2031 ($THOUSAND)
    TABLE 95. BRAZIL POWER-TO-GAS MARKET BY USE CASE 2021-2031 ($THOUSAND)
    TABLE 96. BRAZIL POWER-TO-GAS MARKET BY APPLICATION 2021-2031 ($THOUSAND)
    TABLE 97. SAUDI ARABIA POWER-TO-GAS MARKET BY TECHNOLOGY 2021-2031 ($THOUSAND)
    TABLE 98. SAUDI ARABIA POWER-TO-GAS MARKET BY CAPACITY 2021-2031 ($THOUSAND)
    TABLE 99. SAUDI ARABIA POWER-TO-GAS MARKET BY USE CASE 2021-2031 ($THOUSAND)
    TABLE 100. SAUDI ARABIA POWER-TO-GAS MARKET BY APPLICATION 2021-2031 ($THOUSAND)
    TABLE 101. SOUTH AFRICA POWER-TO-GAS MARKET BY TECHNOLOGY 2021-2031 ($THOUSAND)
    TABLE 102. SOUTH AFRICA POWER-TO-GAS MARKET BY CAPACITY 2021-2031 ($THOUSAND)
    TABLE 103. SOUTH AFRICA POWER-TO-GAS MARKET BY USE CASE 2021-2031 ($THOUSAND)
    TABLE 104. SOUTH AFRICA POWER-TO-GAS MARKET BY APPLICATION 2021-2031 ($THOUSAND)
    TABLE 105. REST OF LAMEA POWER-TO-GAS MARKET BY TECHNOLOGY 2021-2031 ($THOUSAND)
    TABLE 106. REST OF LAMEA POWER-TO-GAS MARKET BY CAPACITY 2021-2031 ($THOUSAND)
    TABLE 107. REST OF LAMEA POWER-TO-GAS MARKET BY USE CASE 2021-2031 ($THOUSAND)
    TABLE 108. REST OF LAMEA POWER-TO-GAS MARKET BY APPLICATION 2021-2031 ($THOUSAND)
    TABLE 109. KEY COLLABORATIONS (2020-2022)
    TABLE 110. KEY ACQUISITIONS (2020-2022)
    TABLE 111. KEY BUSINESS EXPANSIONS (2020-2022)
    TABLE 112. AVACON AG: KEY EXECUTIVES
    TABLE 113. COMPANY SNAPSHOT
    TABLE 114. AVACON AG: PRODUCT PORTFOLIO
    TABLE 115. KEY STRATEGIC MOVES AND DEVELOPMENTS
    TABLE 116. AQUAHYDREX: KEY EXECUTIVES
    TABLE 117. AQUAHYDREX: COMPANY SNAPSHOT
    TABLE 118. AQUAHYDREX: PRODUCT PORTFOLIO
    TABLE 119. CARBOTECH: KEY EXECUTIVES
    TABLE 120. CARBOTECH: COMPANY SNAPSHOT
    TABLE 121. CARBOTECH: PRODUCT PORTFOLIO
    TABLE 122. CARBOTECH: KEY STRATEGIC MOVES AND DEVELOPMENTS
    TABLE 123. ELECTROCHAEA: KEY EXECUTIVES
    TABLE 124. ELECTROCHAEA: COMPANY SNAPSHOT
    TABLE 125. ELECTROCHAEA: PRODUCT PORTFOLIO
    TABLE 126. ELECTROCHAEA: KEY STRATEGIC MOVES AND DEVELOPMENTS
    TABLE 127. EXYTRON: KEY EXECUTIVES
    TABLE 128. EXYTRON: COMPANY SNAPSHOT
    TABLE 129. EXYTRON: PRODUCT PORTFOLIO
    TABLE 130. FUELCELL ENERGY INC.: KEY EXECUTIVES
    TABLE 131. FUELCELL ENERGY INC.: COMPANY SNAPSHOT
    TABLE 132. FUELCELL ENERGY INC.: OPERATING BUSINESS SEGMENTS
    TABLE 133. FUELCELL ENERGY INC.: PRODUCT PORTFOLIO
    TABLE 134. FUELCELL ENERGY INC.: REVENUE ($ MILLION)
    TABLE 135. FUELCELL ENERGY INC.: KEY STRATEGIC MOVES AND DEVELOPMENTS
    TABLE 136. GREEN HYDROGEN SYSTEMS: KEY EXECUTIVES
    TABLE 137. GREEN HYDROGEN SYSTEMS: COMPANY SNAPSHOT
    TABLE 138. GREEN HYDROGEN SYSTEMS: PRODUCT PORTFOLIO
    TABLE 139. GREEN HYDROGEN SYSTEMS: REVENUE ($ MILLION)
    TABLE 140. GREEN HYDROGEN SYSTEMS: KEY STRATEGIC MOVES AND DEVELOPMENTS
    TABLE 141. HITACHI ZOSEN INOVA: KEY EXECUTIVES
    TABLE 142. HITACHI ZOSEN INOVA: COMPANY SNAPSHOT
    TABLE 143. HITACHI ZOSEN INOVA: PRODUCT PORTFOLIO
    TABLE 144. HITACHI ZOSEN INOVA: KEY STRATEGIC MOVES AND DEVELOPMENTS
    TABLE 145. CUMMINS INC.: KEY EXECUTIVES
    TABLE 146. CUMMINS INC.: COMPANY SNAPSHOT
    TABLE 147. CUMMINS INC.: PRODUCT PORTFOLIO
    TABLE 148. CUMMINS INC.: KEY STRATEGIC MOVES AND DEVELOPMENTS
    TABLE 149. ITM POWER: KEY EXECUTIVES
    TABLE 150. ITM POWER: COMPANY SNAPSHOT
    TABLE 151. ITM POWER: PRODUCT PORTFOLIO
    TABLE 152. ITM POWER: REVENUE ($ MILLION)
    TABLE 153. ITM POWER: KEY STRATEGIC MOVES AND DEVELOPMENTS
    TABLE 154. SIEMENS AG: KEY EXECUTIVES
    TABLE 155. SIEMENS AG: COMPANY SNAPSHOT
    TABLE 156. SIEMENS AG: PRODUCT PORTFOLIO
    TABLE 157. SIEMENS AG: OPERATING BUSINESS SEGMENTS
    TABLE 158. SIEMENS AG: R&D EXPENDITURE (IN $ MILLION)
    TABLE 159. SIEMENS AG: REVENUE ($ MILLION)
    TABLE 160. MAN ENERGY SOLUTIONS SE: KEY EXECUTIVES
    TABLE 161. MAN ENERGY SOLUTIONS SE: COMPANY SNAPSHOT
    TABLE 162. MAN ENERGY SOLUTIONS SE: PRODUCT PORTFOLIO
    TABLE 163. MAN ENERGY SOLUTIONS SE: KEY STRATEGIC MOVES AND DEVELOPMENTS
    TABLE 164. MCPHY ENERGY S.A.: KEY EXECUTIVES
    TABLE 165. MCPHY ENERGY S.A.: COMPANY SNAPSHOT
    TABLE 166. MCPHY ENERGY S.A.: PRODUCT PORTFOLIO
    TABLE 167. MCPHY ENERGY S.A.: REVENUE ($ MILLION)
    TABLE 168. MCPHY ENERGY S.A.: KEY STRATEGIC MOVES AND DEVELOPMENTS
    TABLE 169. NEL HYDROGEN: KEY EXECUTIVES
    TABLE 170. NEL HYDROGEN: COMPANY SNAPSHOT
    TABLE 171. NEL HYDROGEN: PRODUCT PORTFOLIO
    TABLE 172. NEL HYDROGEN: KEY STRATEGIC MOVES AND DEVELOPMENTS
    TABLE 173. THYSSENKRUPP: KEY EXECUTIVES
    TABLE 174. THYSSENKRUPP: COMPANY SNAPSHOT
    TABLE 175. THYSSENKRUPP: OPERATING BUSINESS SEGMENTS
    TABLE 176. THYSSENKRUPP: PRODUCT PORTFOLIO
    TABLE 177. THYSSENKRUPP: REVENUE ($ MILLION)
     

LIST OF FIGURES

  • FIGURE 01. POWER-TO-GAS MARKET SNAPSHOT, BY SEGMENTATION, 2022–2031
    FIGURE 02. POWER-TO-GAS MARKET SNAPSHOT, BY REGION, 2022–2031
    FIGURE 03. POWER-TO-GAS MARKET SEGMENTATION
    FIGURE 04. TOP INVESTMENT POCKETS
    FIGURE 05. MODERATE BARGAINING POWER OF SUPPLIERS
    FIGURE 06. MODERATE BARGAINING POWER OF BUYERS
    FIGURE 07. MODERATE THREAT OF NEW ENTRANTS
    FIGURE 08. MODERATE THREAT OF SUBSTITUTES
    FIGURE 09. MODERATE COMPETITIVE RIVALRY
    FIGURE 10. POWER-TO-GAS MARKET DYNAMICS
    FIGURE 11. VALUE CHAIN ANALYSIS
    FIGURE 12. POWER-TO-GAS MARKET, BY TECHNOLOGY, 2022–2031 ($THOUSAND)
    FIGURE 13. COMPARATIVE ANALYSIS OF ELECTROLYSIS MARKET, BY COUNTRY, 2022 & 2031 ($THOUSAND)
    FIGURE 14. COMPARATIVE ANALYSIS OF METHANATION MARKET, BY COUNTRY, 2022 & 2031 ($THOUSAND)
    FIGURE 15. POWER-TO-GAS MARKET, BY CAPACITY, 2022–2031 ($THOUSAND)
    FIGURE 16. COMPARATIVE ANALYSIS OF POWER-TO-GAS MARKET FOR LESS THAN 100 KW, BY COUNTRY, 2022 & 2031 ($THOUSAND)
    FIGURE 17. COMPARATIVE ANALYSIS OF POWER-TO-GAS MARKET FOR 100–999 KW, BY COUNTRY, 2022 & 2031 ($THOUSAND)
    FIGURE 18. COMPARATIVE ANALYSIS OF POWER-TO-GAS MARKET FOR 1000 KW AND ABOVE, BY COUNTRY, 2022 & 2031 ($THOUSAND)
    FIGURE 19. POWER-TO-GAS MARKET, BY USE CASE, 2022–2031 ($THOUSAND)
    FIGURE 20. COMPARATIVE ANALYSIS OF POWER-TO-GAS MARKET FOR WIND, BY COUNTRY, 2022 & 2031 ($THOUSAND)
    FIGURE 21. COMPARATIVE ANALYSIS OF POWER-TO-GAS MARKET FOR SOLAR, BY COUNTRY, 2022 & 2031 ($THOUSAND)
    FIGURE 22. COMPARATIVE ANALYSIS OF POWER-TO-GAS MARKET FOR BIOMASS, BY COUNTRY, 2022 & 2031 ($THOUSAND)
    FIGURE 23. POWER-TO-GAS MARKET, BY APPLICATION, 2022–2031 ($THOUSAND)
    FIGURE 24. COMPARATIVE ANALYSIS OF POWER-TO-GAS MARKET FOR RESIDENTIAL, BY COUNTRY, 2022 & 2031 ($THOUSAND)
    FIGURE 25. COMPARATIVE ANALYSIS OF POWER-TO-GAS MARKET FOR COMMERCIAL, BY COUNTRY, 2022 & 2031 ($THOUSAND)
    FIGURE 26. COMPARATIVE ANALYSIS OF POWER-TO-GAS MARKET FOR UTILITY, BY COUNTRY, 2022 & 2031 ($THOUSAND)
    FIGURE 27. U.S. POWER-TO-GAS MARKET REVENUE, 2021–2031 ($THOUSAND)
    FIGURE 28. CANADA POWER-TO-GAS MARKET REVENUE, 2021–2031 ($THOUSAND)
    FIGURE 29. MEXICO POWER-TO-GAS MARKET REVENUE, 2021–2031 ($THOUSAND)
    FIGURE 30. GERMANY POWER-TO-GAS MARKET REVENUE, 2021–2031 ($THOUSAND)
    FIGURE 31. UK POWER-TO-GAS MARKET REVENUE, 2021–2031 ($THOUSAND)
    FIGURE 32. FRANCE POWER-TO-GAS MARKET REVENUE, 2021–2031 ($THOUSAND)
    FIGURE 33. ITALY POWER-TO-GAS MARKET REVENUE, 2021–2031 ($THOUSAND)
    FIGURE 34. SPAIN POWER-TO-GAS MARKET REVENUE, 2021–2031 ($THOUSAND)
    FIGURE 35. REST OF EUROPE POWER-TO-GAS MARKET REVENUE, 2021–2031 ($THOUSAND)
    FIGURE 36. CHINA POWER-TO-GAS MARKET REVENUE, 2021–2031 ($THOUSAND)
    FIGURE 37. JAPAN POWER-TO-GAS MARKET REVENUE, 2021–2031 ($THOUSAND)
    FIGURE 38. INDIA POWER-TO-GAS MARKET REVENUE, 2021–2031 ($THOUSAND)
    FIGURE 39. SOUTH KOREA POWER-TO-GAS MARKET REVENUE, 2021–2031 ($THOUSAND)
    FIGURE 40. REST OF ASIA-PACIFIC POWER-TO-GAS MARKET REVENUE, 2021–2031 ($THOUSAND)
    FIGURE 41. BRAZIL POWER-TO-GAS MARKET REVENUE, 2021–2031 ($THOUSAND)
    FIGURE 42. SAUDI ARABIA POWER-TO-GAS MARKET REVENUE, 2021–2031 ($THOUSAND)
    FIGURE 43. SOUTH AFRICA POWER-TO-GAS MARKET REVENUE, 2021–2031 ($THOUSAND)
    FIGURE 44. REST OF LAMEA POWER-TO-GAS MARKET REVENUE, 2021–2031 ($THOUSAND)
    FIGURE 45. MARKET PLAYER POSITIONING, 2021
    FIGURE 46. TOP WINNING STRATEGIES, BY YEAR, 2020–2022
    FIGURE 47. TOP WINNING STRATEGIES, BY DEVELOPMENT, 2020–2022 (%)
    FIGURE 48. TOP WINNING STRATEGIES, BY COMPANY, 2020–2022
    FIGURE 49. FUELCELL ENERGY INC.: REVENUE ($ MILLION)
    FIGURE 50. FUELCELL ENERGY INC.: REVENUE ($ MILLION) BY REGION
    FIGURE 51. GREEN HYDROGEN SYSTEMS: REVENUE ($ MILLION)
    FIGURE 52. GREEN HYDROGEN SYSTEMS: REVENUE ($ MILLION) BY REGION
    FIGURE 53. ITM POWER: REVENUE ($ MILLION)
    FIGURE 54. ITM POWER: REVENUE BY REGION ($ MILLION)
    FIGURE 55. SIEMENS AG: R&D EXPENDITURE ($ MILLION)
    FIGURE 56. SIEMENS AG: REVENUE ($ MILLION)
    FIGURE 57. SIEMENS AG: REVENUE (IN $ MILLION) BY SEGMENT
    FIGURE 58. SIEMENS AG: REVENUE (IN $ MILLION) BY SEGMENT
    FIGURE 59. MCPHY ENERGY S.A.: REVENUE ($ MILLION)
    FIGURE 60. MCPHY ENERGY S.A.: REVENUE ($ MILLION) BY REGION
    FIGURE 61. THYSSENKRUPP: REVENUE ($ MILLION)
    FIGURE 62. THYSSENKRUPP: NET SALES ($ MILLION) BY SEGMENT


The global power-to-gas market is expected to witness increase in demand during the forecast period, due to rapidly growing awareness among people regarding the advantages of the green energy and high efficiency conversion of solar panel, which has led to the utilization of excess solar energy through power-to-gas technology.

Increase in demand for green hydrogen in the food & beverages, medical, chemical, petrochemicals, electronics, and glass industries have positive impact on the power-to-gas market. Rise in concern about carbon emissions, as well as need to decarbonize manufacturing, commercial, transportation, and power sectors have compelled countries to reduce their reliance on fossil fuel-based systems and increase investment to green alternatives. Furthermore, increase in the presence of excess power from the renewable energy source during the low demand for power has led to the application of power-to-gas technology to convert the excess energy into valuable fuels, which can be used in various industries and as a fuel in the transportation sector.

The rapidly increasing electricity demand, government policies toward use of green energy, and development of various eco-friendly hydrogen production technologies are some of the key factors expected to drive demand for the power-to-gas market during the forecast period. In addition, investments of government bodies and various policies to innovate various products based on hydrogen fuel cells as an energy source and to create synthetic fuels using hydrogen, and carbon as raw materials have also created opportunities for the growth of the power-to-gas market.

PURCHASE OPTIONS

Call or Email us

U.S.-Canada Toll-free: +1-800-792-5285
Int'l : +1-503-894-6022
Europe : +44-845-528-1300
Email : help@alliedmarketresearch.com
 
FREQUENTLY ASKED QUESTIONS?

A. Regulations to promote hydrogen production technologies and increase in market share of renewable energy in power generation are the key factors boosting the Power-to-Gas Market growth

A. The market value of Power-to-Gas in 2031 is expected to be US$ 84.4 Million

A. Hydrogenics, ITM Power, McPhy Energy, Siemens AG, MAN Energy Solutions, Nel Hydrogen, ThyssenKrupp, Electrochaea, Exytron, GreenHydrogen, Hitachi Zosen Inova Etogas, Fuelcell Energy, Avacon, Carbotech, and Aquahydrex.

A. Utility based industry is projected to increase the demand for Power-to-Gas Market

A. The power to gas market is segmented on the basis of technology, capacity, use case, application, and region. On the basis of technology, the market is segmented into electrolysis and methanation. On the basis of capacity, the market is bifurcated into less than 100KW, 100-999KW, and 1000KW and above. On the basis of use case, the market is segmented into wind, solar, and biomass. On the basis of application, the market is segmented into residential, commercial, and utility. Region-wise, the market is studied across North America, Europe, Asia-Pacific, and LAMEA.

A. Increase in utilization of hydrogen and CNG in transportation sector is the Main Driver of Power-to-Gas Market

A. After the global vaccination, governments of various countries have taken initiatives to increase the investment in the renewable energy related industries, especially solar and wind power systems. Increase in investment is mostly to improve the national energy security during the pandemic and other crisis. The presence of above mentioned activities and change in policies due to the outbreak of the COVID-19 pandemic have positive impact on the development of the market during the forecast period.

Looking for Customization?

 Customization Request

Have a Question?

 Speak with Analyst

Any Confusion?

 Inquire Before Buying

Have a glance of the Report

  Request Sample
RELATED TAGS

Purchase Full Report of
Power-to-gas Market

Start reading instantly.
This Report and over 67,132+ more Reports, Available with Avenue Library. T&C*.

  • Online Only
  • $3,456
  • Online cloud access only
  • Restricted print, copy, paste & download
  • Read only
  • Free industry update
    (Within 180 days)
  • Free report update in next update cycle
    (Jul 2023 - Jul 2024)
  • Data Pack
  • $3,840
  • Restricted to one authorized user
  • One print only
  • Available in
    Excel
  • Free industry update
    (Within 180 days)
  •   Free report update in next update cycle
    (Jul 2023 - Jul 2024)
  • Single User
  • $5,820
  • Restricted to one authorized user
  • One print only
  • Available in
    PDF
  • Free industry update
    (Within 180 days)
  •   Free report update in next update cycle
    (Jul 2023 - Jul 2024)
  • Five Users
  • $6,450
  • Limited to five authorized users
  • Print upto five copies
  • Available in
    PDF
  • Free industry update
    (Within 180 days)
  •   Free report update in next update cycle
    (Jul 2023 - Jul 2024)
  • Enterprise
    License/PDF

  • $10,995
  • Unlimited
    within
    company/enterprise
  • Available in Excel & PDF
  • Free industry update
    (Within 180 days)
  •   Free report update in next update cycle
    (Jul 2023 - Jul 2024)
  • Library
    Membership

  • $999 $ 1,175
    Per User/ Per month/ Billed annually
  • Published Content
    E-access
  • Company Profiles
    E-access
  • Newly Added Content Access
  • 10 PDF
    Downloads
  • 5 Excel Data
    Pack Downloads
  • 250 Company Profiles PDF Downloads
  • Buy Now

*Taxes/Fees, if applicable will be added during checkout. All prices in USD

RELATED REPORTS
 

Why Allied Market Research?


Infallible Methodology

To ensure high-level data integrity, accurate analysis, and impeccable forecasts

Analyst Support

For complete satisfaction

Customization

On-demand customization of scope of the report to exactly meet your needs

TARGETED MARKET VIEW

Targeted market view to provide pertinent information and save time of readers

Get fresh content delivered

Get insights on topics that are crucial for your business. Stay abreast of your interest areas.

Get Industry Data Alerts

Why Allied Market Research?

Infallible Methodology

To ensure high-level data integrity, accurate analysis, and impeccable forecasts

Analyst Support

For complete satisfaction

Customization

On-demand customization of scope of the report to exactly meet your needs

TARGETED MARKET VIEW

Targeted market view to provide pertinent information and save time of readers