
Process Analytics Market Insights:
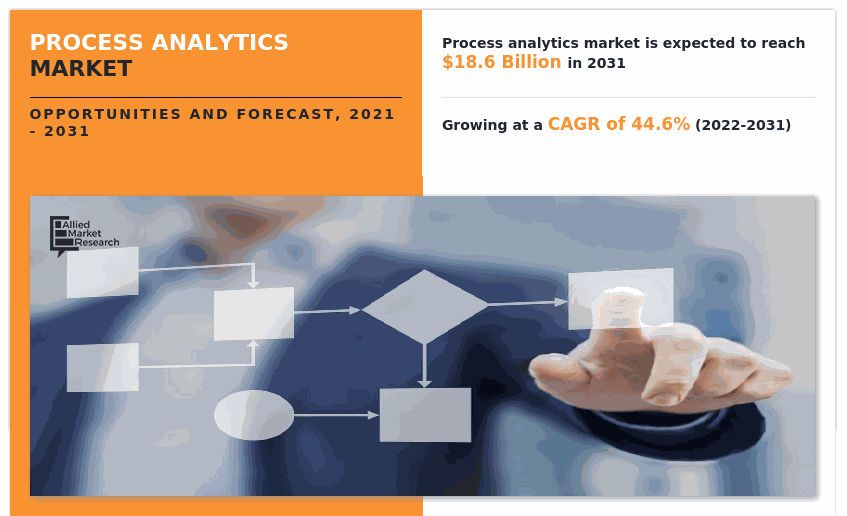
The global process analytics market size was valued at USD 469.86 million in 2021 and is projected to reach USD 18.6 billion by 2031, growing at a CAGR of 44.6% from 2022 to 2031.
Digital transformation is empowering users’ awareness for analyzing and understanding business processes and increase in adoption of algorithmic business are the significant growth opportunities for the future of global process analytics market. In addition, rise in implementation of task-level automation is positively impacting the growth of the process analytics industry. However, competition from open-source alternatives is hampering the demand for commercial solutions and lack of skills and expertise limit the market growth. On the contrary, the need to focus on enhancing the customer experience is expected to offer remunerative opportunities for expansion of the process analytics industry during the forecast period.
A process is a series of related transactions that convert various factors or inputs into business outputs. Process analysis is a systematic examination of business processes, such as the budgeting or manufacturing process, to assess performance and identify areas for improvement. Furthermore, it involves analyzing data, but not all data analysis involves assessing processes. Companies use data to analyze not only processes, but also financial information, sales figures, operations and even the impact of new policies or government regulations.
Segment Review:
The global process analytics market is segmented on the basis of process mining type, deployment model, organization size, application and region. On the basis of process mining type, the market is classified into process discovery, process conformance and process enhancement. Based on deployment model, the market is bifurcated into on-premises and cloud. On the basis of organization size, the market is segmented into small and medium-sized enterprises and large enterprises. Depending on application, the market is divided into business process, process analytical technology and customer interaction. Region wise, it is analyzed across North America, Europe, Asia-Pacific, and LAMEA.
The global process analytics market is dominated by key players such as Celonis, Fluxicon BV, Icaro Tech, Kofax Inc., Logpickr, Scheer GmbH, Worksoft, Inc., Minit, Monkey Mining BV, and ABBYY. These players have adopted various strategies to increase their market penetration and strengthen their position in the industry.
Depending on process mining type, the process discovery segment dominated the process analytics market share in 2021, and is expected to continue this trend during the forecast period, as it plays an important role in processing data from logs are extracted, cleaned, and formatted for analysis. However, the process conformance segment is expected to witness the highest growth in the upcoming years, owing to its capabilities for process conformance checks, wherein the event logs are checked against ideal processes.
By Process Mining Type
The process discovery segment is expected to garner the highest market share owing to its role in data processing and extaction.
Region wise, the process analytics market was dominated by North America in 2021, and is expected to retain its position during the forecast period, owing to surge in adoption of process analytics solutions across end-user industries, such as BFSI, retail, and healthcare, and is expected to drive the market for process analytics technology during the forecast period. However, Asia-Pacific is expected to witness significant growth during the forecast period, owing to growing adoption of advanced strategic platforms in Asia-Pacific region, such platforms are equipped with advanced process analytics, automation, and AI, including natural language processing and machine learning, can help market leaders think more expansively and precisely about the wide range of future possibilities.

The report focuses on growth prospects, restraints, and analysis of the global process analytics market trends. The study provides Porter’s five forces analysis to understand the impact of various factors, such as bargaining power of suppliers, competitive intensity of competitors, threat of new entrants, threat of substitutes, and bargaining power of buyers on the global process analytics market share.
Top Impacting Factors:
Digital Transformation Driving Users’ Awareness for Analyzing and Understanding Business Processes
The demand for business process analytics is increasing with the growing digital transformation, and growing competition toward better analyzing and understanding the business process. In addition, this process analytics implementation helps businesses in the development of new competencies that revolve around the capacities to be more agile, people-oriented, innovative, customer-centric, streamlined, and efficient. This further helps to leverage opportunities with the change in procedures and is considered as an important factor to boost the growth of the market. Furthermore, this advancement in digitalization also helps to leverage technologies to create value and new services for various stakeholders, innovate and acquire the capabilities to rapidly adapt to changing circumstances. These factors are contributing to process analytics market growth.
Increase in adoption of Algorithmic Business
The growing advert of algorithms toward channelizing the process analytics business is one of the driving factors for the market. Furthermore, algorithm is playing a core role in manufacturing control systems, marketing automation and campaign management and have played a pivotal role in financial services for the past few years. Moreover, it helps in creating an impact through planning, control, internet, social media, mobile commerce and fabric automation, this factor is expected to boost the market toward growth during the forecasted period.
Moreover, algorithms play an important role in speeding and scaling the output by managing the human workforce. As digital business is advancing and increasing the use of algorithms, it represents the most cost-effective and efficient way to handle the volumes of data and is driving the process analytics market toward growth.
Regional Insights:
North America leads the global process analytics market, is driven by the presence of numerous technology companies and advanced analytical capabilities. The U.S. is a significant contributor, with enterprises across industries such as finance, healthcare, and manufacturing investing in process analytics to gain insights into their operations and improve performance. The growing emphasis on automation and digital transformation initiatives, along with the adoption of advanced analytics tools, is driving market growth in this region. Organizations are increasingly utilizing process mining and business intelligence tools to analyze workflows and identify areas for improvement.
Europe follows closely, with countries like Germany, the U.K., and France embracing process analytics to enhance business processes and comply with regulations. The region's focus on operational efficiency and quality management drives the demand for analytics solutions that provide actionable insights. The European market is characterized by a strong emphasis on data privacy and compliance, influencing the adoption of process analytics tools that adhere to regulations such as GDPR. Additionally, industries such as manufacturing and logistics are increasingly leveraging process analytics to optimize supply chains and production processes.
Asia-Pacific is witnessing significant growth in the process analytics market, with countries like China, India, and Japan leading the charge. The rapid digital transformation in these countries, coupled with the increasing adoption of cloud-based analytics solutions, is driving market expansion. Organizations in Asia-Pacific are increasingly recognizing the value of data-driven decision-making and are investing in process analytics to enhance operational efficiency. The growing demand for automation and the rise of IoT technologies are also key factors propelling the adoption of process analytics tools in this region.
Latin America and the Middle East & Africa are emerging markets for process analytics. In Latin America, countries like Brazil and Mexico are beginning to adopt process analytics solutions as businesses seek to improve efficiency and gain insights into operations. The Middle East, particularly the UAE and Saudi Arabia, is investing in analytics tools to enhance business processes and support economic diversification efforts.
Key Industry Developments:
- In July 2021, Celonis announced its expansion into the Americas, focusing on delivering process mining and analytics solutions to businesses looking to optimize their operations. This move reflects the growing demand for process analytics tools in North America.
- In April 2022, IBM acquired Taos, a cloud managed services provider, to enhance its hybrid cloud capabilities. This acquisition allows IBM to offer more comprehensive process analytics solutions to its clients by leveraging cloud technologies.
- In September 2022, SAP introduced Process Insights, a new feature within its Business Technology Platform. This tool enables organizations to visualize and analyze their business processes, providing insights for optimization and efficiency improvements.
- In March 2023, Qlik announced new AI-driven features in its analytics platform, enhancing process analytics capabilities. These features allow users to automatically identify process bottlenecks and recommend improvements based on data insights.
Key Benefits for Stakeholders:
- The study provides process analytics market analysis along with current & future trends to explain the imminent investment pockets.
- Information about key drivers, restraints, & opportunities and their impact analysis on global process analytics forecast is provided in the report.
- Porter’s five forces analysis illustrates the potency of the buyers and suppliers operating in the industry.
- The quantitative analysis of the market from 2022 to 2031 is provided to determine the process analytics market potential.
Process Analytics Market Report Highlights
| Aspects | Details |
| By APPLICATION |
|
| By Process Mining Type |
|
| By Deployment Mode |
|
| By Organization Size |
|
| By Region |
|
| Key Market Players | ABBYY, Monkey Mining BV, Worksoft, Inc., Scheer Gmbh, Kofax Inc., Fluxicon BV, Minit, Icaro Tech, Celonis, Logpickr |
Analyst Review
Demand for process analytics systems has been increasing in the past few years and is expected to continue this trend in the coming years as well, owing to increase in adoption of algorithmic business, which are supporting the development of process analytics that can provide dynamically scalable cloud infrastructure to business enterprises at a lower cost. Moreover, collaborations between process analytics and ERP vendors are further enabling the need for process analytics. In addition, growing investments from leading analytics vendors from many regions of the world are promising new opportunities for the growth of the process analytics market in the coming years.
Key providers of the process analytics market such as Celonis, Kofax Inc., and Scheer GmbH, account for a significant share in the market. With larger requirement from process analytics services, various companies are establishing strategic partnership and acquisition to increase process analytics capabilities. For instance, in March 2022, Celonis undergone into acquisition with Process Analytics Factory GmbH (PAF), a leading provider of process mining insights for Microsoft Power BI. This acquisition helps to enable millions of Microsoft Power Platform users to utilize Celonis’ market leading Execution Management System (EMS) for process mining, automation, and collaboration.
In addition, with the increase in demand for process analytics, various companies are expanding their product presence by partnering with tech giant companies. For instance, in March 2022, Celonis entered into partnership with IBM, to scale the adoption of process mining and execution management in the Asia-Pacific (APAC) region. This partnership helps to provide cloud-based solutions to support customers in the APAC region. This also helps to increase the end user customer base.
Moreover, market players are expanding their business operations and customers by increasing their acquisition. For instance, in June 2021, Kofax Inc. was acquired by PSIGEN Software, Inc., a provider of document capture, content management, and workflow automation software and solutions. This acquisition helps to extend leadership position in the capture market, add content management software and solutions to product portfolio, increase customer and partner ecosystem and enhanced intelligent automation platform.
The global process analytics market size was valued at $469.86 million in 2021, and is projected to reach $18.6 billion by 2031
The global process analytics market is expected to grow at a compound annual growth rate (CAGR) of 44.6% from 2021-2031 to reach $18.6 billion by 2031
Major key players in the process analytics market research report include Celonis, Fluxicon BV, Icaro Tech, Kofax Inc., Logpickr, Scheer GmbH, Worksoft, Inc., Minit, Monkey Mining BV, and ABBYY.
Asia-Pacific is expected to witness significant growth during the forecast period
Digital transformation is empowering users’ awareness for analyzing and understanding business processes and increase in adoption of algorithmic business are the significant growth opportunities for the future of global process analytics market.
Loading Table Of Content...

