Radiology Information System Market by Type (Integrated Radiology Information Systems, and Standalone Radiology Information Systems), by Component (Services, Software, and Hardware), by Deployment Mode (Web-Based, On-Premise, and Cloud-Based), and by End User (Hospitals, Office-Based Physicians, Emergency Healthcare Service Providers, and Others) - Global Opportunity Analysis and Industry Forecast, 2014-2022 Update Available On-Demand
A00968 | Pages: 160 | Feb 2017 | 8104 Views | | |
Author(s) : Shubhangi Bawkar | Tables: 54 | Charts: 49 | Formats*: | |
COVID-19
Pandemic disrupted the entire world and affected many industries.
Get detailed COVID-19 impact analysis on the Radiology Information System Market
Request Now !Radiology Information System Market Overview
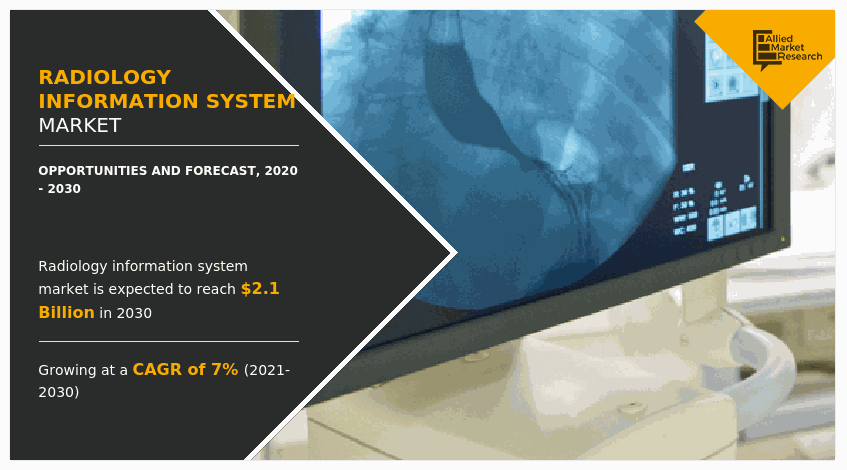
Global Radiology Information System Market was valued at $603 million in 2015, and is expected to reach $941 million by 2022, supported by a CAGR of 5.9% during the forecast period. A radiology information system (RIS) is majorly used to organize and manage the workflow of the radiology department.
Get more information on this report : Request Sample Pages
Factors such as enhancement of healthcare IT services, technological advancements, and surging prevalence of chronic diseases drive the market of radiology information system. In addition, increase in adoption of healthcare IT services in emerging economies are expected to create new opportunities for the key players during the analysis period. However, shortage of experienced IT professionals in healthcare and interoperability issues are the major barriers that restrain the market growth.
Global Radiology Information System Market Segmentation
Get more information on this report : Request Sample Pages
Segment Review
Based on the deployment mode, web-based market dominated the RIS market in 2015 owing to the increase in the adoption of web-based healthcare IT services. However, due to surge in demand for cloud-based services due to reduced operational cost & easy accessibility to data, the cloud-based RIS systems market is estimated to grow at the highest growth rate during the forecast period.
Top Investment Pocket
Get more information on this report : Request Sample Pages
Geographic Review:
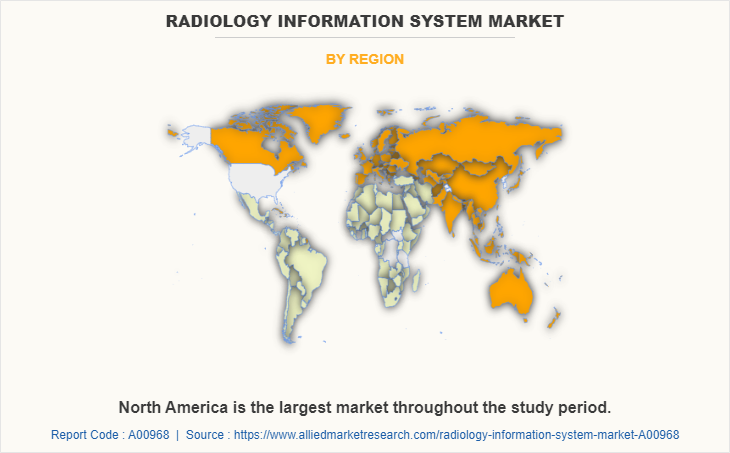
Geographically, the RIS market is segmented into North America, Europe, Asia-Pacific, and LAMEA. North America accounted for the largest market share due to factors such well-established healthcare system in the region, higher adoption of healthcare information technologies, and increase in the number of chronic disease. Mexico is estimated to grow at a faster CAGR in the North American RIS market.
Mexico – Radiology Information System Market ($Million), 2014–2022
Get more information on this report : Request Sample Pages
Asia-Pacific is expected to emerge as the area with maximum growth potential due to focus of key players in emerging economies and improving healthcare infrastructure.
Market Drivers and Restrains
Rapid increase in aging population and subsequent rise in the number of chronic diseases
Globally, the aging population is an exponential rise, which has led to increase of chronic diseases. Moreover, there is a significant surge in the demand of diagnostic services including medical imaging services. Therefore, there is a great need of healthcare solutions and services, which are economical, rapid, and reliable. In addition, integration of information technology in healthcare is on rapid increase because of many advantages including real-time communication between patient and doctor, easy access to health related information, rapid diagnosis of disease, and many others. Therefore, this is one the key factors that stimulates the market of radiology information system.
PREVALENCE OF CHRONIC DISEASE-RELATED DEATHS IN DEVELOPED AND DEVELOPING ECONOMIES WORLDWIDE IN 2020
Get more information on this report : Request Sample Pages
Adoption of Cloud Technology related services
Radiology information system is one of the components of electronic health record system. Every day electronic health record data such as patient related data and imagery data are on an increase, and therefore, it is difficult to store the bulk data on the local storage devices, as there is chance of losing essential data. Moreover, it is difficult to share the bulk amount of data via offline mode. Hence, adoption of cloud technology in the radiology information system industry becomes necessary because it allows easy sharing and storage of big data. According to the Cisco sponsored survey regarding the acceptance of cloud-based healthcare IT services shows that the 74% of patients are comfortable having their health records available in the cloud. Therefore, the demand of cloud-based technology and increase in adoption of cloud-based radiology information services drive the market growth.
Increasing concerns regarding the patient data safety & security
Due to the increase in cyber-attacks, safeguarding the patient information is a great challenge for healthcare companies. The U.S. and China are the leading countries in cybercrime, followed by Germany and Britain. Recently, the Office of the National Coordinator for Health Information Technology (ONC) in the U.S., funded $250,000 for securing confidential patient information from cyber threat and ensuring the secure sharing of information between the healthcare organizations. Most of the security threats are related to the non-traditional end points and represent the largest sources of malicious traffic that include connected medical endpoints, internet-facing personal health data, and security systems, and edge devices. Thus, the increase in threat of cyber-attacks and the potential misuse of patient related confidential data hinders the growth of RIS adoption and market growth to certain extent.
TOP COUNTRIES IN CYBER CRIME IN 2015 (%)
Get more information on this report : Request Sample Pages
RADIOLOGY INFORMATION SYSTEM MARKET KEYÂ BENEFITS:
The study provides an in-depth analysis of the radiology information system market with current trends and future estimations to elucidate the imminent investment pockets in the market
The report provides a quantitative analysis from 2014 to 2022 to enable the stakeholders to capitalize on prevailing market opportunities
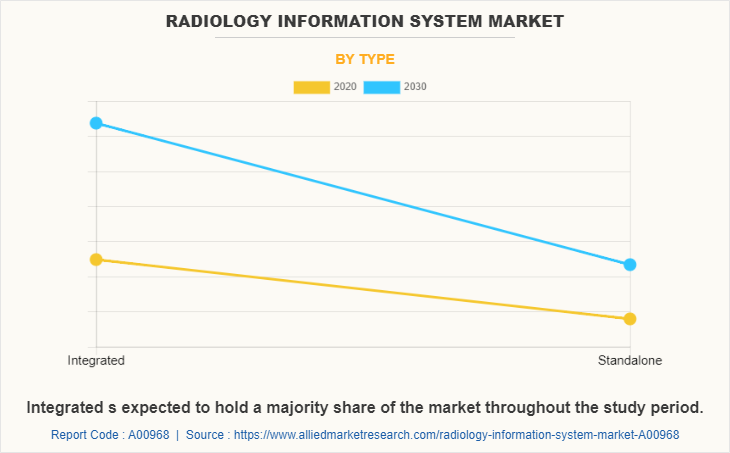
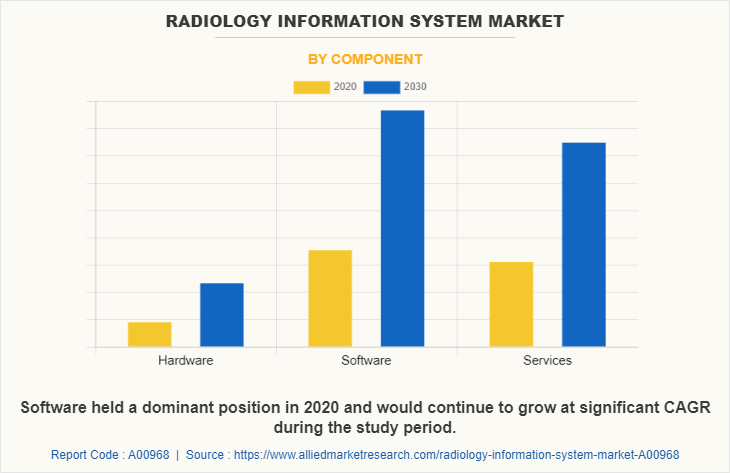
Extensive analysis by product type, component, & delivery mode helps understand the various trends and prevailing opportunities in the respective market
Comprehensive analysis of all geographical regions is provided, which assist in determining the main opportunities in these geographies
Key market players within the market are profiled in this report and their strategies are analyzed thoroughly, which predict the competitive outlook of the global radiology information system market
RADIOLOGY INFORMATION SYSTEM MARKET KEY SEGMENTATIONÂ :
MARKET BY TYPE
Integrated Radiology Information Systems
Standalone Radiology Information Systems
MARKET BY COMPONENT
Services Market
Hardware Market
Software Market
MARKET BY DEPLOYMENT MODE
Web-Based
Cloud-based
On-Premise
MARKET BY END-USER
Hospitals
Office-Based Physicians
Emergency Healthcare Service Providers
MARKET BY GEOGRAPHY
North America
U.S.
Canada
Mexico
Europe
Germany
France
UK
Spain
Italy
Rest of Europe
Asia-Pacific
Japan
China
India
Rest of Asia-Pacific
LAMEA
Latin America
Middle East
Africa
KEY PLAYERS PROFILED IN THE REPORT:
Epic Systems Corporation
MedInformatix, Inc.
GE Healthcare
Carestream Health, Inc.
Cerner Corporation
Merge Healthcare Incorporated
Allscripts Healthcare Solutions, Inc.
McKesson Corporation
Koninklijke Philips N.V.
Siemens AG
LIST OF OTHER PLAYERS: (These players are not profiled in the report. The same will be included on request)
Bayer CropScience Limited
NextGen Healthcare
Medical Information Technology, Incorporated
eClinicalWorks LLC.
Healthland
CHAPTER 1 INTRODUCTION
1.1. REPORT DESCRIPTION
1.2. KEY BENEFITS
1.3. KEY MARKET SEGMENT
1.4. RESEARCH METHODOLOGY
1.4.1. Secondary research
1.4.2. Primary research
1.4.3. Analyst tools and models
CHAPTER 2 EXECUTIVE SUMMARY
2.1. KEY FINDINGS OF THE STUDY
2.2. CXO PERSPECTIVE
CHAPTER 3 MARKET OVERVIEW
3.1. MARKET DEFINITION AND SCOPE
3.2. KEY FINDINGS
3.2.1. Top investment pockets
3.2.2. Top winning strategies
3.3. PORTER’S FIVE FORCES ANALYSIS
3.3.1. Bargaining power of buyers
3.3.2. Bargaining power of suppliers
3.3.3. Threat of substitutes
3.3.4. Threat of new entrants
3.3.5. Competitive rivalry
3.4. TOP PLAYER POSITIONING, 2015
3.5. MARKET DYNAMICS
3.5.1. Drivers
3.5.1.1. Rapidly increasing aging population and subsequent rise in the number of chronic diseases
3.5.1.2. Adoption of Cloud Technology related services
3.5.2. Restraints
3.5.2.1. Increasing concerns regarding the patient data safety & security
3.5.3. Opportunities
3.5.3.1. Increasing investment in the Asia-Pacific region offers huge market potential
CHAPTER 4 RADIOLOGY INFORMATION SYSTEM MARKET, BY PRODUCT TYPE
4.1. OVERVIEW
4.1.1. Market size and forecast
4.2. INEGRATED RIS
4.2.1. Key market trends
4.2.2. Key growth factors and opportunities
4.2.3. Market size and forecast
4.3. STANDALONE RIS
4.3.1. Key market trends
4.3.2. Key growth factors and opportunities
4.3.3. Market size and forecast
CHAPTER 5 RADIOLOGY INFORMATION SYSTEM MARKET, BY DEPLOYMENT MODE
5.1. OVERVIEW
5.2. WEB-BASED
5.2.1. Market size and forecast
5.3. ON-PREMISE
5.3.1. Market size and forecast
5.4. CLOUD-BASED
5.4.1. Market size and forecast
CHAPTER 6 RADIOLOGY INFORMATION SYSTEM MARKET, BY COMPONENT
6.1. OVERVIEW
6.2. SERVICES
6.2.1. Market size and forecast
6.3. HARDWARE
6.3.1. Market size and forecast
6.4. SOFTWARE
6.4.1. Market size and forecast
CHAPTER 7 RADIOLOGY INFORMATION SYSTEM MARKET, BY END USER
7.1. OVERVIEW
7.2. HOSPITALS
7.2.1. Market size and forecast
7.3. EMERGENCY HEALTHCARE CENTERS
7.3.1. Market size and forecast
7.4. OFFICE BASED PHYSICIANS
7.4.1. Market size and forecast
CHAPTER 8 RADIOLOGY INFORMATION SYSTEM MARKET, BY GEOGRAPHY
8.1. OVERVIEW
8.1.1. Market size and forecast
8.2. NORTH AMERICA
8.2.1. Key market trends
8.2.2. Key growth factors and opportunities
8.2.3. Market size and forecast
8.2.4. U.S. market size and forecast
8.2.5. Canada market size and forecast
8.2.6. Mexico market size and forecast
8.3. EUROPE
8.3.1. Key market trends
8.3.2. Key growth factors and opportunities
8.3.3. Market size and forecast
8.3.4. Germany market size and forecast
8.3.5. France market size and forecast
8.3.6. UK market size and forecast
8.3.7. Italy market size and forecast
8.3.8. Spain market size and forecast
8.3.9. Rest of Europe market size and forecast
8.4. ASIA-PACIFIC
8.4.1. Key market trends
8.4.2. Key growth factors and opportunities
8.4.3. Market size and forecast
8.4.4. Japan market size and forecast
8.4.5. China market size and forecast
8.4.6. India market size and forecast
8.4.7. Rest of Asia Pacific market size and forecast
8.5. LAMEA
8.5.1. Key market trends
8.5.2. Key growth factors and opportunities
8.5.3. Market size and forecast
8.5.4. Latin America market size and forecast
8.5.5. Middle East market size and forecast
8.5.6. Africa market size and forecast
CHAPTER 9 COMPANY PROFILES
9.1. EPIC SYSTEM CORPORATION
9.1.1. Company Overview
9.1.2. Company Snapshot
9.1.3. Operating business segments
9.1.4. Business performance
9.1.5. Key strategic moves & developments
9.2. MEDINFORMATIX INC.
9.2.1. Company Overview
9.2.2. Company Snapshot
9.2.3. Operating business segments
9.2.4. Business performance
9.2.5. Key strategic moves & developments
9.3. GE HEALTHCARE
9.3.1. Company Overview
9.3.2. Company Snapshot
9.3.3. Operating business segments
9.3.4. Business performance
9.3.5. Key strategic moves & developments
9.4. CARESTREAM HEALTH, INC
9.4.1. Company Overview
9.4.2. Company Snapshot
9.4.3. Operating business segments
9.4.4. Business performance
9.4.5. Key strategic moves & developments
9.5. CERNER CORPORATION
9.5.1. Company overview
9.5.2. Company Snapshot
9.5.3. Operating business segments
9.5.4. Business performance
9.5.5. Key strategic moves & developments
9.6. INTERNATIONAL BUSINESS MACHINES CORP (IBM)
9.6.1. Company Overview
9.6.2. Company Snapshot
9.6.3. Operating business segments
9.6.4. Business performance
9.6.5. Key strategic moves & developments
9.7. ALLSCRIPTS HEALTHCARE SOLUTIONS, INC.
9.7.1. Company overview
9.7.2. Company Snapshot
9.7.3. Operating business segments
9.7.4. Business performance
9.7.5. Key strategic moves & developments
9.8. MCKESSON CORPORATION
9.8.1. Company overview
9.8.2. Company Snapshot
9.8.3. Operating business segments
9.8.4. Business performance
9.8.5. Key strategic moves & developments
9.9. KONINKLIJKE PHILIPS N.V
9.9.1. Company overview
9.9.2. Company Snapshot
9.9.3. Operating business segments
9.9.4. Business performance
9.9.5. Key strategic moves & developments
9.10. SIEMENS HEALTHINEERS, INC (SUBSIDIARY OF SIEMENS AG)
9.10.1. Company overview
9.10.2. Company Snapshot
9.10.3. Operating business segments
9.10.4. Financial performance
9.10.5. Key strategic moves and developments
LIST OF TABLES
TABLE 1. GLOBAL RADIOLOGY INFORMATION SYSTEM MARKET, BY PRODUCT TYPE, 2014-2022 ($MILLION)
TABLE 2. GLOBAL INTEGRATED RADIOLOGY INFORMATION SYSTEM MARKET, BY GEOGRAPHY, 2014-2022 ($MILLION)
TABLE 3. GLOBAL STANDALONE RADIOLOGY INFORMATION SYSTEM MARKET, BY GEOGRAPHY, 2014-2022 ($MILLION)
TABLE 4. GLOBAL RADIOLOGY INFORMATION SYSTEM MARKET, BY DEPLOYMENT MODE, 2015-2022 ($MILLION)
TABLE 5. WEB-BASED RADIOLOGY INFORMATION SYSTEM MARKET, BY GEOGRAPHY, 2015-2022 ($MILLION)
TABLE 6. ON-PREMISE RADIOLOGY INFORMATION SYSTEM MARKET, BY GEOGRAPHY, 2015-2022 ($MILLION)
TABLE 7. CLOUD-BASED RADIOLOGY INFORMATION SYSTEM MARKET, BY GEOGRAPHY, 2015-2022 ($MILLION)
TABLE 8. GLOBAL RADIOLOGY INFORMATION SYSTEM MARKET, BY COMPONENT, 2015-2022 ($MILLION)
TABLE 9. RADIOLOGY INFORMATION SERVICES MARKET, BY GEOGRAPHY, 2015-2022 ($MILLION)
TABLE 10. RADIOLOGY INFORMATION SYSTEM HARDWARE MARKET, BY GEOGRAPHY, 2015-2022 ($MILLION)
TABLE 11. RADIOLOGY INFORMATION SYSTEM MARKET FOR SOFTWARE, BY GEOGRAPHY, 2015-2022 ($MILLION)
TABLE 12. GLOBAL RADIOLOGY INFORMATION SYSTEM MARKET, BY END USER, 2015-2022 ($MILLION)
TABLE 13. RADIOLOGY INFORMATION SYSTEM MARKET FOR HOSPITALS, BY GEOGRAPHY, 2015-2022 ($MILLION)
TABLE 14. RADIOLOGY INFORMATION SYSTEM MARKET FOR EMERGENCY HEALTHCARE CENTERS, BY GEOGRAPHY, 2015-2022 ($MILLION)
TABLE 15. RADIOLOGY INFORMATION SYSTEM MARKET FOR OFFICE BASED PHYSICIANS , BY GEOGRAPHY, 2015-2022 ($MILLION)
TABLE 16. RADIOLOGY INFORMATION SYSTEM MARKET, BY REGION, 2014-2022 ($MILLION)
TABLE 17. NORTH AMERICA RADIOLOGY INFORMATION SYSTEM MARKET, BY COUNTRY, 2014-2022 ($MILLION)
TABLE 18. NORTH AMERICA RADIOLOGY INFORMATION SYSTEM MARKET, BY TYPE, 2014-2022 ($MILLION)
TABLE 19. NORTH AMERICA RADIOLOGY INFORMATION SYSTEM MARKET, BY COMPONENT, 2014-2022 ($MILLION)
TABLE 20. NORTH AMERICA RADIOLOGY INFORMATION SYSTEM MARKET, BY DEPLOYMENT MODE, 2014-2022 ($MILLION)
TABLE 21. NORTH AMERICA RADIOLOGY INFORMATION SYSTEM MARKET, BY EBD USER, 2014-2022 ($MILLION)
TABLE 22. EUROPE RADIOLOGY INFORMATION SYSTEM MARKET, BY COUNTRY, 2014-2022 ($MILLION)
TABLE 23. EUROPE RADIOLOGY INFORMATION SYSTEM MARKET, BY TYPE, 2014-2022 ($MILLION)
TABLE 24. EUROPE RADIOLOGY INFORMATION SYSTEM MARKET, BY COMPONENT, 2014-2022 ($MILLION)
TABLE 25. EUROPE RADIOLOGY INFORMATION SYSTEM MARKET, BY DEPLOYMENT MODE, 2014-2022 ($MILLION)
TABLE 26. EUROPE RADIOLOGY INFORMATION SYSTEM MARKET, BY END USER, 2014-2022 ($MILLION)
TABLE 27. ASIA-PACIFIC RADIOLOGY INFORMATION SYSTEM, BY COUNTRY, 2014-2022 ($MILLION)
TABLE 28. ASIA-PACIFIC RADIOLOGY INFORMATION SYSTEM MARKET, BY TYPE, 2014-2022 ($MILLION)
TABLE 29. ASIA-PACIFIC RADIOLOGY INFORMATION SYSTEM MARKET, BY COMPONENT, 2014-2022 ($MILLION)
TABLE 30. ASIA-PACIFIC RADIOLOGY INFORMATION SYSTEM MARKET, BY DEPLOYMENT MODE, 2014-2022 ($MILLION)
TABLE 31. ASIA-PACIFIC RADIOLOGY INFORMATION SYSTEM MARKET, BY END USER, 2014-2022 ($MILLION)
TABLE 32. LAMEA RADIOLOGY INFORMATION SYSTEM, BY COUNTRY, 2014-2022 ($MILLION)
TABLE 33. LAMEA RADIOLOGY INFORMATION SYSTEM MARKET, BY TYPE, 2014-2022 ($MILLION)
TABLE 34. LAMEA RADIOLOGY INFORMATION SYSTEM MARKET, BY COMPONENT, 2014-2022 ($MILLION)
TABLE 35. LAMEA RADIOLOGY INFORMATION SYSTEM MARKET, BY DEPLOYMENT MODE, 2014-2022 ($MILLION)
TABLE 36. LAMEA RADIOLOGY INFORMATION SYSTEM MARKET, BY END USER, 2014-2022 ($MILLION)
TABLE 37. EPIC SYSTEMS CORPORATION: COMPANY SNAPSHOT
TABLE 38. EPIC SYSTEMS CORPORATION: OPERATING SEGMENTS
TABLE 39. MEDINFORMATIX, INC.: COMPANY SNAPSHOT
TABLE 40. MEDINFORMATIX, INC.: OPERATING SEGMENTS
TABLE 41. GE HEALTHCARE: COMPANY SNAPSHOT
TABLE 42. CARESTREAM HEALTH, INC.: COMPANY SNAPSHOT
TABLE 43. CARESTREAM HEALTH, INC.: OPERATING SEGMENTS
TABLE 44. CERNER CORPORATION: COMPANY SNAPSHOT
TABLE 45. CERNER CORPORATION: OPERATING SEGMENTS
TABLE 46. IBM: COMPANY SNAPSHOT
TABLE 47. ALLSCRIPTS HEALTHCARE SOLUTIONS, INC.: COMPANY SNAPSHOT
TABLE 48. ALLSCRIPTS HEALTHCARE SOLUTIONS, INC.: OPERATING SEGMENTS
TABLE 49. MCKESSON CORPORATION: COMPANY SNAPSHOT
TABLE 50. MCKESSON CORPORATION: OPERATING SEGMENTS
TABLE 51. KONINKLIJKE PHILIPS N.V: COMPANY SNAPSHOT
TABLE 52. KONINKLIJKE PHILIPS N.V: OPERATING SEGMENTS
TABLE 53. SIEMENS HEALTHINEERS: COMPANY SNAPSHOT
TABLE 54. SIEMENS HEALTHINEERS: OPERATING SEGMET
LIST OF FIGURES
FIGURE 1. RADIOLOGY INFORMATION SYSTEM: MARKET SEGMENTATION
FIGURE 2. TOP INVESTMENT POCKETS IN RIS MARKET
FIGURE 3. TOP WINNING STRATEGIES: PERCENTAGE DISTRIBUTION, (2014 - 2016)
FIGURE 4. TOP WINNING STRATEGIES: NATURE AND TYPE
FIGURE 5. TOP WINNING STRATEGIES: NATURE AND TYPE
FIGURE 6. TOP PLAYER POSITIONING: RIS MARKET, 2015
FIGURE 7. PREVALENCE OF CHRONIC DISEASE-RELATED DEATHS IN DEVELOPED AND DEVELOPING ECONOMIES WORLDWIDE IN 2020
FIGURE 8. HEALTHCARE CLOUD COMPUTING MARKET
FIGURE 9. TOP COUNTRIES IN CYBER CRIME IN 2015 (%)
FIGURE 10. CYBER ATTACKS BY MEDICAL ENDPOINT DEVICES IN 2015 (%)
FIGURE 11. CYBER ATTACKS IN 2015 (%)
FIGURE 12. INDIAN HEALTHCARE INDUSTRY YEAR ON YEAR GROWTH ($BILLION)
FIGURE 13. ASIAN COUNTRIES INVESTMENT IN HEALTHCARE INDUSTRY AS A PERCENTAGE OF TOTAL GDP
FIGURE 14. U.S. RADIOLOGY INFORMATION SYSTEM MARKET, 2014-2022 ($MILLION)
FIGURE 15. CANADA RADIOLOGY INFORMATION SYSTEM MARKET, 2014-2022 ($MILLION)
FIGURE 16. MEXICO RADIOLOGY INFORMATION SYSTEM MARKET, 2014-2022 ($MILLION)
FIGURE 17. GERMANY RADIOLOGY INFORMATION SYSTEM MARKET, 2014-2022 ($MILLION)
FIGURE 18. FRANCE RADIOLOGY INFORMATION SYSTEM MARKET, 2014-2022 ($MILLION)
FIGURE 19. UK RADIOLOGY INFORMATION SYSTEM MARKET, 2014-2022 ($MILLION)
FIGURE 20. ITALY RADIOLOGY INFORMATION SYSTEM MARKET, 2014-2022 ($MILLION)
FIGURE 21. SPAIN RADIOLOGY INFORMATION SYSTEM MARKET, 2014-2022 ($MILLION)
FIGURE 22. REST OF EUROPE RADIOLOGY INFORMATION SYSTEM MARKET, 2014-2022 ($MILLION)
FIGURE 23. JAPAN RADIOLOGY INFORMATION SYSTEM MARKET, 2014-2022 ($MILLION)
FIGURE 24. CHINA RADIOLOGY INFORMATION SYSTEM MARKET, 2014-2022 ($MILLION)
FIGURE 25. INDIA RADIOLOGY INFORMATION SYSTEM MARKET, 2014-2022 ($MILLION)
FIGURE 26. REST OF ASIA PACIFIC RADIOLOGY INFORMATION SYSTEM MARKET, 2014-2022 ($MILLION)
FIGURE 27. LATIN AMERICA RADIOLOGY INFORMATION SYSTEM MARKET, 2014-2022 ($MILLION)
FIGURE 28. MIDDLE EAST RADIOLOGY INFORMATION SYSTEM MARKET, 2014-2022 ($MILLION)
FIGURE 29. AFRICA RADIOLOGY INFORMATION SYSTEM MARKET, 2014-2022 ($MILLION)
FIGURE 30. GE HEALTHCARE: REVENUE IN MILLION($)
FIGURE 31. GE HEALTHCARE: REVENUE BY SUB-SEGMENT, 2015 (%)
FIGURE 32. GE HEALTHCARE: REVENUE BY GEOGRAPHY, 2015 (%)
FIGURE 33. CERNER TOTAL REVENUE, 2013-2015 ($MILLION)
FIGURE 34. CERNER - REVENUE, BY PRODUCT CATEGORY, 2015 (%)
FIGURE 35. CERNER - REVENUE, BY GEOGRAPHY, 2015 (%)
FIGURE 36. IBM - REVENUE 2013-2015, ($MILLION)
FIGURE 37. IBM REVENUE, BY BUSINESS SEGMENT, 2015 (%)
FIGURE 38. IBM REVENUE, BY GEOGRAPHY, 2015 (%)
FIGURE 39. ALLSCRIPTS - REVENUE 2013-2015, ($MILLION)
FIGURE 40. ALLSCRIPTS REVENUE, BY GEOGROPHY, 2015 (%)
FIGURE 41. ALLSCRIPTS REVENUE, BY BUSINESS SEGMENT, 2015 (%)
FIGURE 42. MCKESSON CORPORATION OVERALL REVENUE, 2013-2015 ($MILLION)
FIGURE 43. MCKESSON CORPORATION REVENUE, BY OPERATIONAL SEGMENT CATEGORY, 2015 (%)
FIGURE 44. MCKESSON CORPORATION REVENUE, BY GEOGRAPHY, 2015 (%)
FIGURE 45. PHILIPS: REVENUE, 2013-2015, ($MILLION)
FIGURE 46. PHILIPS: REVENUE BY SEGMENT, 2015 (%)
FIGURE 47. PHILIPS: HEALTHCARE REVENUE, BY SUB-SEGMENT, 2015 (%)
FIGURE 48. PHILIPS: REVENUE, BY GEOGRAPHY, 2015 (%)
FIGURE 49. SEIMENS: NET SALES ($MILLION), 2013-2015
The global radiology information system market is primarily driven by improvement in healthcare infrastructure, adoption of cloud-based healthcare IT services, and increase in healthcare expenditure. The Asia-Pacific region has a huge market potential for the radiology information systems market. India and China are two rapidly growing economies followed by South Korea, in the Asia-Pacific region. With the increase in economies, the governments in these countries make several efforts to cater to the demand for better and improved healthcare services and infrastructure. Healthcare IT related services helps to maintain a real-time bridge between all healthcare entities and is projected to minimize manual errors and help cut down healthcare expenditure. The Indian healthcare industry is booming rapidly with an estimated CAGR of 24% during the forecast period.
The U.S. dominated the radiology information system market in 2015 owing to high adoption rate of healthcare IT services and well-established systems in the region. Major companies involved in the RIS market are Epic Systems Corporation, MedInformatix, Inc., GE Healthcare, Carestream Health, Inc., Cerner Corporation, Merge Healthcare Incorporated, and others.
Access from any device, anywhere
Clients can easily download both quantitative as well as
qualitative reports in PDF and excel formats.
Download Sample
Purchase Full Report of
Radiology Information System Market- Global Opportunity Analysis and Industry Forecast, 2014-2022
- Online Only
- $3,565
- Online cloud access only
- Restricted print, copy, paste & download
- Read only
- Free quarterly industry update
- Free report update (Within 180 days)
- Subscription model sign in
- Data Pack
- $3,961
- Restricted to one authorized user
- One print only
- Available in
Excel - Free quarterly industry update
- Free report update (Within 180 days)
- Subscription model sign in
- Single User
- $5,939
- Restricted to one authorized user
- One print only
- Available in Excel & PDF
- Free quarterly industry update
- Free report update (Within 180 days)
- Subscription model sign in
- Five Users
- $6,654
- Limited to five authorized users
- Print upto five copies
- Available in Excel & PDF
- Free quarterly industry update
- Free report update (Within 180 days)
- Subscription model sign in
-
Enterprise
License/PDF - $9,280
- Unlimited
within
company/enterprise - Available in Excel & PDF
- Free quarterly industry update
- Free report update (Within 180 days)
- Subscription model sign in
- Library Membership
- $ 699/mo
- Published Content
E-access - Company Profiles
E-access - Newly Added Content Access
- 10 PDF
Downloads - 5 Excel Data
Pack Downloads - 250 Company Profiles PDF Downloads
-
Start reading instantly.
Buy Now
This title and over 12,000+ are available on the Avenue Library. T&C*.
*Taxes/Fees, if applicable will be added during checkout. All prices in USD
Why Allied Market Research?
Infallible Methodology
To ensure high-level data integrity, accurate analysis, and impeccable forecasts
Analyst Support
For complete satisfaction
Customization
On-demand customization of scope of the report to exactly meet your needs
TARGETED MARKET VIEW
Targeted market view to provide pertinent information and save time of readers
Featured Reports
Get fresh content delivered
Get insights on topics that are crucial for your business. Stay abreast of your interest areas.
Why Allied Market Research?
Infallible Methodology
To ensure high-level data integrity, accurate analysis, and impeccable forecasts
Analyst Support
For complete satisfaction
Customization
On-demand customization of scope of the report to exactly meet your needs
TARGETED MARKET VIEW
Targeted market view to provide pertinent information and save time of readers