0
2018
Semiconductor Ip Market

Semiconductor IP Market

by Design IP (Processor IP, Interface IP, Memory IP, and Other IP), by IP Source (Licensing, Royalty, and Servicing), and Application (Consumer Electronics, Telecom, Automotive, Aerospace, Healthcare, Agriculture, and Others) - Global Opportunity Analysis and Industry Forecast, 2018-2024

Report Code: A04289
May 2018 | Pages: 287
Tables: 111
Charts: 64
  • Formats*:

  • pdf

    Single User License, Five User
    License & Enterprise User License

  • xls

    Data Pack Excel License

  • ppt

    It comes with the additional cost
    of $2500.00 contact sales.


COVID-19

Pandemic disrupted the entire world and affected many industries.

Get detailed COVID-19 impact analysis on the Semiconductor Ip Market

Request Now !

Semiconductor IP Market Overview:

The Global Semiconductor IP Market was valued at $3,434 million in 2017, and is projected to reach $5,701 million by 2024, growing at a CAGR of 7.30% from 2018 to 2024. Semiconductor intellectual property (IP), also known as IP cores are the reusable design components. Semiconductor IP is used to build advanced integrated circuits (IC’s). These design components are traded as rights to use and copy the design, and hence called as the intellectual property. These IP cores are combined to create system on chip (SoCs), application specific integrated circuits (ASICs), and application specific standard products (ASSPs).

Semiconductor IP industry has existed since the advent of the semiconductor industry. As part of Field Programmable Gate Array (FPGA) or Application-Specific Integrated Circuit (ASIC), IP cores are often the building blocks of the design itself.

The growth of the global Semiconductor IP market is driven by Rise in demand of the modern system on chip (SoC) design, and reduction in manufacturing and design cost. However, fluctuations in the development or functionality of the chips restrain the market growth. On the contrary, rising demand for the consumer electronics, and new technological developments is expected to provide lucrative growth opportunities for the market.

The major companies profiled in the report include ARM, Synopsys, Imagination Technologies, Cadence, Ceva, Verisillicon, eMemory Technology, Rambus, Lattice (Silicon Image), and Sonics.

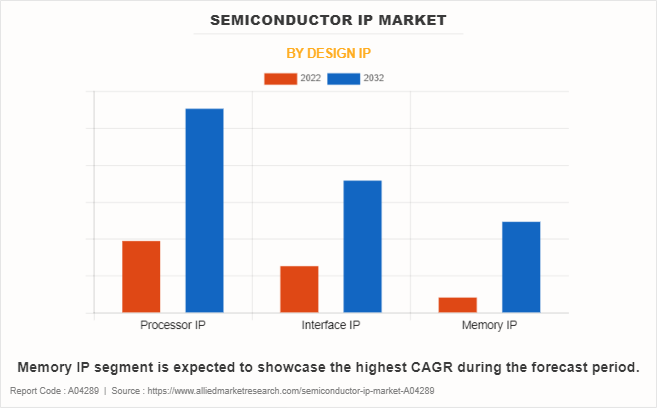
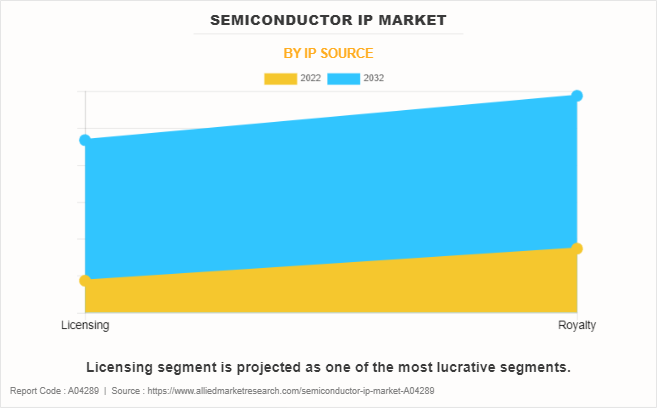
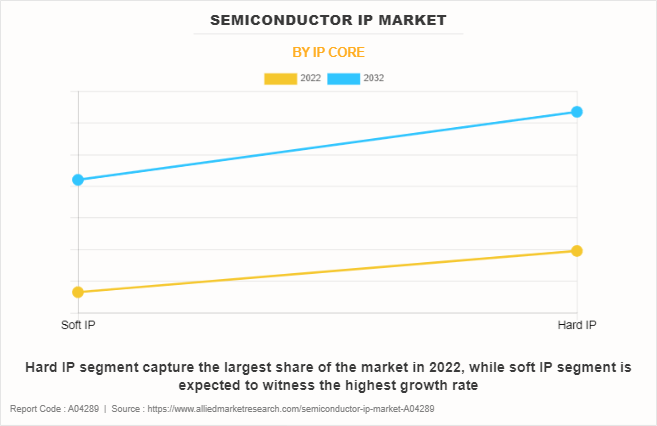
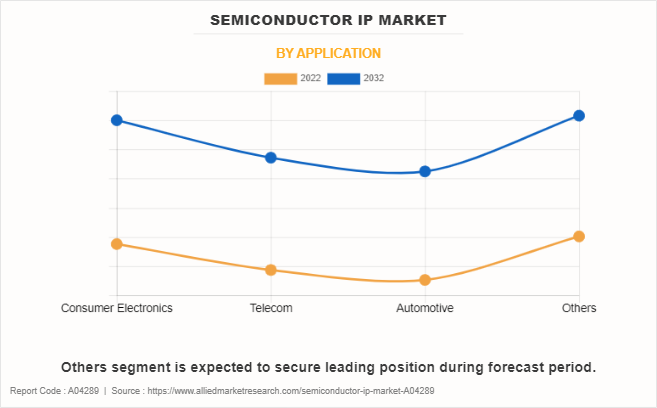
The global semiconductor IP market is segmented based on design IP, IP source, application, and region. Based on design IP, the market is categorized into processor IP, interface IP, memory IP, and other IP. Processor IP is then further subdivided into microprocessor unit, microcontroller unit, and digital signal processor. Other IP is sub bifurcated into analog-to-digital (ADC) converter and digital-to-analog (DAC) converter. Depending on IP source, it is divided into licensing, royalty, and services. By application, it is classified into consumer electronics, telecom, automotive, aerospace, healthcare, agriculture, and others (government, hospitality, and more). Based on region, the market is analyzed across North America, Europe, Asia-Pacific, and LAMEA.

Top Impacting Factors

Rise in demand of the modern system on chip (SoC) design and reduction in manufacturing and design cost impact the growth of the market. In addition, fluctuations in the development or functionality of the chips affect the growth of the global semiconductor IP market. These factors are anticipated to either drive or hamper the market growth.

Increase in Demand of the Modern System on Chip (SoC) Design

Semiconductor IP blocks are combined with the system on-chip (SoCs) and application specific integrated circuit (ASICs) products. Such products are then used for the production of chips, which are then installed in MP3 players, automobiles, televisions, mobile phones, and more. In addition, there is rise in the demand for smart and power efficient devices, which propels the demand for the SoCs. This in turn is anticipated to fuel the growth of the global semiconductor IP market.

Reduction in Manufacturing and Design Cost

There is continuous reduction in the design and the development of the semiconductor IP. For instance, use of monolithic 3D IC technology is projected to reduce the cost of the wafer due to reduced die size, scaling up of the processes, heterogeneous integration, and multiple layers processed together. This cost reduction supplements the growth of the semiconductor IP market.

Fluctuations in the Development or Functionality of the Chips

There is possibility that in near future, the market could lead to dead end due to the continuous changes in the functionality or development of the chips. Such fluctuations in the chips are expected to hamper the stated market growth. To avoid such circumstances, the semiconductor IP market should focus on the upgradation of the equipment on a periodic basis.

Rise in Demand for the Consumer Electronics

Consumer electronics includes various types of products such as televisions, cameras & camcorders, notebooks, audio/video devices, smartphones & tablets, desktops, laptops, gaming consoles and accessories, home appliances, wearable electronics, and others. There is a rise in demand for the consumer electronics especially in the developing countries such as India, China, and more. Factors like rising disposable incomes, emerging middle class, and progressive government reforms are propelling the demand for consumer electronics even further. Consumer electronics such as televisions, mobile phones, MP3 players, and more includes chips such as System on Chip (SoCs). SoC’s are combined with the semiconductor IP blocks. The semiconductor IP helps companies to increase their revenue and not waste time on designing the whole circuit every time. This in turn is anticipated to create numerous opportunities for the key players operating in the global semiconductor IP market.

New Technological Developments

New technologies such as graphene transistors, self-organising molecular devices, carbon nanotubes, and quantum computing can potentially bypass the physical limits of traditionally known semiconductor technologies. Furthermore, such radical new technologies have ability to substitute current technologies which could create ample number of opportunities for the semiconductor IP market.

Competitive analysis

Competitive analysis and profiles of the major global semiconductor IP market players that have been provided in the report include Verisilicon Holdings Co., Ltd., Cadence Design Systems, Inc., Ceva, Inc., eMemory Technology Inc., Rambus Inc., Imagination Technologies Group Plc, Synopsys, Inc., Sonics, Inc., Arm Holdings Plc, and Lattice Semiconductor Corporation. The key strategies adopted by the major players of the semiconductor IP market are product launch and product development.

Historical Data & Information 

The global semiconductor IP market is highly competitive, owing to the strong presence of existing vendors. Vendors of the semiconductor IP market with extensive technical and financial resources are expected to gain a competitive advantage over their competitors because they can cater to market demands. The competitive environment in this market is expected to get intense as technological innovations, product extensions, and different strategies adopted by key vendors increase.

Key Developments/ Strategies 

Verisilicon Holdings Co., Ltd., Cadence Design Systems, Inc., Ceva, Inc., eMemory Technology Inc., Rambus Inc., Imagination Technologies Group Plc, Synopsys, Inc., Sonics, Inc., Arm Holdings Plc, and Lattice Semiconductor Corporation are the top companies holding a prime share in the semiconductor IP market. Top market players have adopted various strategies, such as product launch and product development to expand their foothold in the semiconductor IP market.

  • In June 2022, Vissonic Electronics Ltd. upgraded its teleconferencing system by launching the Vissonic 5G Wi-Fi Wireless conference system in the meeting room. It includes a wireless microphone, conference system, and presentation system, as well as a 5G Wi-Fi wireless access point for convenient local video and audio access.
  • In June 2022, Imagination, a semiconductor intellectual property IP corporation based in the United Kingdom, has introduced a semiconductor IP service that does not collect license fees. These IP services include technical assistance and maintenance.
  • In August 2021, Rambus Incorporated, a developed and licensed chip manufacturer, acquired PLDA SAS, a semiconductor intellectual property licensor. This acquisition broadened the company's digital controller products and provided building pieces for its CXL Memory Interconnect Initiative.

Key Benefits

  • This study comprises analytical depiction of the global semiconductor IP market size with current trends and future estimations to depict the imminent investment pockets.
  • The overall semiconductor IP industry potential is determined to understand the profitable trends to gain a stronger foothold.
  • The report presents information related to key drivers, restraints, and opportunities with a detailed impact analysis.
  • The current semiconductor IP market is quantitatively analyzed from 2018 to 2024 to benchmark the financial competency.
  • Porter’s Five Forces analysis illustrates the potency of the buyers and suppliers in the semiconductor IP market.
  • The report includes Semiconductor IP Market Share of key vendors and Semiconductor IP Market Trends.

Semiconductor IP Market Report Highlights

Aspects Details
By Design Ip
  • Processor IP
  • Interface IP
  • Memory IP
  • Other IP
By Ip Source
  • Licensing
  • Royalty
  • Servicing
By Application
  • Consumer Electronics
  • Telecom
  • Automotive
  • Aerospace
  • Healthcare
  • Agriculture
  • Others
By Region
  • North America  (U.S., Canada, Mexico)
  • Europe  (UK, Germany, France, Spain, Italy, Rest of Europe)
  • Asia-Pacific  (China, Japan, India, Australia, South Korea, Rest of Asia-Pacific)
  • LAMEA  (Latin America, Middle East, Africa)
Key Market Players RAMBUS INC., SYNOPSYS, INC., EMEMORY TECHNOLOGY INC., SONICS, INC., VERISILICON HOLDINGS CO., LTD., ARM HOLDINGS PLC, LATTICE SEMICONDUCTOR CORPORATION, CEVA, INC., IMAGINATION TECHNOLOGIES GROUP PLC, CADENCE DESIGN SYSTEMS, INC.


CHAPTER 1: INTRODUCTION

1.1. REPORT DESCRIPTION
1.2. KEY BENEFITS FOR STAKEHOLDERS
1.3. KEY MARKET SEGMENTS
1.4. RESEARCH METHODOLOGY

1.4.1. Primary research
1.4.2. Secondary research
1.4.3. Analyst tools and models

CHAPTER 2: EXECUTIVE SUMMARY

2.1. CXO PERSPECTIVE

CHAPTER 3: MARKET OVERVIEW

3.1. MARKET DEFINITION AND SCOPE
3.2. KEY FINDINGS

3.2.1. Top impacting factors
3.2.2. Top investment pockets
3.2.3. Top winning strategies

3.3. PORTER’S FIVE FORCES ANALYSIS

3.3.1. Moderate-to-high bargaining power of suppliers
3.3.2. Moderate threat of new entrants
3.3.3. Moderate threat of substitutes
3.3.4. Moderate-to-high intensity of rivalry
3.3.5. Moderate bargaining power of buyers

3.4. MARKET SHARE ANALYSIS, 2017
3.5. MARKET DYNAMICS

3.5.1. Drivers

3.5.1.1. Rise in demand of the modern System on Chip (SoC) design
3.5.1.2. Reduction in manufacturing and design cost

3.5.2. Restraint

3.5.2.1. Fluctuations in the development or functionality of the chips.

3.5.3. Opportunity

3.5.3.1. Rise in demand for the consumer electronics
3.5.3.2. New technological developments

CHAPTER 4: SEMICONDUCTOR IP MARKET, BY DESIGN IP

4.1. OVERVIEW
4.2. PROCESSOR IP

4.2.1. Key market trends, growth factors, and opportunities
4.2.2. Market size and forecast, by region
4.2.3. Market analysis, by country
4.2.4. Market size and forecast, by sub-segment:

4.3. INTERFACE IP

4.3.1. Key market trends, growth factors, and opportunities
4.3.2. Market size and forecast, by region
4.3.3. Market analysis, by country

4.4. MEMORY IP

4.4.1. Key market trends, growth factors, and opportunities
4.4.2. Market size and forecast, by region
4.4.3. Market analysis, by country

4.5. OTHER IP

4.5.1. Key market trends, growth factors, and opportunities
4.5.2. Market size and forecast, by region
4.5.3. Market analysis, by country
4.5.4. Market size and forecast, by sub-segment:

CHAPTER 5: SEMICONDUCTOR IP MARKET, BY IP SOURCE

5.1. OVERVIEW
5.2. LICENSING

5.2.1. Key market trends, growth factors, and opportunities
5.2.2. Market size and forecast, by region
5.2.3. Market analysis, by country

5.3. ROYALTY

5.3.1. Key market trends, growth factors, and opportunities
5.3.2. Market size and forecast, by region
5.3.3. Market analysis, by country

5.4. SERVICING

5.4.1. Key market trends, growth factors, and opportunities
5.4.2. Market size and forecast, by region
5.4.3. Market analysis, by country

CHAPTER 6: SEMICONDUCTOR IP MARKET, BY APPLICATION

6.1. OVERVIEW
6.2. CONSUMER ELECTRONICS

6.2.1. Key market trends, growth factors, and opportunities
6.2.2. Market size and forecast, by region
6.2.3. Market analysis, by country

6.3. TELECOM

6.3.1. Key market trends, growth factors, and opportunities
6.3.2. Market size and forecast, by region
6.3.3. Market analysis, by country

6.4. AUTOMOTIVE

6.4.1. Key market trends, growth factors, and opportunities
6.4.2. Market size and forecast, by region
6.4.3. Market analysis, by country

6.5. AEROSPACE

6.5.1. Key market trends, growth factors, and opportunities
6.5.2. Market size and forecast, by region
6.5.3. Market analysis, by country

6.6. HEALTHCARE

6.6.1. Key market trends, growth factors, and opportunities
6.6.2. Market size and forecast, by region
6.6.3. Market analysis, by country

6.7. AGRICULTURE

6.7.1. Key market trends, growth factors, and opportunities
6.7.2. Market size and forecast, by region
6.7.3. Market analysis, by country

6.8. OTHERS

6.8.1. Key market trends, growth factors, and opportunities
6.8.2. Market size and forecast, by region
6.8.3. Market analysis, by country

CHAPTER 7: SEMICONDUCTOR IP MARKET, BY REGION

7.1. OVERVIEW
7.2. NORTH AMERICA

7.2.1. Key market trends, growth factors, and opportunities
7.2.2. Market size and forecast, by design IP
7.2.3. Market size and forecast, by IP source
7.2.4. Market size and forecast, by Application
7.2.5. Market analysis, by country
7.2.6. U.S.

7.2.6.1. Market size and forecast, by design IP
7.2.6.2. Market size and forecast, by IP source
7.2.6.3. Market size and forecast, by Application

7.2.7. Canada

7.2.7.1. Market size and forecast, by design IP
7.2.7.2. Market size and forecast, by IP source
7.2.7.3. Market size and forecast, by Application

7.2.8. Mexico

7.2.8.1. Market size and forecast, by design IP
7.2.8.2. Market size and forecast, by IP source
7.2.8.3. Market size and forecast, by Application

7.3. EUROPE

7.3.1. Key market trends, growth factors, and opportunities
7.3.2. Market size and forecast, by design IP
7.3.3. Market size and forecast, by IP source
7.3.4. Market size and forecast, by Application
7.3.5. Market analysis, by country
7.3.6. U.K.

7.3.6.1. Market size and forecast, by design IP
7.3.6.2. Market size and forecast, by IP source
7.3.6.3. Market size and forecast, by Application

7.3.7. Germany

7.3.7.1. Market size and forecast, by design IP
7.3.7.2. Market size and forecast, by IP source
7.3.7.3. Market size and forecast, by Application

7.3.8. France

7.3.8.1. Market size and forecast, by design IP
7.3.8.2. Market size and forecast, by IP source
7.3.8.3. Market size and forecast, by Application

7.3.9. Spain

7.3.9.1. Market size and forecast, by design IP
7.3.9.2. Market size and forecast, by IP source
7.3.9.3. Market size and forecast, by Application

7.3.10. Italy

7.3.10.1. Market size and forecast, by design IP
7.3.10.2. Market size and forecast, by IP source
7.3.10.3. Market size and forecast, by Application

7.3.11. Rest of Europe

7.3.11.1. Market size and forecast, by design IP
7.3.11.2. Market size and forecast, by IP source
7.3.11.3. Market size and forecast, by Application

7.4. ASIA-PACIFIC

7.4.1. Key market trends, growth factors, and opportunities
7.4.2. Market size and forecast, by design IP
7.4.3. Market size and forecast, by IP source
7.4.4. Market size and forecast, by Application
7.4.5. Market analysis, by country
7.4.6. China

7.4.6.1. Market size and forecast, by design IP
7.4.6.2. Market size and forecast, by IP source
7.4.6.3. Market size and forecast, by Application

7.4.7. Japan

7.4.7.1. Market size and forecast, by design IP
7.4.7.2. Market size and forecast, by IP source
7.4.7.3. Market size and forecast, by Application

7.4.8. India

7.4.8.1. Market size and forecast, by design IP
7.4.8.2. Market size and forecast, by IP source
7.4.8.3. Market size and forecast, by Application

7.4.9. Australia

7.4.9.1. Market size and forecast, by design IP
7.4.9.2. Market size and forecast, by IP source
7.4.9.3. Market size and forecast, by Application

7.4.10. South Korea

7.4.10.1. Market size and forecast, by design IP
7.4.10.2. Market size and forecast, by IP source
7.4.10.3. Market size and forecast, by Application

7.4.11. Rest of Asia-Pacific

7.4.11.1. Market size and forecast, by design IP
7.4.11.2. Market size and forecast, by IP source
7.4.11.3. Market size and forecast, by Application

7.5. LAMEA

7.5.1. Key market trends, growth factors, and opportunities
7.5.2. Market size and forecast, by design IP
7.5.3. Market size and forecast, by IP source
7.5.4. Market size and forecast, by Application
7.5.5. Market analysis, by country
7.5.6. Latin America

7.5.6.1. Market size and forecast, by design IP
7.5.6.2. Market size and forecast, by IP source
7.5.6.3. Market size and forecast, by Application

7.5.7. Middle East

7.5.7.1. Market size and forecast, by design IP
7.5.7.2. Market size and forecast, by IP source
7.5.7.3. Market size and forecast, by Application

7.5.8. Africa

7.5.8.1. Market size and forecast, by design IP
7.5.8.2. Market size and forecast, by IP source
7.5.8.3. Market size and forecast, by Application

CHAPTER 8: COMPANY PROFILES

8.1. ARM HOLDINGS PLC

8.1.1. Company overview
8.1.2. Company snapshot
8.1.3. Operating business segments
8.1.4. Business performance
8.1.5. Key strategic moves and developments

8.2. SYNOPSYS, INC.

8.2.1. Company overview
8.2.2. Company snapshot
8.2.3. Operating business segments
8.2.4. Business performance
8.2.5. Key strategic moves and developments

8.3. IMAGINATION TECHNOLOGIES GROUP PLC

8.3.1. Company overview
8.3.2. Company snapshot
8.3.3. Operating business segments
8.3.4. Product portfolio
8.3.5. Business performance

8.4. CADENCE DESIGN SYSTEMS, INC.

8.4.1. Company overview
8.4.2. Company snapshot
8.4.3. Operating business segments
8.4.4. Product portfolio
8.4.5. Business performance
8.4.6. Key strategic moves and developments

8.5. CEVA, INC.

8.5.1. Company overview
8.5.2. Company snapshot
8.5.3. Product portfolio
8.5.4. Business performance
8.5.5. Key strategic moves and developments

8.6. VERISILICON HOLDINGS CO., LTD.

8.6.1. Company overview
8.6.2. Company snapshot
8.6.3. Operating business segments
8.6.4. Key strategic moves and developments

8.7. EMEMORY TECHNOLOGY INC.

8.7.1. Company overview
8.7.2. Company snapshot
8.7.3. Operating business segments
8.7.4. Product portfolio
8.7.5. Business performance
8.7.6. Key strategic moves and developments

8.8. RAMBUS INC.

8.8.1. Company overview
8.8.2. Company snapshot
8.8.3. Operating business segments
8.8.4. Product portfolio
8.8.5. Business performance
8.8.6. Key strategic moves and developments

8.9. LATTICE SEMICONDUCTOR CORPORATION

8.9.1. Company overview
8.9.2. Company snapshot
8.9.3. Operating business segments
8.9.4. Product portfolio
8.9.5. Business performance
8.9.6. Key strategic moves and developments

8.10. SONICS, INC.

8.10.1. Company overview
8.10.2. Company snapshot
8.10.3. Operating business segments
8.10.4. Key strategic moves and developments

LIST OF TABLES

TABLE 01. GLOBAL SEMICONDUCTOR IP MARKET, BY DESIGN IP, 2017-2024 ($MILLION)
TABLE 02. PROCESSOR IP MARKET REVENUE, BY REGION, 2017-2024 ($MILLION)
TABLE 03. PROCESSOR IP MARKET REVENUE, BY SUB-SEGMENT, 2017-2024 ($MILLION)
TABLE 04. INTERFACE IP MARKET REVENUE, BY REGION, 2017-2024 ($MILLION)
TABLE 05. MEMORY IP MARKET REVENUE, BY REGION, 2017-2024 ($MILLION)
TABLE 06. OTHER IP MARKET REVENUE, BY REGION, 2017-2024 ($MILLION)
TABLE 07. OTHER IP MARKET REVENUE, BY SUB-SEGMENT, 2017-2024 ($MILLION)
TABLE 08. GLOBAL SEMICONDUCTOR IP MARKET, BY IP SOURCE, 2017-2024 ($MILLION)
TABLE 09. SEMICONDUCTOR IP MARKET REVENUE FOR LICENSING, BY REGION, 2017-2024 ($MILLION)
TABLE 10. SEMICONDUCTOR IP MARKET REVENUE FOR ROYALTY, BY REGION, 2017-2024 ($MILLION)
TABLE 11. SEMICONDUCTOR IP MARKET REVENUE FOR SERVICING, BY REGION, 2017-2024 ($MILLION)
TABLE 12. GLOBAL SEMICONDUCTOR IP MARKET, BY APPLICATION, 2017-2024 ($MILLION)
TABLE 13. SEMICONDUCTOR IP MARKET REVENUE FOR COSUMER ELECTRONICS, BY REGION, 2017-2024 ($MILLION)
TABLE 14. SEMICONDUCTOR IP MARKET REVENUE FOR TELECOM, BY REGION, 2017-2024 ($MILLION)
TABLE 15. SEMICONDUCTOR IP MARKET REVENUE FOR AUTOMOTIVE, BY REGION, 2017-2024 ($MILLION)
TABLE 16. SEMICONDUCTOR IP MARKET REVENUE FOR AEROSPACE, BY REGION, 2017-2024 ($MILLION)
TABLE 17. SEMICONDUCTOR IP MARKET REVENUE FOR HEALTHCARE, BY REGION, 2017-2024 ($MILLION)
TABLE 18. SEMICONDUCTOR IP MARKET REVENUE FOR AGRICULTURE, BY REGION, 2017-2024 ($MILLION)
TABLE 19. SEMICONDUCTOR IP MARKET REVENUE FOR OTHERS, BY REGION, 2017-2024 ($MILLION)
TABLE 20. SEMICONDUCTOR IP MARKET, BY REGION, 2017-2024 ($MILLION)
TABLE 21. NORTH AMERICAN SEMICONDUCTOR IP MARKET, BY DESIGN IP, 2017-2024 ($MILLION)
TABLE 22. NORTH AMERICAN SEMICONDUCTOR IP MARKET, BY IP SOURCE, 2017-2024 ($MILLION)
TABLE 23. NORTH AMERICAN SEMICONDUCTOR IP MARKET, BY APPLICATION, 2017-2024 ($MILLION)
TABLE 24. U.S. SEMICONDUCTOR IP MARKET, BY DESIGN IP, 2017-2024 ($MILLION)
TABLE 25. U.S. SEMICONDUCTOR IP MARKET, BY IP SOURCE, 2017-2024 ($MILLION)
TABLE 26. U.S. SEMICONDUCTOR IP MARKET, BY APPLICATION, 2017-2024 ($MILLION)
TABLE 27. CANADA SEMICONDUCTOR IP MARKET, BY DESIGN IP, 2017-2024 ($MILLION)
TABLE 28. CANADA SEMICONDUCTOR IP MARKET, BY IP SOURCE, 2017-2024 ($MILLION)
TABLE 29. CANADA SEMICONDUCTOR IP MARKET, BY APPLICATION, 2017-2024 ($MILLION)
TABLE 30. MEXICO SEMICONDUCTOR IP MARKET, BY DESIGN IP, 2017-2024 ($MILLION)
TABLE 31. MEXICO SEMICONDUCTOR IP MARKET, BY IP SOURCE, 2017-2024 ($MILLION)
TABLE 32. MEXICO SEMICONDUCTOR IP MARKET, BY APPLICATION, 2017-2024 ($MILLION)
TABLE 33. EUROPE SEMICONDUCTOR IP MARKET, BY DESIGN IP, 2017-2024 ($MILLION)
TABLE 34. EUROPE SEMICONDUCTOR IP MARKET, BY IP SOURCE, 2017-2024 ($MILLION)
TABLE 35. EUROPE SEMICONDUCTOR IP MARKET, BY APPLICATION, 2017-2024 ($MILLION)
TABLE 36. U.K. SEMICONDUCTOR IP MARKET, BY DESIGN IP, 2017-2024 ($MILLION)
TABLE 37. U.K. SEMICONDUCTOR IP MARKET, BY IP SOURCE, 2017-2024 ($MILLION)
TABLE 38. U.K. SEMICONDUCTOR IP MARKET, BY APPLICATION, 2017-2024 ($MILLION)
TABLE 39. GERMANY SEMICONDUCTOR IP MARKET, BY DESIGN IP, 2017-2024 ($MILLION)
TABLE 40. GERMANY SEMICONDUCTOR IP MARKET, BY IP SOURCE, 2017-2024 ($MILLION)
TABLE 41. GERMANY SEMICONDUCTOR IP MARKET, BY APPLICATION, 2017-2024 ($MILLION)
TABLE 42. FRANCE SEMICONDUCTOR IP MARKET, BY DESIGN IP, 2017-2024 ($MILLION)
TABLE 43. FRANCE SEMICONDUCTOR IP MARKET, BY IP SOURCE, 2017-2024 ($MILLION)
TABLE 44. FRANCE SEMICONDUCTOR IP MARKET, BY APPLICATION, 2017-2024 ($MILLION)
TABLE 45. SPAIN SEMICONDUCTOR IP MARKET, BY DESIGN IP, 2017-2024 ($MILLION)
TABLE 46. SPAIN SEMICONDUCTOR IP MARKET, BY IP SOURCE, 2017-2024 ($MILLION)
TABLE 47. SPAIN SEMICONDUCTOR IP MARKET, BY APPLICATION, 2017-2024 ($MILLION)
TABLE 48. ITALY SEMICONDUCTOR IP MARKET, BY DESIGN IP, 2017-2024 ($MILLION)
TABLE 49. ITALY SEMICONDUCTOR IP MARKET, BY IP SOURCE, 2017-2024 ($MILLION)
TABLE 50. ITALY SEMICONDUCTOR IP MARKET, BY APPLICATION, 2017-2024 ($MILLION)
TABLE 51. REST OF EUROPE SEMICONDUCTOR IP MARKET, BY DESIGN IP, 2017-2024 ($MILLION)
TABLE 52. REST OF EUROPE SEMICONDUCTOR IP MARKET, BY IP SOURCE, 2017-2024 ($MILLION)
TABLE 53. REST OF EUROPE SEMICONDUCTOR IP MARKET, BY APPLICATION, 2017-2024 ($MILLION)
TABLE 54. ASIA-PACIFIC SEMICONDUCTOR IP MARKET, BY DESIGN IP, 2017-2024 ($MILLION)
TABLE 55. ASIA-PACIFIC SEMICONDUCTOR IP MARKET, BY IP SOURCE, 2017-2024 ($MILLION)
TABLE 56. ASIA-PACIFIC SEMICONDUCTOR IP MARKET, BY APPLICATION, 2017-2024 ($MILLION)
TABLE 57. CHINA SEMICONDUCTOR IP MARKET, BY DESIGN IP, 2017-2024 ($MILLION)
TABLE 58. CHINA SEMICONDUCTOR IP MARKET, BY IP SOURCE, 2017-2024 ($MILLION)
TABLE 59. CHINA SEMICONDUCTOR IP MARKET, BY APPLICATION, 2017-2024 ($MILLION)
TABLE 60. JAPAN SEMICONDUCTOR IP MARKET, BY DESIGN IP, 2017-2024 ($MILLION)
TABLE 61. JAPAN SEMICONDUCTOR IP MARKET, BY IP SOURCE, 2017-2024 ($MILLION)
TABLE 62. JAPAN SEMICONDUCTOR IP MARKET, BY APPLICATION, 2017-2024 ($MILLION)
TABLE 63. INDIA SEMICONDUCTOR IP MARKET, BY DESIGN IP, 2017-2024 ($MILLION)
TABLE 64. INDIA SEMICONDUCTOR IP MARKET, BY IP SOURCE, 2017-2024 ($MILLION)
TABLE 65. INDIA SEMICONDUCTOR IP MARKET, BY APPLICATION, 2017-2024 ($MILLION)
TABLE 66. AUSTRALIA SEMICONDUCTOR IP MARKET, BY DESIGN IP, 2017-2024 ($MILLION)
TABLE 67. AUSTRALIA SEMICONDUCTOR IP MARKET, BY IP SOURCE, 2017-2024 ($MILLION)
TABLE 68. AUSTRALIA SEMICONDUCTOR IP MARKET, BY APPLICATION, 2017-2024 ($MILLION)
TABLE 69. SOUTH KOREA SEMICONDUCTOR IP MARKET, BY DESIGN IP, 2017-2024 ($MILLION)
TABLE 70. SOUTH KOREA SEMICONDUCTOR IP MARKET, BY IP SOURCE, 2017-2024 ($MILLION)
TABLE 71. SOUTH KOREA SEMICONDUCTOR IP MARKET, BY APPLICATION, 2017-2024 ($MILLION)
TABLE 72. REST OF ASIA-PACIFIC SEMICONDUCTOR IP MARKET, BY DESIGN IP, 2017-2024 ($MILLION)
TABLE 73. REST OF ASIA-PACIFIC SEMICONDUCTOR IP MARKET, BY IP SOURCE, 2017-2024 ($MILLION)
TABLE 74. REST OF ASIA-PACIFIC SEMICONDUCTOR IP MARKET, BY APPLICATION, 2017-2024 ($MILLION)
TABLE 75. LAMEA SEMICONDUCTOR IP MARKET, BY DESIGN IP, 2017-2024 ($MILLION)
TABLE 76. LAMEA SEMICONDUCTOR IP MARKET, BY IP SOURCE, 2017-2024 ($MILLION)
TABLE 77. LAMEA SEMICONDUCTOR IP MARKET, BY APPLICATION, 2017-2024 ($MILLION)
TABLE 78. LATIN AMERICA SEMICONDUCTOR IP MARKET, BY DESIGN IP, 2017-2024 ($MILLION)
TABLE 79. LATIN AMERICA SEMICONDUCTOR IP MARKET, BY IP SOURCE, 2017-2024 ($MILLION)
TABLE 80. LATIN AMERICA SEMICONDUCTOR IP MARKET, BY APPLICATION, 2017-2024 ($MILLION)
TABLE 81. MIDDLE EAST SEMICONDUCTOR IP MARKET, BY DESIGN IP, 2017-2024 ($MILLION)
TABLE 82. MIDDLE EAST SEMICONDUCTOR IP MARKET, BY IP SOURCE, 2017-2024 ($MILLION)
TABLE 83. MIDDLE EAST SEMICONDUCTOR IP MARKET, BY APPLICATION, 2017-2024 ($MILLION)
TABLE 84. AFRICA SEMICONDUCTOR IP MARKET, BY DESIGN IP, 2017-2024 ($MILLION)
TABLE 85. AFRICA SEMICONDUCTOR IP MARKET, BY IP SOURCE, 2017-2024 ($MILLION)
TABLE 86. AFRICA SEMICONDUCTOR IP MARKET, BY APPLICATION, 2017-2024 ($MILLION)
TABLE 87. ARM HOLDINGS PLC: COMPANY SNAPSHOT
TABLE 88. ARM HOLDINGS PLC: PRODUCT CATEGORY
TABLE 89. SYNOPSYS, INC: COMPANY SNAPSHOT
TABLE 90. SYNOPSYS, INC: PRODUCT CATEGORY
TABLE 91. IMAGINATION TECHNOLOGIES GROUP PLC: COMPANY SNAPSHOT
TABLE 92. IMAGINATION TECHNOLOGIES GROUP PLC: OPERATING SEGMENTS
TABLE 93. IMAGINATION TECHNOLOGIES GROUP PLC: PRODUCT PORTFOLIO
TABLE 94. CADENCE DESIGN SYSTEMS, INC: COMPANY SNAPSHOT
TABLE 95. CADENCE DESIGN SYSTEMS, INC: OPERATING SEGMENTS
TABLE 96. CADENCE DESIGN SYSTEMS, INC: PRODUCT PORTFOLIO
TABLE 97. CEVA, INC: COMPANY SNAPSHOT
TABLE 98. CEVA, INC: PRODUCT PORTFOLIO
TABLE 99. VERISILICON HOLDINGS CO., LTD: COMPANY SNAPSHOT
TABLE 100. VERISILICON HOLDINGS CO., LTD: PRODUCT CATEGORY
TABLE 101. EMEMORY TECHNOLOGY INC: COMPANY SNAPSHOT
TABLE 102. EMEMORY TECHNOLOGY INC:  PRODUCT CATEGORY
TABLE 103. EMEMORY TECHNOLOGY INC: PRODUCT PORTFOLIO
TABLE 104. RAMBUS INC.: COMPANY SNAPSHOT
TABLE 105. RAMBUS INC.: OPERATING SEGMENTS
TABLE 106. RAMBUS INC.: PRODUCT PORTFOLIO
TABLE 107. LATTICE SEMICONDUCTOR CORPORATION: COMPANY SNAPSHOT
TABLE 108. LATTICE SEMICONDUCTOR CORPORATION: OPERATING SEGMENTS
TABLE 109. LATTICE SEMICONDUCTOR CORPORATION: PRODUCT PORTFOLIO
TABLE 110. SONICS, INC: COMPANY SNAPSHOT
TABLE 111. SONICS, INC: PRODUCT CATEGORY

LIST OF FIGURES

FIGURE 01. KEY MARKET SEGMENTS
FIGURE 02. EXECUTIVE SUMMARY
FIGURE 03. EXECUTIVE SUMMARY
FIGURE 04. TOP IMPACTING FACTORS
FIGURE 05. TOP INVESTMENT POCKETS
FIGURE 06. MARKTE SHARE ANALYSIS, 2017
FIGURE 07. GLOBAL SEMICONDUCTOR IP MARKET, BY DESIGN IP, 2017-2024
FIGURE 08. COMPARATIVE SHARE ANALYSIS OF PROCESSOR IP MARKET, BY COUNTRY, 2017 & 2024 (%)
FIGURE 09. COMPARATIVE SHARE ANALYSIS OF INTERFACE IP MARKET, BY COUNTRY, 2017 & 2024 (%)
FIGURE 10. COMPARATIVE SHARE ANALYSIS OF MEMORY IP MARKET, BY COUNTRY, 2017 & 2024 (%)
FIGURE 11. COMPARATIVE SHARE ANALYSIS OF OTHER IP MARKET, BY COUNTRY, 2017 & 2024 (%)
FIGURE 12. GLOBAL SEMICONDUCTOR IP MARKET, BY IP SOURCE, 2017-2024
FIGURE 13. COMPARATIVE SHARE ANALYSIS OF SEMICONDUCTOR IP MARKET FOR LICENSING, BY COUNTRY, 2017 & 2024 (%)
FIGURE 14. COMPARATIVE SHARE ANALYSIS OF SEMICONDUCTOR IP MARKET FOR ROYALTY, BY COUNTRY, 2017 & 2024 (%)
FIGURE 15. COMPARATIVE SHARE ANALYSIS OF SEMICONDUCTOR IP MARKET FOR SERVICING, BY COUNTRY, 2017 & 2024 (%)
FIGURE 16. GLOBAL SEMICONDUCTOR IP MARKET, BY APPLICATION, 2017-2024
FIGURE 17. COMPARATIVE SHARE ANALYSIS OF SEMICONDUCTOR IP MARKET FOR CONSUMER ELECTRONICS, BY COUNTRY, 2017 & 2024 (%)
FIGURE 18. COMPARATIVE SHARE ANALYSIS OF SEMICONDUCTOR IP MARKET FOR TELECOM, BY COUNTRY, 2017 & 2024 (%)
FIGURE 19. COMPARATIVE SHARE ANALYSIS OF SEMICONDUCTOR IP MARKET FOR AUTOMOTIVE BY COUNTRY, 2017 & 2024 (%)
FIGURE 20. COMPARATIVE SHARE ANALYSIS OF SEMICONDUCTOR IP MARKET FOR AEROSPACE, BY COUNTRY, 2017 & 2024 (%)
FIGURE 21. COMPARATIVE SHARE ANALYSIS OF SEMICONDUCTOR IP MARKET FOR HEALTHCARE, BY COUNTRY, 2017 & 2024 (%)
FIGURE 22. COMPARATIVE SHARE ANALYSIS OF SEMICONDUCTOR IP MARKET FOR AGRICULTURE, BY COUNTRY, 2017 & 2024 (%)
FIGURE 23. COMPARATIVE SHARE ANALYSIS OF SEMICONDUCTOR IP MARKET FOR OTHERS BY COUNTRY, 2017 & 2024 (%)
FIGURE 24. COMPARATIVE SHARE ANALYSIS OF SEMICONDUCTOR IP MARKET, BY COUNTRY, 2017 & 2024 (%)
FIGURE 25. U.S. SEMICONDUCTOR IP MARKET, 2017-2024($MILLION)
FIGURE 26. CANADA SEMICONDUCTOR IP MARKET, 2017-2024($MILLION)
FIGURE 27. MEXICO SEMICONDUCTOR IP MARKET, 2017-2024($MILLION)
FIGURE 28. COMPARATIVE SHARE ANALYSIS OF SEMICONDUCTOR IP MARKET, BY COUNTRY, 2017 & 2024 (%)
FIGURE 29. U.K. SEMICONDUCTOR IP MARKET, 2017-2024($MILLION)
FIGURE 30. GERMANY SEMICONDUCTOR IP MARKET, 2017-2024($MILLION)
FIGURE 31. FRANCE SEMICONDUCTOR IP MARKET, 2017-2024($MILLION)
FIGURE 32. SPAIN SEMICONDUCTOR IP MARKET, 2017-2024($MILLION)
FIGURE 33. ITALY SEMICONDUCTOR IP MARKET, 2017-2024($MILLION)
FIGURE 34. REST OF EUROPE SEMICONDUCTOR IP MARKET, 2017-2024($MILLION)
FIGURE 35. COMPARATIVE SHARE ANALYSIS OF SEMICONDUCTOR IP MARKET, BY COUNTRY, 2017 & 2024 (%)
FIGURE 36. CHINA SEMICONDUCTOR IP MARKET, 2017-2024($MILLION)
FIGURE 37. JAPAN SEMICONDUCTOR IP MARKET, 2017-2024($MILLION)
FIGURE 38. INDIA SEMICONDUCTOR IP MARKET, 2017-2024($MILLION)
FIGURE 39. AUSTRALIA SEMICONDUCTOR IP MARKET, 2017-2024($MILLION)
FIGURE 40. SOUTH KOREA SEMICONDUCTOR IP MARKET, 2017-2024($MILLION)
FIGURE 41. REST OF ASIA-PACIFIC SEMICONDUCTOR IP MARKET, 2017-2024($MILLION)
FIGURE 42. COMPARATIVE SHARE ANALYSIS OF SEMICONDUCTOR IP MARKET, BY COUNTRY, 2017 & 2024 (%)
FIGURE 43. LATIN AMERICA SEMICONDUCTOR IP MARKET, 2017-2024($MILLION)
FIGURE 44. MIDDLE EAST SEMICONDUCTOR IP MARKET, 2017-2024($MILLION)
FIGURE 45. AFRICA SEMICONDUCTOR IP MARKET, 2017-2024($MILLION)
FIGURE 46. ABC: REVENUE, 2014-2016 ($MILLION)
FIGURE 47. ABC: REVENUE SHARE BY SEGMENT, 2016 (%)
FIGURE 48. ABC: REVENUE SHARE BY GEOGRAPHY, 2016 (%)
FIGURE 49. SYNOPSYS, INC: REVENUE, 2015-2017 ($MILLION)
FIGURE 50. SYNOPSYS, INC: REVENUE SHARE BY GEOGRAPHY, 2017 (%)
FIGURE 51. IMAGINATION TECHNOLOGIES GROUP PLC: REVENUE, 2015-2017 ($MILLION)
FIGURE 52. IMAGINATION TECHNOLOGIES GROUP PLC: REVENUE SHARE BY SEGMENT, 2017 (%)
FIGURE 53. IMAGINATION TECHNOLOGIES GROUP PLC: REVENUE SHARE BY GEOGRAPHY, 2017 (%)
FIGURE 54. CADENCE DESIGN SYSTEMS, INC: REVENUE, 2015-2017 ($MILLION)
FIGURE 55. CADENCE DESIGN SYSTEMS, INC: REVENUE SHARE BY SEGMENT, 2017 (%)
FIGURE 56. CADENCE DESIGN SYSTEMS, INC: REVENUE SHARE BY GEOGRAPHY, 2016 (%)
FIGURE 57. CEVA, INC: REVENUE, 2015-2017 ($MILLION)
FIGURE 58. CEVA, INC: REVENUE SHARE BY SEGMENT, 2017 (%)
FIGURE 59. EMEMORY TECHNOLOGY INC: REVENUE, 2015-2017 ($MILLION)
FIGURE 60. RAMBUS INC.: REVENUE, 2015-2017 ($MILLION)
FIGURE 61. RAMBUS INC.: REVENUE SHARE BY SEGMENT, 2017 (%)
FIGURE 62. RAMBUS INC.: REVENUE SHARE BY GEOGRAPHY, 2017 (%)
FIGURE 63. LATTICE SEMICONDUCTOR CORPORATION: REVENUE, 2015-2017 ($MILLION)
FIGURE 64. LATTICE SEMICONDUCTOR CORPORATION: REVENUE SHARE BY GEOGRAPHY, 2017 (%)


The global semiconductor IP market holds high potential for the semiconductor industry. The current business scenario witnesses an increase in the demand for IP core, particularly in the developing regions, such as China, India, and others. Countries from Asia-Pacific, mainly Taiwan and Malaysia, are projected to help transform the semiconductor IP market in the region as well as around the world. Companies in this industry adopt various innovative techniques to provide customers with advanced and innovative product offerings.

Rise in demand for the modern system on chip (SoC) design and reduction in production and design cost majorly drive the market. Despite such advantages, fluctuations in the development or functionality of the chips impedes the market growth. In the near future, rise in demand for the consumer electronics and new technological developments are expected to create lucrative opportunities for the key players operating in the semiconductor IP market.

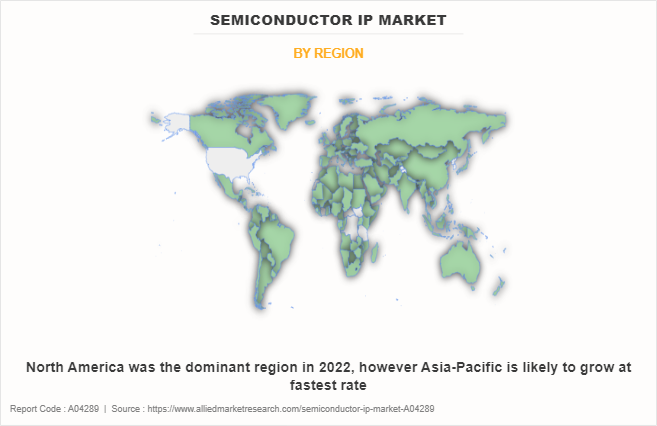
Among the analyzed geographical regions, Asia-Pacific is expected to account for the highest revenue in the global market in 2017 followed by North America, Europe, and LAMEA. However, LAMEA is expected to grow at a higher growth rate, predicting a lucrative market growth for the semiconductor IP market.

ARM, Synopsys, Imagination Technologies, Cadence, Ceva, Verisillicon, eMemory Technology, Rambus, Lattice (Silicon Image), and Sonics are the key market players that occupy a significant revenue share in the semiconductor IP market.

PURCHASE OPTIONS

Call or Email us

U.S.-Canada Toll-free: +1-800-792-5285
Int'l : +1-503-894-6022
Europe : +44-845-528-1300
Email : help@alliedmarketresearch.com

Looking for Customization?

 Customization Request

Have a Question?

 Speak with Analyst

Any Confusion?

 Inquire Before Buying

Have a glance of the Report

  Request Sample
RELATED TAGS

Purchase Full Report of
Semiconductor Ip Market

Start reading instantly.
This Report and over 68,247+ more Reports, Available with Avenue Library. T&C*.

  • Online Only
  • $3,456
  • Online cloud access only
  • Restricted print, copy, paste & download
  • Read only
  • Free industry update
    (Within 180 days)
  • Free report update in next update cycle
    (May 2019 - May 2020)
  • Data Pack
  • $3,840
  • Restricted to one authorized user
  • One print only
  • Available in
    Excel
  • Free industry update
    (Within 180 days)
  •   Free report update in next update cycle
    (May 2019 - May 2020)
  • Single User
  • $5,769
  • Restricted to one authorized user
  • One print only
  • Available in
    PDF
  • Free industry update
    (Within 180 days)
  •   Free report update in next update cycle
    (May 2019 - May 2020)
  • Five Users
  • $6,450
  • Limited to five authorized users
  • Print upto five copies
  • Available in
    PDF
  • Free industry update
    (Within 180 days)
  •   Free report update in next update cycle
    (May 2019 - May 2020)
  • Enterprise
    License/PDF

  • $10,995
  • Unlimited
    within
    company/enterprise
  • Available in Excel & PDF
  • Free industry update
    (Within 180 days)
  •   Free report update in next update cycle
    (May 2019 - May 2020)
  • Library
    Membership

  • $999 $ 1,175
    Per User/ Per month/ Billed annually
  • Published Content
    E-access
  • Company Profiles
    E-access
  • Newly Added Content Access
  • 10 PDF
    Downloads
  • 5 Excel Data
    Pack Downloads
  • 250 Company Profiles PDF Downloads
  • Buy Now

*Taxes/Fees, if applicable will be added during checkout. All prices in USD

RELATED REPORTS
 

Why Allied Market Research?


Infallible Methodology

To ensure high-level data integrity, accurate analysis, and impeccable forecasts

Analyst Support

For complete satisfaction

Customization

On-demand customization of scope of the report to exactly meet your needs

TARGETED MARKET VIEW

Targeted market view to provide pertinent information and save time of readers

Get fresh content delivered

Get insights on topics that are crucial for your business. Stay abreast of your interest areas.

Get Industry Data Alerts

Why Allied Market Research?

Infallible Methodology

To ensure high-level data integrity, accurate analysis, and impeccable forecasts

Analyst Support

For complete satisfaction

Customization

On-demand customization of scope of the report to exactly meet your needs

TARGETED MARKET VIEW

Targeted market view to provide pertinent information and save time of readers