
Shampoo Market Overview
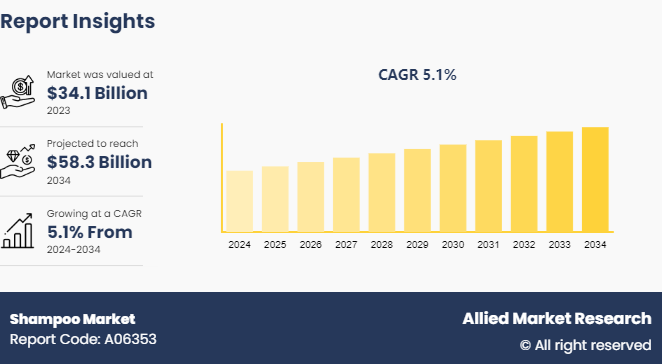
The global shampoo market size was valued at $34.1 billion in 2023, and is projected to reach $58.3 billion by 2034, growing at a CAGR of 5.1% from 2024 to 2034. Shampoo is a hair care product designed to cleanse the scalp and hair by removing dirt, oil, and other impurities. It consists of a blend of surfactants, which are cleansing agents, along with conditioning agents, fragrances, and preservatives. The formulation of shampoo varies to cater to different hair types and concerns, such as dandruff, dryness, or oiliness.
Market Size & Forecast
- 2023 Market Size: USD 34.1 Billion
- 2034 Projected Market Size: USD 58.3 Billion
- Compound Annual Growth Rate (CAGR) (2024–2034): 5.1%
What Is Shampoo ?
Shampoo refers to a hair care product. It helps remove dirt, oil, and dead skin cells from the scalp and hair strands. It is an important part of daily personal care routine for many individuals. It is composed of surfactants, conditioners, thickeners, and preservatives. It also contains specialty ingredients tailored for specific hair concerns.
When shampoo is applied with water, the surfactants surround oil and debris on hair and scalp that can be rinsed away. This cleansing action helps maintain scalp health. The daily cleansing shampoo is one of the majorly preferred shampoo types by individuals. It provides cleansing and gentle conditioning. This helps prevent dryness or tangling. Individuals with oily scalps, prefer shampoos with cleansing properties. Consumers with specific scalp concerns often choose specialty shampoos. These types target dandruff, itchiness, or hair thinning.
Also, there is a shift in trend for products free from sulfates and parabens. This trends makes way for sulfate‑free shampoos that cleanse gently while preserving the natural oils of the hair. Shampoo bars also appeal to eco‑conscious con
Shampoos can also include additional ingredients such as vitamins, botanical extracts, and proteins to nourish and strengthen the hair. The product is usually applied to wet hair, massaged into the scalp to create a lather, and then rinsed out. Innovations in the shampoo market have led to the development of sulfate-free, organic, and customized options to meet diverse consumer preferences and needs.
Key Takeaways
The shampoo market study covers 20 countries. The research includes a segment analysis of each country in terms of value ($Billion) for the projected period 2024-2034.
More than 1, 500 product literatures, industry releases, annual reports, and other such documents of shampoo industry participants along with authentic industry journals, trade associations' releases, and government websites have been reviewed for generating high-value industry insights.
The study integrated high-quality data, professional opinions and analysis, and critical independent perspectives. The research approach is intended to provide a balanced view of global markets and to assist stakeholders in making educated decisions to achieve their most ambitious growth objectives.
Key Market Dynamics
Drivers
Increase in consumer awareness of personal grooming and hygiene is the major factor that fosters the growth of the shampoo market. Rise in urbanization and changes in cultural attitudes toward beauty and grooming further fuel the demand for shampoo products. Innovations in product formulations also drive the market growth.
Restraints
Raw material price volatility is a major concern for shampoo manufacturers. Price instability can lead to higher retail prices, which may lessen demand in price?sensitive markets. Negative experiences or perceived lack of effectiveness can reduce repeat purchases. These factor deters the growth of the shampoo market.
Opportunities
Sustainable packaging is a major factor expected to be opportunistic for the growth of the shampoo market. Personalization is another significant opportunity in the market. Brands such as Prose, Function of Beauty, and HairRx, have responded to this demand by offering customizable shampoos that allow consumers to select ingredients, fragrances, and packaging based on their unique needs. Thus, such personalized approach not only enhances consumer satisfaction but also promotes brand loyalty. As a result, companies that provide tailored products are gaining a competitive edge, encouraging innovation and diversification in the shampoo market. Further, advancements in technologies helps enhance customer experience and retention offer lucrative opportunities in the market.
PESTLE Analysis of Global Shampoo Market
Political: Regulatory policies concerning cosmetic ingredients and safety standards significantly influence the shampoo market. Government regulations on labeling and advertising impact product marketing and distribution strategies.
Economic: Economic factors such as consumer spending power and economic stability affect demand for shampoos. Economic downturns can lead to reduced spending on non-essential products, while growth periods may increase demand for premium brands.
Social: Increase in consumer awareness regarding health, wellness, and environmental sustainability drives demand for natural and organic shampoos. Social media and influencer marketing have a strong impact on consumer preferences and brand loyalty.
Technological: Technological advancements in product formulation and packaging innovations are crucial in the shampoo market. Research and development lead to the creation of new products that cater to specific hair concerns and consumer needs.
Legal: Compliance with international and local laws regarding product safety, advertising, and environmental impact is mandatory. Intellectual property rights and patents also play a role in maintaining competitive advantage.
Environmental: Growing awareness of environmental issues influences consumer preferences toward eco-friendly and sustainable products. Companies are adopting greener manufacturing processes and biodegradable packaging to meet consumer expectations.
Market Segmentation
The shampoo market segmentation is done on the basis of product type, price-point, end user, distribution channel, and region. On the basis of product type, the market is categorized into medicated and non-medicated. Based on price-point, the market is divided into low, medium, and high. As per end user, the market is classified into men, women, and kids. According to distribution channel, it is fragmented into supermarkets/hypermarkets, drug stores or pharmacy, mass merchandiser, departmental stores, mono-brand stores, specialty stores, and online sales channel. Region wise, the shampoo market is analyzed across North America, Europe, Asia-Pacific, and LAMEA.
Why is demand increasing in the shampoo market?
Increase in consumer awareness of personal hygiene and hair health surges the demand for shampoo. There is a rise in awareness about importance of routine hair cleansing. This surge in awareness increases the demand for shampoo among the individuals. The focus on prevention of dandruff, dryness, and hair damage has driven consumers to seek shampoos that offer targeted benefits beyond basic cleansing. Innovations in products also play an important role in fostering the growth of the market. Manufacturers are introducing new formulations to address specific hair concerns.
Further, rise in online retail channels boost the demand to improve accessibility. E?commerce platforms help consumers to explore products, read reviews, and compare brands. This encourages trial and repeat purchases.
Regional/Country Market Outlook
The growth of the shampoo market in the Asia-Pacific region is driven by factors such as increased consumer awareness about hair health, leading to higher demand for specialized shampoos addressing specific concerns such as dandruff and hair loss. Innovations in product formulations, including herbal and natural ingredients, attracted health-conscious consumers in the region. The influence of Korean and Japanese beauty trends, emphasizing unique hair care routines, also boosted interest in diverse shampoo offerings.
Furthermore, effective marketing strategies and brand collaborations with local influencers strengthened brand visibility and consumer trust. The rise of online shopping platforms expanded access to a wide range of products, which has made it easier for consumers to explore and purchase different shampoos tailored to their needs. And the following trend is expected to create numerous opportunites for shampoo manufacturers during the shampoo market forecast period.
The shampoo industry in Europe has experienced strong growth potential owing to rise in consumer interest in sustainable and eco-friendly products. Demand for shampoos with natural and organic ingredients reflected a shift toward health-conscious purchasing decisions. The aging population contributed to a rise in demand for products targeting hair thinning and scalp health.
Moreover, innovation in personalized hair care solutions, leveraging data and technology to offer tailored products, appealed to diverse consumer needs. Expansion of online retail channels facilitated easier access to niche and premium products, enhancing market reach. Furthermore, the growing awareness and emphasis on personal grooming and hygiene further supported the expansion of industry, as consumers sought high-quality and effective hair care solutions.
Industry Trends
The clean beauty trend significantly influenced the shampoo market by driving demand for transparency and ethical sourcing. Consumers increasingly sought products with clear, understandable ingredient lists, leading brands to reformulate shampoos to eliminate harmful chemicals such as sulfates, parabens, and synthetic fragrances. The shift resulted in the rise of shampoos that emphasize natural and organic ingredients, catering to health-conscious buyers.
In addition, cruelty-free and vegan certifications became crucial, as consumers prioritized animal welfare. Brands adapted by using sustainable packaging materials and adopting environmentally friendly practices. The clean beauty movement encouraged innovation in the shampoo market, pushing companies to create effective yet gentle products, ultimately reshaping consumer expectations and industry standards toward more conscious and responsible production.
The trend toward multi-functional products has set a trend in the shampoo market by meeting consumer demands for convenience and efficiency. Manufacturers developed shampoos that offered multiple benefits, such as combining cleansing with conditioning, color protection, or anti-dandruff properties. The innovation attracted busy consumers seeking to streamline their hair care routines without compromising on performance. The appeal of timesaving and space-efficient products boosted sales and brand loyalty, driving competition among brands to deliver more comprehensive solutions.
In addition, the trend encouraged innovation in formulation technologies, leading to advanced products that effectively address diverse hair concerns. The growing popularity of multi-functional shampoos also impacted packaging designs, with brands emphasizing the versatility and unique benefits of their products on labels.
How are consumer preferences shaping market trends?
There is a shift toward natural and organic formulations among the individuals. Many consumers are now actively choosing shampoos that are free from sulfates, parabens, and synthetic fragrances due to concerns about scalp irritation and long?term health effects. This demand for cleaner ingredient profiles has prompted brands to expand their portfolios with plant?based, gentle, and eco?friendly shampoos. Products featuring herbal extracts, botanical oils, and organic certifications appeal to health? and environment?conscious buyers, particularly in developed markets.
Another strong preference shaping the market is the desire for specialized and multi?functional shampoos. Consumers increasingly seek products that address specific hair concerns such as dandruff control, hair fall prevention, scalp nourishment, and color protection. As a result, shampoos with targeted benefits have grown in popularity, encouraging manufacturers to innovate and differentiate offerings.
The rise of premiumization is also a significant trend. With rising disposable incomes, especially in emerging economies, many consumers are willing to pay more for salon?quality or high?performance shampoos. Premium shampoos often incorporate advanced ingredients, luxurious fragrances, and improved sensory experiences, appealing to consumers who view hair care as part of a broader self?care routine.
E?commerce and digital influence strongly shape consumer behavior. Online platforms allow consumers to research products, read reviews, and compare formulations before purchasing. Digital channels also facilitate exposure to new brands and niche products, including subscription services and direct?to?consumer lines, which are gaining popularity among younger shoppers.
Competitive Landscape
The major players operating in the shampoo market include Estee Lauder Companies, Henkel AG &Co. KGaA, Hindustan Unilever Limited, Johnson & Johnson, Kao Group, L’Oreal S.A., Marico Limited, Natura & Co., Oriflame Holding AG and Procter & Gamble (P&G).
Other players in the shampoo market include Reckitt Benckiser Group plc, Coty Inc., Unilever PLC, Shiseido Company, Limited, Amorepacific Corporation, Luxottica Group S.p.A., Avon Products, Inc., PZ Cussons plc, Mary Kay Inc., Belcorp, and so on.
What are the strategies adopted by the key players in the market?
In the global shampoo market, leading companies adopt a range of strategic initiatives to strengthen their positions, expand market reach, and meet evolving consumer demands. One of the most prominent strategies is product innovation and diversification. Brands are investing heavily in new formulations to address specific hair care needs, such as anti?dandruff, hair fall control, sulfate?free, and natural ingredient shampoos. For example, in 2024, Henkel launched a sulfate?free shampoo tailored for gentle care in the premium segment, responding to consumer demand for mild and clean beauty products. In 2023, L’Oréal introduced an anti?dandruff variant to address lifestyle?linked hair concerns. P&G also expanded its portfolio with herbal shampoos featuring natural ingredients to attract environmentally conscious consumers. These launches help companies remain relevant amid rising preference for health?focused and functional products. Geographical expansion and distribution enhancement are other key strategic pillars.
Many global players are strengthening their presence in high?growth regions such as Asia?Pacific, where rising disposable incomes and urbanization drive demand for personal care products. Expanded retail networks and partnerships with local distributors enhance product visibility and accessibility. E?commerce channels form a vital part of this strategy, enabling brands to reach a broader audience and capitalize on online trends in personalized hair care choices.
Sustainability and ethical positioning have also become strategic priorities. Companies are reformulating products to eliminate controversial preservatives and adopting environmentally responsible practices such as vegan and cruelty?free certifications. These moves resonate with modern consumers who prioritize ethical and eco?friendly products. This trend is aligned with broader clean beauty movements, prompting brands to communicate transparency in ingredient sourcing. Collaborations and partnerships are frequently used to enhance brand appeal. Some players work with digital content creators, influencers, or professional salon networks to build credibility and boost product adoption. Although not always detailed in traditional market reports, such marketing partnerships are critical in engaging younger demographics and enhancing brand perception.
Recent Key Strategies and Developments
In February 2024, Henkel launched a sulfate-free shampoo to cater to the demand for gentler hair care products to tap into the premium segment of the shampoo market.
In April 2023, L'Oréal introduced a new anti-dandruff shampoo to address increasing hair loss issues linked to lifestyle changes and environmental factors.
In January 2023, Procter & Gamble expanded its product line with a new herbal shampoo, focusing on natural ingredients to appeal to environmentally conscious consumers.
In May 2022, Medimix, a brand under the AVA group, launched its total care shampoo, infused with natural ingredients aimed at catering to all hair types.
Key Benefits For Stakeholders
This report provides a quantitative analysis of the market segments, current trends, estimations, and dynamics of the shampoo market analysis from 2024 to 2034 to identify the prevailing shampoo market opportunities.
The market research is offered along with information related to key drivers, restraints, and opportunities.
Porter's five forces analysis highlights the potency of buyers and suppliers to enable stakeholders make profit-oriented business decisions and strengthen their supplier-buyer network.
In-depth analysis of the shampoo market segmentation assists to determine the prevailing market opportunities.
Major countries in each region are mapped according to their revenue contribution to the global market.
Market player positioning facilitates benchmarking and provides a clear understanding of the present position of the market players.
The report includes the analysis of the regional as well as global shampoo market trends, key players, market segments, application areas, and market growth strategies.
Shampoo Market Report Highlights
| Aspects | Details |
| Market Size By 2034 | USD 58.3 Billion |
| Growth Rate | CAGR of 5.1% |
| Forecast period | 2024 - 2034 |
| Report Pages | 290 |
| By Product Type |
|
| By Price Point |
|
| By End User |
|
| By Distribution Channel |
|
| By Region |
|
| Key Market Players | Kao Group, L’Oreal S.A., Marico Limited., Johnson & Johnson, Natura & Co., Oriflame Holding AG, Estee Lauder Companies Inc., Hindustan Unilever Limited, Procter & Gamble, Henkel AG &Co. KGaA |
The global shampoo market size was valued at $34.1 billion in 2023 and is projected to reach $58.3 billion by 2034.
The global shampoo market to grow at a CAGR of 5.1% from 2024 to 2034.
The major players operating in the shampoo market include Estee Lauder Companies, Henkel AG &Co. KGaA, Hindustan Unilever Limited, Johnson & Johnson, Kao Group, L’Oreal S.A., Marico Limited, Natura & Co., Oriflame Holding AG and Procter & Gamble (P&G).
By region, Asia-Pacific held the highest market share in terms of revenue in 2023.
The growth in demand for natural and organic products has significantly surged the shampoo market growth.
Loading Table Of Content...

