
Silane And Silicone Market Research, 2033
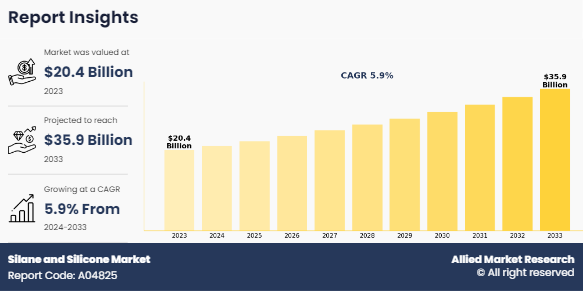
The global silane and silicone market size was valued at $20.4 billion in 2023, and is projected to reach $35.9 billion by 2033, growing at a CAGR of 5.9% from 2024 to 2033.
Introduction
Silane is a chemical compound consisting of one silicon atom bonded to four hydrogen atoms (SiHâ‚„). It serves as a fundamental in silicon chemistry and is often used as a precursor in the production of silicones, as well as in surface treatments, adhesives, and coatings to enhance adhesion and provide water-repellent properties. Silicone, on the other hand, refers to a family of polymers that contain repeating units of silicon-oxygen chains (Si-O-Si) with organic groups attached to the silicon atoms. Silicones are known for their flexibility, thermal stability, and water-resistant properties, widely increasing their use in applications such as sealants, adhesives, lubricants, and medical devices. While silanes act as chemical intermediates, silicones are more complex materials with a broad range of industrial and consumer applications.
Key Takeaways
- The global silane and silicone market is highly fragmented, with several players including Elkem ASA, BASF SE, Kaneka Corporation, Shin-Etsu Chemical Co., Ltd., Wacker Chemie AG, DuPont, Milliken & Company, CHT Germany GmbH, Dow, LANXESS, KCC SILICONE CORPORATION, Momentive Performance Materials, GuangZhou Silok Polymer Co., Ltd., Gelest, Inc., and Evonik Industries AG.
- More than 4,765 product literatures, industry releases, annual reports, and other such documents of major industry participants along with authentic industry journals, trade associations' releases, and government websites have been reviewed for generating high-value industry insights.
- The study integrated high-quality data, expert opinions and analysis, and crucial independent perspectives. This research approach aims to provide a balanced view of global markets and silane and silicone market overview, assisting stakeholders in making informed decisions to achieve their most ambitious growth objectives.
- Silane and silicone market news and key industry trends are also included in the report.
Market Dynamics
The market for silane and silicone is driven by several factors, alongside key restraints and opportunities. A major driver is the growing demand from industries such as automotive, construction, electronics, and healthcare. Silanes are valued for their ability to improve adhesion and durability in coatings, sealants, and adhesives, making them essential in construction and automotive applications. Similarly, the versatility of silicone, with properties such as thermal stability, flexibility, and biocompatibility, drives its demand in applications ranging from medical devices to electronics and automotive components. The shift towards sustainable and energy-efficient materials further boosts the demand for silane and silicone products, particularly in renewable energy applications such as solar panels.
However, the market faces restraints, including the high cost of raw materials and production, which can limit the adoption of silane and silicone, especially in cost-sensitive sectors. Environmental regulations related to the production and disposal of these chemicals also pose challenges, requiring manufacturers to comply with stringent safety standards. Despite these challenges, significant opportunities exist in the development of advanced formulations and eco-friendly variants of silane and silicone. Innovations in recycling processes and sustainable production methods offer potential for growth, as industries increasingly prioritize environmentally responsible solutions. In addition, expanding applications in emerging markets, particularly in Asia-Pacific, present further growth prospects, driven by urbanization and industrialization trends. These dynamics collectively shape the market's evolution, balancing challenges with new areas of opportunity.
Segments Overview
The silane and silicone market is segmented into type, end-use, and region. Based on type, the market is categorized into silicones and silanes. By end-use, the silane and silicone market is classified into building and construction, transportation, electronics, medical, textiles and leather, and others. Region wise, the market is analyzed across North America, Europe, Asia-Pacific, and LAMEA.

silane and Silicone Market, by Region
The Asia-Pacific region is expected to dominate the market during the analysis period. The silane and silicone market in the Asia-Pacific region is expected to witness significant growth, driven by a combination of economic, industrial, and demographic factors. The aging population in certain parts of Asia-Pacific is creating opportunities for silicones in medical devices and implants, where their biocompatibility and flexibility are highly valued. This trend is particularly noticeable in Japan and South Korea, where the demand for advanced healthcare solutions is rising.
In addition, the high consumption of cosmetic products in Southeast Asian countries such as China, Japan, Thailand, and Malaysia, is driving the demand for silicones in personal care products. Silicones are widely used in skincare, haircare, and cosmetic formulations for their ability to enhance product feel, smoothness, and moisture retention. Overall, the combination of industrial growth, increase in consumer spending, and demographic shifts is fueling the demand for silane and silicone products across various sectors in the Asia-Pacific region, making it one of the most promising markets globally.

silane and Silicone Market, by Type
In 2023, the silicones segment of the silane and silicone market generated the highest revenue share. Silicones are versatile materials used across various industries due to their unique properties such as waterproofing, flexibility, and thermal stability. In the construction industry, they serve as sealants, adhesives, and coatings, providing weather resistance and waterproofing for sealing joints in buildings, windows, and facades, as well as offering protective coatings that improve the durability of construction Chemecal materials.
The automotive sector relies on silicones for gaskets, hoses, and seals due to their ability to endure extreme temperatures and resist chemical exposure. They are also applied in coatings for electrical insulation and protection of automotive parts, contributing to the longevity and performance of vehicles. In electronics, silicones play a critical role in potting and encapsulation of components, providing insulation and protection against moisture and dust. Their thermal stability makes them suitable for heat management in electronic devices such as thermal pads and adhesive compounds for heat sinks.

silane and Silicone Market, by Enduse-Graph
Building and Construction segment is expected to dominate the market during the forecast period. In the building and construction industry, silanes are extensively used as adhesion promoters in mineral wool and fiberglass, which are popular insulation materials. These applications provide enhanced properties such as heat and sound insulation, corrosion resistance, high elasticity, and low weight, contributing to superior performance in the final product. In addition, silanes play a crucial role in the production of fillers, pigments, adhesives, and sealants, as well as in paints and coatings, all of which are integral to various construction applications.
Silicones are valued for their effectiveness in waterproofing and structural glazing. They also help improve in-shop productivity and minimize material waste, leading to extended structure lifespan and lower life cycle costs. One of the most significant uses of silicones is in bonding different materials, a characteristic that has driven their demand in construction material preparation and other related applications. These unique capabilities make silanes and silicones essential components in the construction sector.
Competitive Analysis
The key players operating in the silane and silicone industry are Elkem ASA, BASF SE, Kaneka Corporation, Shin-Etsu Chemical Co., Ltd., Wacker Chemie AG, DuPont, Milliken & Company, CHT Germany GmbH, Dow, LANXESS, KCC SILICONE CORPORATION, Momentive Performance Materials, GuangZhou Silok Polymer Co., Ltd., Gelest, Inc., and Evonik Industries AG.
Key Benefits For Stakeholders
- This report provides a quantitative analysis of the market segments, current trends, estimations, and dynamics of the silane and silicone market analysis from 2023 to 2033 to identify the prevailing silane and silicone market opportunities.
- The market research is offered along with information related to key drivers, restraints, and opportunities.
- Porter's five forces analysis highlights the potency of buyers and suppliers to enable stakeholders make profit-oriented business decisions and strengthen their supplier-buyer network.
- In-depth analysis of the silane and silicone market segmentation assists to determine the prevailing market opportunities.
- Major countries in each region are mapped according to their revenue contribution to the global market.
- Market player positioning facilitates benchmarking and provides a clear understanding of the present position of the market players.
- The report includes the analysis of the regional as well as global silane and silicone market trends, key players, market segments, application areas, and market growth strategies.
Silane and Silicone Market Report Highlights
| Aspects | Details |
| Market Size By 2033 | USD 35.9 billion |
| Growth Rate | CAGR of 5.9% |
| Forecast period | 2023 - 2033 |
| Report Pages | 660 |
| By Type |
|
| By End-use |
|
| By Region |
|
| Key Market Players | Momentive Performance Materials, CHT Germany GmbH, KCC SILICONE CORPORATION., Wacker Chemie AG., Evonik Industries AG, LANXESS, BASF SE, Shin-Etsu Chemical Co., Ltd., DuPont, Kaneka Corporation., Gelest, Inc., Dow, Milliken & Company, Elkem ASA, GuangZhou Silok Polymer Co.,Ltd. |
Analyst Review
According to the opinions of various CXOs of leading companies, the silane and silicone market is expected to witness an increase in demand during the forecast period. The silane and silicone market is significantly driven by increase in demand from various industries, particularly automotive, construction, and electronics. In automotive and construction applications, silanes are essential for enhancing adhesion and durability in coatings, sealants, and adhesives, while silicones are valued for their thermal stability and flexibility, making them ideal for a wide range of uses, including automotive parts and building materials. The expanding electronics sector further fuels market growth, as silanes are used in surface treatments that improve the performance and reliability of electronic components.
In addition, the growing emphasis on sustainability and energy efficiency is creating opportunities for both silane and silicone products, particularly in renewable energy applications such as solar panels, where silicones are used for encapsulation and protection. Innovations in product formulations, including the development of eco-friendly silane and silicone variants, present further opportunities, allowing manufacturers to meet the rising consumer demand for environmentally responsible solutions.
The increasing demand from the automotive and construction sectors is a significant driver, as silanes enhance adhesion and durability in coatings, sealants, and adhesives, which are essential for vehicle manufacturing and building materials.
Building and Construction is the leading application of Silane and Silicone Market.
Asia-Pacific is the largest regional market for Silane and Silicone.
The silane and silicone market was valued at $20.4 billion in 2023, and is estimated to reach $35.9 billion by 2033, growing at a CAGR of 5.9% from 2024 to 2033.
The key players operating in the silane and silicone market are Elkem ASA, BASF SE, Kaneka Corporation, Shin-Etsu Chemical Co., Ltd., Wacker Chemie AG, DuPont, Milliken & Company, CHT Germany GmbH, Dow, LANXESS, KCC SILICONE CORPORATION, Momentive Performance Materials, GuangZhou Silok Polymer Co., Ltd., Gelest, Inc., and Evonik Industries AG.
Loading Table Of Content...
Loading Research Methodology...

