0
2018
Skimmed Milk Market

Skimmed Milk Market

by Application (Bakery, Confectionery, Dairy, Prepared Mix, and Others) and Distribution Channel (Supermarket, Hypermarket, Convenience Store, Online Store, and Wholesaler) - Global Opportunity Analysis and Industry Forecast, 2018-2024

Report Code: A04277
May 2018 | Pages: 215
Tables: 111
Charts: 54
  • Formats*:

  • pdf

    Single User License, Five User
    License & Enterprise User License

  • xls

    Data Pack Excel License

  • ppt

    It comes with the additional cost
    of $2500.00 contact sales.


COVID-19

Pandemic disrupted the entire world and affected many industries.

Get detailed COVID-19 impact analysis on the Skimmed Milk Market

Request Now !

Global Skimmed Milk Market Overview:

The global skimmed milk market was valued at $9,894 million in 2017 and is projected to reach $16,498 million by 2024, registering a CAGR of 7.3% from 2018 to 2024. Skim milk is also called as non-fat milk or fat-free milk, it is obtained after skimming, which involves removing cream from the milk. It contains 00.5% of fat contents. Skim milk is loaded with protein, calcium, phosphorous, vitamin D and vitamin A, making it a source of high-quality complete protein. It helps to build strong bones, teeth, and muscles, and also aids in healthy weight management. Moreover, it contains same nutrients in same relative proportions as the fresh milk, hence it is used in many food items such as bakery and confectionery foods and desserts to add nutritive value. Factors such as growth in awareness about health benefits associated with skimmed milk and its wide applications in food industry, further fuels the market.


The skimmed milk market is segmented based on application, distribution channel, and region. Based on application, the skimmed milk market is classified into bakery, confectionery, dairy, prepared mix, and others. While the distribution channel segment comprises of supermarket, hypermarket, convenience store, online store, and wholesaler. Based on region, it is analyzed across North America, Europe, Asia-Pacific, and LAMEA.

Some of the major players analyzed in this report are Alpen Dairies, Amul, Arla Foods, Dairy Farmers of America Inc., Danone S.A., Fonterra Co-operative Group Limited, LACTALIS Ingredients, Nestle S.A, Saputo Inc., and Schreiber Foods Inc.

by geography

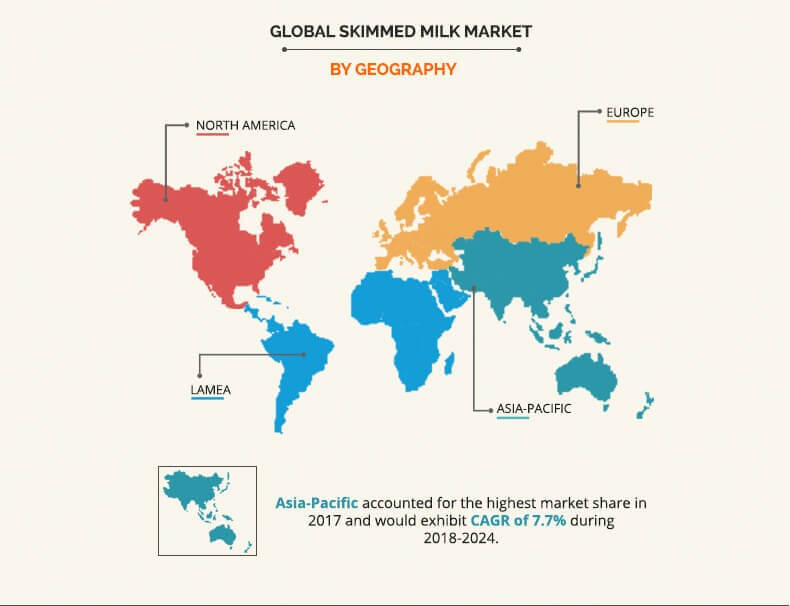
In 2017, Asia-Pacific accounted for the largest market share in the global skimmed milk market and is anticipated to maintain its dominance during the forecast period. The key driving factors of the market include changes in consumer food patterns and growth in food industry particularly in India and China. Moreover, growth in population, increase in disposable income, and changes in lifestyles have raised demand for healthy and improved dairy, confectionery, bakery, and other food products supplementing the growth of the market in this region. Moreover, an increased focus on innovations and expansion of food industries will further boost the skimmed milk market in APAC.

by application

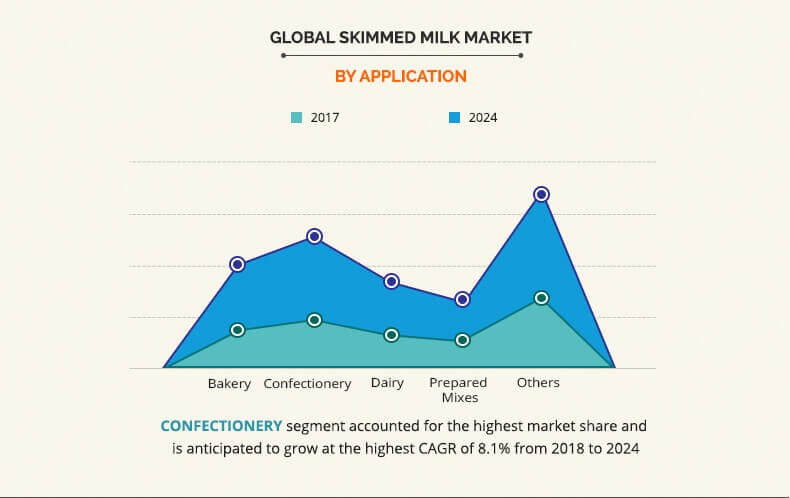
In 2017, the confectionery accounted for the largest market share and is anticipated to grow at the highest CAGR of 8.1% from 2018 to 2024. Skim milk is used to stabilize foam structure of confectionary products. It lends a desirable light dairy flavor and binds water to produce the firm, chewy texture of confectionary products. Addition of skim milk also allows the confectionaries to withstand high temperatures and enrobing process conditions. Owing to its distinct flavor and smooth milky texture characteristics skim milk is used to produce milk chocolate and it is also used in soft sweets, caramel confections, and various confection coatings frequently.

by distribution channel

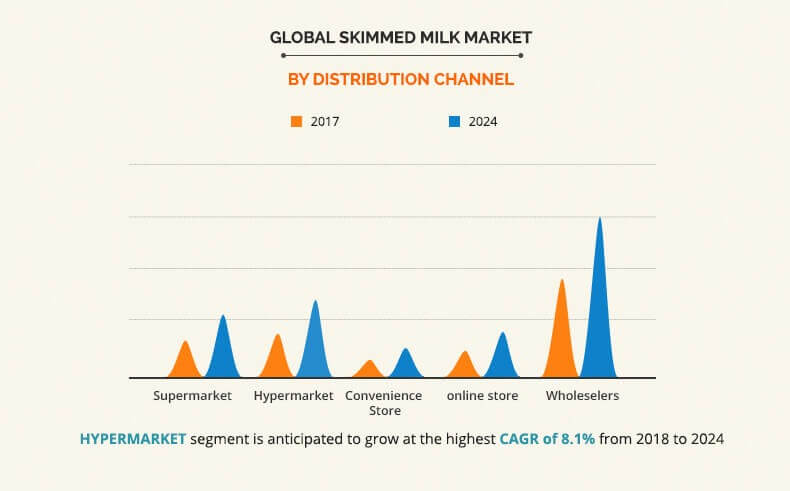
The distribution channel of skimmed milk market comprises of supermarket, hypermarket, convenience store, online, and wholesalers. Wholesaler accounted for the largest distribution channel segment in the global skimmed milk market. Large and small scale manufacturers operating in sectors such as dairy, prepared foods, bakery, and confectionery preferred to buy milk from wholesalers as they are able to supply milk at a discounted rate and also ensure quick delivery.

Change in lifestyle and increase in affluence in various emerging economies such as India & China have led to high number of hypermarkets. High visibility of skimmed milk in the hypermarket is expected to boost the sales of the market. Moreover, pleasant shopping experience, organized assortment, clean environment, and friendly service these are factors that attract customer to shop at hypermarkets, which further propels the market growth.

Key Benefits

  • This report provides a quantitative analysis of the current trends, estimations, and dynamics of the global skimmed milk market for the period of 20172024 to identify the prevailing market opportunities.
  • The key countries in all the majors regions have been mapped based on their market share.
  • Porters Five Forces analysis highlights the potency of buyers and suppliers to enable stakeholders to make profit-oriented business decisions and strengthen their supplierbuyer network.
  • In-depth analysis of the market segmentation assists in determining the prevailing market opportunities.
  • Major countries in each region have been mapped according to their revenue contribution to the global industry. Market player positioning segment facilitates benchmarking and provides a clear understanding of the present position of market players.
  • The report includes the analysis of the regional as well as global market, key players, market segments, and application areas, and growth strategies.

Skimmed Milk Market Report Highlights

Aspects Details
By Application
  • Bakery
  • Confectionery
  • Dairy
  • Prepared Mix
  • Others (Nutritional Food, Ice-cream, Infant Formula, Soup, and Sauce)
By Distribution Channel
  • Supermarket
  • Hypermarket
  • Convenience Store
  • Online Store
  • Wholesaler
By Region
  • North America  (U.S., Canada, Mexico)
  • Europe  (UK, Germany, France, Italy, Spain, Russia, Rest of Europe)
  • Asia-Pacific  (China, Japan, India, South Korea, Australia, Rest of Asia-Pacific)
  • LAMEA  (Brazil, Argentina, Saudi Arabia, South Africa, Rest of LAMEA)
Key Market Players Arla Foods, Danone S.A., Amul, LACTALIS Ingredients, Dairy Farmers of America Inc., Alpen Dairies, Schreiber Foods Inc., Saputo Inc., Nestle S.A., Fonterra Co-operative Group Limited
 

CHAPTER 1: INTRODUCTION

1.1. Report description
1.2. Key benefits for stakeholders
1.3. Key market segments
1.4. Research methodology

1.4.1. Primary research
1.4.2. Secondary research
1.4.3. Analyst tools and models

CHAPTER 2: EXECUTIVE SUMMARY

2.1. Key finding of the study
2.2. CXO perspective

CHAPTER 3: MARKET OVERVIEW

3.1. Market definition and scope
3.2. Key findings

3.2.1. Top investment pocket
3.2.2. Top winning strategies
3.2.3. Top winning strategies, by year, 2015-2017
3.2.4. Top winning strategies, by development, 2015-2017 (%)
3.2.5. Top winning strategies, by company, 2015-2017

3.3. Porter's five forces analysis

3.3.1. Bargaining power of suppliers
3.3.2. Bargaining power of buyer
3.3.3. Thereat of new entrants
3.3.4. Threat of substitute
3.3.5. Intensity of competitive rivalry

3.4. Market dynamics

3.4.1. Drivers

3.4.1.1. Nutritional benefits of skim milk
3.4.1.2. Wide applications of skim milk in food industry

3.4.2. Restraints

3.4.2.1. Adverse effects of skim milk on human health
3.4.2.2. Increase in use of dairy alternative based products
3.4.2.3. High price of skim milk

3.4.3. Opportunities

3.4.3.1. Increasing use skimmed milk for production of casein and caseinates

3.5. Top player positioning

CHAPTER 4: SKIMMED MILK MARKET, BY APPLICATION

4.1. Overview

4.1.1. Market size and forecast

4.2. Bakery

4.2.1. Key market trends, growth factors, and opportunities
4.2.2. Market size and forecast
4.2.3. Market analysis by country

4.3. Confectionaries

4.3.1. Key market trends, growth factors, and opportunities
4.3.2. Market size and forecast
4.3.3. Market analysis by country

4.4. Dairy

4.4.1. Key market trends, growth factors, and opportunities
4.4.2. Market size and forecast
4.4.3. Market analysis by country

4.5. Prepared Mixes

4.5.1. Key market trends, growth factors, and opportunities
4.5.2. Market size and forecast
4.5.3. Market analysis by country

4.6. Others

4.6.1. Key market trends, growth factors, and opportunities
4.6.2. Market size and forecast
4.6.3. Market analysis by country

CHAPTER 5: SKIMMED MILK MARKET, BY DISTRIBUTION CHANNEL

5.1. Overview

5.1.1. Market size and forecast

5.2. Supermarket

5.2.1. Key market trends, growth factors, and opportunities
5.2.2. Market size and forecast
5.2.3. Market analysis by country

5.3. Hypermarket

5.3.1. Key market trends, growth factors, and opportunities
5.3.2. Market size and forecast
5.3.3. Market analysis by country

5.4. Convenience Stores

5.4.1. Key market trends, growth factors, and opportunities
5.4.2. Market size and forecast
5.4.3. Market analysis by country

5.5. Online Store

5.5.1. Key market trends, growth factors, and opportunities
5.5.2. Market size and forecast
5.5.3. Market analysis by country

5.6. Wholesalers

5.6.1. Key market trends, growth factors, and opportunities
5.6.2. Market size and forecast
5.6.3. Market analysis by country

CHAPTER 6: SKIMMED MILK MARKET, BY REGION

6.1. Overview

6.1.1. Market size and forecast

6.2. North America

6.2.1. Key market trends, growth factors, and opportunities
6.2.2. Market size and forecast, by application
6.2.3. Market size and forecast, by distribution channel
6.2.4. Market size and forecast, by country
6.2.5. U.S.

6.2.5.1. Market size and forecast, by application
6.2.5.2. Market size and forecast, by distribution channel

6.2.6. Canada

6.2.6.1. Market size and forecast, by application
6.2.6.2. Market size and forecast, by distribution channel

6.2.7. Mexico

6.2.7.1. Market size and forecast, by application
6.2.7.2. Market size and forecast, by distribution channel

6.3. Europe

6.3.1. Key market trends, growth factors, and opportunities
6.3.2. Market size and forecast, by application
6.3.3. Market size and forecast, by distribution channel
6.3.4. Market size and forecast, by country
6.3.5. UK

6.3.5.1. Market size and forecast, by application
6.3.5.2. Market size and forecast, by distribution channel

6.3.6. Germany

6.3.6.1. Market size and forecast, by application
6.3.6.2. Market size and forecast, by distribution channel

6.3.7. France

6.3.7.1. Market size and forecast, by application
6.3.7.2. Market size and forecast, by distribution channel

6.3.8. Italy

6.3.8.1. Market size and forecast, by application
6.3.8.2. Market size and forecast, by distribution channel

6.3.9. Spain

6.3.9.1. Market size and forecast, by application
6.3.9.2. Market size and forecast, by distribution channel

6.3.10. Russia

6.3.10.1. Market size and forecast, by application
6.3.10.2. Market size and forecast, by distribution channel

6.3.11. Rest of Europe

6.3.11.1. Market size and forecast, by application
6.3.11.2. Market size and forecast, by distribution channel

6.4. Asia-Pacific

6.4.1. Key market trends, growth factors, and opportunities
6.4.2. Market size and forecast, by application
6.4.3. Market size and forecast, by distribution channel
6.4.4. Market size and forecast, by country
6.4.5. China

6.4.5.1. Market size and forecast, by application
6.4.5.2. Market size and forecast, by distribution channel

6.4.6. Japan

6.4.6.1. Market size and forecast, by application
6.4.6.2. Market size and forecast, by distribution channel

6.4.7. India

6.4.7.1. Market size and forecast, by application
6.4.7.2. Market size and forecast, by distribution channel

6.4.8. South Korea

6.4.8.1. Market size and forecast, by application
6.4.8.2. Market size and forecast, by distribution channel

6.4.9. Australia

6.4.9.1. Market size and forecast, by application
6.4.9.2. Market size and forecast, by distribution channel

6.4.10. Rest of Asia-Pacific

6.4.10.1. Market size and forecast, by application
6.4.10.2. Market size and forecast, by distribution channel

6.5. LAMEA

6.5.1. Key market trends, growth factors, and opportunities
6.5.2. Market size and forecast, by application
6.5.3. Market size and forecast, by distribution channel
6.5.4. Market size and forecast, by country
6.5.5. Brazil

6.5.5.1. Market size and forecast, by application
6.5.5.2. Market size and forecast, by distribution channel

6.5.6. Argentina

6.5.6.1. Market size and forecast, by application
6.5.6.2. Market size and forecast, by distribution channel

6.5.7. Saudi Arabia

6.5.7.1. Market size and forecast, by application
6.5.7.2. Market size and forecast, by distribution channel

6.5.8. South Africa

6.5.8.1. Market size and forecast, by application
6.5.8.2. Market size and forecast, by distribution channel

6.5.9. Rest of LAMEA

6.5.9.1. Market size and forecast, by application
6.5.9.2. Market size and forecast, by distribution channel

CHAPTER 6: COMPANY PROFILES

6.1. Alpen Dairies

6.1.1. Company overview
6.1.2. Company snapshot
6.1.3. Operating business segments
6.1.4. Product portfolio
6.1.5. Business performance

6.2. Amul

6.2.1. Company overview
6.2.2. Company snapshot
6.2.3. Operating business segments
6.2.4. Product portfolio
6.2.5. Business performance
6.2.6. Key strategic moves and developments

6.3. Arla Foods

6.3.1. Company overview
6.3.2. Company snapshot
6.3.3. Operating business segments
6.3.4. Product portfolio
6.3.5. Business performance
6.3.6. Key strategic moves and developments

6.4. Dairy Farmers of America Inc.

6.4.1. Company overview
6.4.2. Company snapshot
6.4.3. Operating business segments
6.4.4. Product portfolio
6.4.5. Key strategic moves and developments

6.5. Danone S.A.

6.5.1. Company overview
6.5.2. Company snapshot
6.5.3. Operating business segments
6.5.4. Product portfolio
6.5.5. Business performance
6.5.6. Key strategic moves and developments

6.6. Fonterra Co-operative Group Limited

6.6.1. Company overview
6.6.2. Company snapshot
6.6.3. Operating business segments
6.6.4. Product portfolio
6.6.5. Business performance
6.6.6. Key strategic moves and developments

6.7. LACTALIS Ingredients

6.7.1. Company overview
6.7.2. Company snapshot
6.7.3. Operating business segments
6.7.4. Business performance
6.7.5. Key strategic moves and developments

6.8. Nestle S.A.

6.8.1. Company overview
6.8.2. Company snapshot
6.8.3. Operating business segments
6.8.4. Product portfolio
6.8.5. Business performance

6.9. Saputo Inc.

6.9.1. Company overview
6.9.2. Company snapshot
6.9.3. Operating business segments
6.9.4. Product portfolio

6.10. Schreiber Foods Inc.

6.10.1. Company overview
6.10.2. Company snapshot
6.10.3. Operating business segments
6.10.4. Product portfolio
6.10.5. Business performance

LIST OF TABLES

TABLE 01. GLOBAL SKIMMED MILK MARKET VALUE, BY APPLICATION, 2017-2024 ($MILLION)
TABLE 02. GLOBAL SKIMMED MILK MARKET VOLUME, BY APPLICATION, 2017-2024 (KILOTONS)
TABLE 03. SKIMMED MILK MARKET VALUE FOR BAKERY, BY REGION, 2017-2024 ($MILLION)
TABLE 04. SKIMMED MILK MARKET VALUE FOR CONFECTIONARIES, BY REGION, 2017-2024 ($MILLION)
TABLE 05. SKIMMED MILK MARKET VALUE FOR DAIRY, BY REGION, 2017-2024 ($MILLION)
TABLE 06. SKIMMED MILK MARKET VALUE FOR PREPARED MIXES, BY REGION, 2017-2024 ($MILLION)
TABLE 07. SKIMMED MILK MARKET VALUE FOR OTHERS, BY REGION, 2017-2024 ($MILLION)
TABLE 08. GLOBAL SKIMMED MILK MARKET VALUE, BY DISTRIBUTION CHANNEL, 2017-2024 ($MILLION)
TABLE 09. GLOBAL SKIMMED MILK MARKET VOLUME, BY DISTRIBUTION CHANNEL, 2017-2024 (KILOTONS)
TABLE 10. SKIMMED MILK MARKET VALUE IN SUPERMARKET, BY REGION, 2017-2024 ($MILLION)
TABLE 11. SKIMMED MILK MARKET VALUE IN HYPERMARKET, BY REGION, 2017-2024 ($MILLION)
TABLE 12. SKIMMED MILK MARKET VALUE IN CONVENIENCE STORES, BY REGION, 2017-2024 ($MILLION)
TABLE 13. SKIMMED MILK MARKET VALUE IN ONLINE STORE, BY REGION, 2017-2024 ($MILLION)
TABLE 14. SKIMMED MILK MARKET VALUE IN WHOLESALERS, BY REGION, 2017-2024 ($MILLION)
TABLE 15. SKIMMED MILK MARKET VALUE, BY REGION, 2017-2024 ($MILLION)
TABLE 16. NORTH AMERICA SKIMMED MILK MARKET VALUE, BY APPLICATION, 2017-2024 ($MILLION)
TABLE 17. NORTH AMERICA SKIMMED MILK MARKET VALUE, BY DISTRIBUTION CHANNEL, 2017-2024 ($MILLION)
TABLE 18. NORTH AMERICA SKIMMED MILK MARKET VALUE, BY COUNTRY, 2017-2024 ($MILLION)
TABLE 19. U.S. SKIMMED MILK MARKET VALUE, BY APPLICATION, 2017-2024 ($MILLION)
TABLE 20. U.S. SKIMMED MILKMARKET VOLUME, BY APPLICATION, 2017-2024 (KILOTONS)
TABLE 21. U.S. SKIMMED MILKMARKET VALUE, BY DISTRIBUTION CHANNEL, 2017-2024 ($MILLION)
TABLE 22. U.S. SKIMMED MILKMARKET VOLUME, BY DISTRIBUTION CHANNEL, 2017-2024 (KILOTONS)
TABLE 23. CANADA SKIMMED MILKMARKET VALUE, BY APPLICATION, 2017-2024 ($MILLION)
TABLE 24. CANADA SKIMMED MILKMARKET VOLUME, BY APPLICATION, 2017-2024 (KILOTONS)
TABLE 25. CANADA SKIMMED MILKMARKET VALUE, BY DISTRIBUTION CHANNEL, 2017-2024 ($MILLION)
TABLE 26. CANADA SKIMMED MILKMARKET VOLUME, BY DISTRIBUTION CHANNEL, 2017-2024 (KILOTONS)
TABLE 27. MEXICO SKIMMED MILKMARKET VALUE, BY APPLICATION, 2017-2024 ($MILLION)
TABLE 28. MEXICO SKIMMED MILKMARKET VOLUME, BY APPLICATION, 2017-2024 (KILOTONS)
TABLE 29. MEXICO SKIMMED MILKMARKET VALUE, BY DISTRIBUTION CHANNEL, 2017-2024 ($MILLION)
TABLE 30. MEXICO SKIMMED MILKMARKET VOLUME, BY DISTRIBUTION CHANNEL, 2017-2024 (KILOTONS)
TABLE 31. EUROPE SKIMMED MILKMARKET VALUE, BY APPLICATION, 2017-2024 ($MILLION)
TABLE 32. EUROPE SKIMMED MILKMARKET VALUE, BY DISTRIBUTION CHANNEL, 2017-2024 ($MILLION)
TABLE 33. EUROPE SKIMMED MILKMARKET VALUE, BY COUNTRY, 2017-2024 ($MILLION)
TABLE 34. UK SKIMMED MILKMARKET VALUE, BY APPLICATION, 2017-2024 ($MILLION)
TABLE 35. UK SKIMMED MILKMARKET VOLUME, BY APPLICATION, 2017-2024 (KILOTONS)
TABLE 36. UK SKIMMED MILKMARKET VALUE, BY DISTRIBUTION CHANNEL, 2017-2024 ($MILLION)
TABLE 37. UK SKIMMED MILKMARKET VOLUME, BY DISTRIBUTION CHANNEL, 2017-2024 (KILOTONS)
TABLE 38. GERMANY SKIMMED MILKMARKET VALUE, BY APPLICATION, 2017-2024 ($MILLION)
TABLE 39. GERMANY SKIMMED MILKMARKET VOLUME, BY APPLICATION, 2017-2024 (KILOTONS)
TABLE 40. GERMANY SKIMMED MILKMARKET VALUE, BY DISTRIBUTION CHANNEL, 2017-2024 ($MILLION)
TABLE 41. GERMANY SKIMMED MILKMARKET VOLUME, BY DISTRIBUTION CHANNEL, 2017-2024 (KILOTONS)
TABLE 42. FRANCE SKIMMED MILKMARKET VALUE, BY APPLICATION, 2017-2024 ($MILLION)
TABLE 43. FRANCE SKIMMED MILKMARKET VOLUME, BY APPLICATION, 2017-2024 (KILOTONS)
TABLE 44. FRANCE SKIMMED MILKMARKET VALUE, BY DISTRIBUTION CHANNEL, 2017-2024 ($MILLION)
TABLE 45. FRANCE SKIMMED MILKMARKET VOLUME, BY DISTRIBUTION CHANNEL, 2017-2024 (KILOTONS)
TABLE 46. ITALY SKIMMED MILKMARKET VALUE, BY APPLICATION, 2017-2024 ($MILLION)
TABLE 47. ITALY SKIMMED MILKMARKET VOLUME, BY APPLICATION, 2017-2024 (KILOTONS)
TABLE 48. ITALY SKIMMED MILKMARKET VALUE, BY DISTRIBUTION CHANNEL, 2017-2024 ($MILLION)
TABLE 49. ITALY SKIMMED MILKMARKET VOLUME, BY DISTRIBUTION CHANNEL, 2017-2024 (KILOTONS)
TABLE 50. SPAIN SKIMMED MILKMARKET VALUE, BY APPLICATION, 2017-2024 ($MILLION)
TABLE 51. SPAIN SKIMMED MILKMARKET VOLUME, BY APPLICATION, 2017-2024 (KILOTONS)
TABLE 52. SPAIN SKIMMED MILKMARKET VALUE, BY DISTRIBUTION CHANNEL, 2017-2024 ($MILLION)
TABLE 53. SPAIN SKIMMED MILKMARKET VOLUME, BY DISTRIBUTION CHANNEL, 2017-2024 (KILOTONS)
TABLE 54. RUSSIA SKIMMED MILKMARKET VALUE, BY APPLICATION, 2017-2024 ($MILLION)
TABLE 55. RUSSIA SKIMMED MILKMARKET VOLUME, BY APPLICATION, 2017-2024 (KILOTONS)
TABLE 56. RUSSIA SKIMMED MILKMARKET VALUE, BY DISTRIBUTION CHANNEL, 2017-2024 ($MILLION)
TABLE 57. RUSSIA SKIMMED MILKMARKET VOLUME, BY DISTRIBUTION CHANNEL, 2017-2024 (KILOTONS)
TABLE 58. REST OF EUROPE SKIMMED MILKMARKET VALUE, BY APPLICATION, 2017-2024 ($MILLION)
TABLE 59. REST OF EUROPE SKIMMED MILKMARKET VOLUME, BY APPLICATION, 2017-2024 (KILOTONS)
TABLE 60. REST OF EUROPE SKIMMED MILKMARKET VALUE, BY DISTRIBUTION CHANNEL, 2017-2024 ($MILLION)
TABLE 61. REST OF EUROPE SKIMMED MILKMARKET VOLUME, BY DISTRIBUTION CHANNEL, 2017-2024 (KILOTONS)
TABLE 62. ASIA-PACIFIC SKIMMED MILK MARKET VALUE, BY APPLICATION, 2017-2024 ($MILLION)
TABLE 63. ASIA-PACIFIC SKIMMED MILK MARKET VALUE, BY DISTRIBUTION CHANNEL, 2017-2024 ($MILLION)
TABLE 64. ASIA-PACIFIC SKIMMED MILK MARKET VALUE, BY COUNTRY, 2017-2024 ($MILLION)
TABLE 65. CHINA SKIMMED MILK MARKET VALUE, BY APPLICATION, 2017-2024 ($MILLION)
TABLE 66. CHINA SKIMMED MILK MARKET VOLUME, BY APPLICATION, 2017-2024 (KILOTONS)
TABLE 67. CHINA SKIMMED MILK MARKET VALUE, BY DISTRIBUTION CHANNEL, 2017-2024 ($MILLION)
TABLE 68. CHINA SKIMMED MILK MARKET VOLUME, BY DISTRIBUTION CHANNEL, 2017-2024 (KILOTONS)
TABLE 69. JAPAN SKIMMED MILK MARKET VALUE, BY APPLICATION, 2017-2024 ($MILLION)
TABLE 70. JAPAN SKIMMED MILK MARKET VOLUME, BY APPLICATION, 2017-2024 (KILOTONS)
TABLE 71. JAPAN SKIMMED MILK MARKET VALUE, BY DISTRIBUTION CHANNEL, 2017-2024 ($MILLION)
TABLE 72. JAPAN SKIMMED MILK MARKET VOLUME, BY DISTRIBUTION CHANNEL, 2017-2024 (KILOTONS)
TABLE 73. INDIA SKIMMED MILK MARKET VALUE, BY APPLICATION, 2017-2024 ($MILLION)
TABLE 74. INDIA SKIMMED MILK MARKET VOLUME, BY APPLICATION, 2017-2024 (KILOTONS)
TABLE 75. INDIA SKIMMED MILK MARKET VALUE, BY DISTRIBUTION CHANNEL, 2017-2024 ($MILLION)
TABLE 76. INDIA SKIMMED MILK MARKET VOLUME, BY DISTRIBUTION CHANNEL, 2017-2024 (KILOTONS)
TABLE 77. SOUTH KOREA SKIMMED MILK MARKET VALUE, BY APPLICATION, 2017-2024 ($MILLION)
TABLE 78. SOUTH KOREA SKIMMED MILK MARKET VOLUME, BY APPLICATION, 2017-2024 (KILOTONS)
TABLE 79. SOUTH KOREA SKIMMED MILK MARKET VALUE, BY DISTRIBUTION CHANNEL, 2017-2024 ($MILLION)
TABLE 80. SOUTH KOREA SKIMMED MILK MARKET VOLUME, BY DISTRIBUTION CHANNEL, 2017-2024 (KILOTONS)
TABLE 81. AUSTRALIA SKIMMED MILK MARKET VALUE, BY APPLICATION, 2017-2024 ($MILLION)
TABLE 82. AUSTRALIA SKIMMED MILK MARKET VOLUME, BY APPLICATION, 2017-2024 (KILOTONS)
TABLE 83. AUSTRALIA SKIMMED MILK MARKET VALUE, BY DISTRIBUTION CHANNEL, 2017-2024 ($MILLION)
TABLE 84. AUSTRALIA SKIMMED MILK MARKET VOLUME, BY DISTRIBUTION CHANNEL, 2017-2024 (KILOTONS)
TABLE 85. REST OF ASIA-PACIFIC SKIMMED MILK MARKET VALUE, BY APPLICATION, 2017-2024 ($MILLION)
TABLE 86. REST OF ASIA-PACIFIC SKIMMED MILK MARKET VOLUME, BY APPLICATION, 2017-2024 (KILOTONS)
TABLE 87. REST OF ASIA-PACIFIC SKIMMED MILK MARKET VALUE, BY DISTRIBUTION CHANNEL, 2017-2024 ($MILLION)
TABLE 88. REST OF ASIA-PACIFIC SKIMMED MILK MARKET VOLUME, BY DISTRIBUTION CHANNEL, 2017-2024 (KILOTONS)
TABLE 89. LAMEA SKIMMED MILK MARKET VALUE, BY APPLICATION, 2017-2024 ($MILLION)
TABLE 90. LAMEA SKIMMED MILK MARKET VALUE, BY DISTRIBUTION CHANNEL, 2017-2024 ($MILLION)
TABLE 91. LAMEA SKIMMED MILK MARKET VALUE, BY COUNTRY, 2017-2024 ($MILLION)
TABLE 92. BRAZIL SKIMMED MILK MARKET VALUE, BY APPLICATION, 2017-2024 ($MILLION)
TABLE 93. BRAZIL SKIMMED MILK MARKET VOLUME, BY APPLICATION, 2017-2024 (KILOTONS)
TABLE 94. BRAZIL SKIMMED MILK MARKET VALUE, BY DISTRIBUTION CHANNEL, 2017-2024 ($MILLION)
TABLE 95. BRAZIL SKIMMED MILK MARKET VOLUME, BY DISTRIBUTION CHANNEL, 2017-2024 (KILOTONS)
TABLE 96. ARGENTINA SKIMMED MILK MARKET VALUE, BY APPLICATION, 2017-2024 ($MILLION)
TABLE 97. ARGENTINA SKIMMED MILK MARKET VOLUME, BY APPLICATION, 2017-2024 (KILOTONS)
TABLE 98. ARGENTINA SKIMMED MILK MARKET VALUE, BY DISTRIBUTION CHANNEL, 2017-2024 ($MILLION)
TABLE 99. ARGENTINA SKIMMED MILK MARKET VOLUME, BY DISTRIBUTION CHANNEL, 2017-2024 (KILOTONS)
TABLE 100. SAUDI ARABIA SKIMMED MILK MARKET VALUE, BY APPLICATION, 2017-2024 ($MILLION)
TABLE 101. SAUDI ARABIA SKIMMED MILK MARKET VOLUME, BY APPLICATION, 2017-2024 (KILOTONS)
TABLE 102. SAUDI ARABIA SKIMMED MILK MARKET VALUE, BY DISTRIBUTION CHANNEL, 2017-2024 ($MILLION)
TABLE 103. SAUDI ARABIA SKIMMED MILK MARKET VOLUME, BY DISTRIBUTION CHANNEL, 2017-2024 (KILOTONS)
TABLE 104. SOUTH AFRICA SKIMMED MILK MARKET VALUE, BY APPLICATION, 2017-2024 ($MILLION)
TABLE 105. SOUTH AFRICA SKIMMED MILK MARKET VOLUME, BY APPLICATION, 2017-2024 (KILOTONS)
TABLE 106. SOUTH AFRICA SKIMMED MILK MARKET VALUE, BY DISTRIBUTION CHANNEL, 2017-2024 ($MILLION)
TABLE 107. SOUTH AFRICA SKIMMED MILK MARKET VOLUME, BY DISTRIBUTION CHANNEL, 2017-2024 (KILOTONS)
TABLE 108. REST OF LAMEA SKIMMED MILK MARKET VALUE, BY APPLICATION, 2017-2024 ($MILLION)
TABLE 109. REST OF LAMEA SKIMMED MILK MARKET VOLUME, BY APPLICATION, 2017-2024 (KILOTONS)
TABLE 110. REST OF LAMEA SKIMMED MILK MARKET VALUE, BY DISTRIBUTION CHANNEL, 2017-2024 ($MILLION)
TABLE 111. REST OF LAMEA SKIMMED MILK MARKET VOLUME, BY DISTRIBUTION CHANNEL, 2017-2024 (KILOTONS)

LIST OF FIGURES

FIGURE 01. KEY MARKET SEGMENTS
FIGURE 02. TOP INVESTMENT POCKET, BY COUNTRY, 2017
FIGURE 03. LOW BARGAINING POWER OF SUPPLIERS
FIGURE 04. HIGH BARGAINING POWER OF BUYER
FIGURE 05. LOW THEREAT OF NEW ENTRANTS
FIGURE 06. HIGH THREAT OF SUBSTITUTE
FIGURE 07. MODERATE INTENSITY OF COMPETITIVE RIVALRY
FIGURE 08. DAIRY PRODUCTS AND CONFECTIONERIES PRODUCTION IN EUROPE, 2013-2015 (MILLION TONS)
FIGURE 09. SALES OF DAIRY ALTERNATIVE MILK IN U.S. IN 2015 ($MILLION)
FIGURE 10. TOP PLAYER POSITIONING
FIGURE 11. GLOBAL SKIMMED MILK MARKET SHARE, BY PRODUCT, 2017-2024
FIGURE 12. COMPARATIVE SHARE ANALYSIS OF SKIMMED MILK MARKET VALUE FOR BAKERY,  BY COUNTRY, 2017 & 2024 (%)
FIGURE 13. COMPARATIVE SHARE ANALYSIS OF SKIMMED MILK MARKET VOLUME FOR BAKERY,  BY COUNTRY, 2017 & 2024 (%)
FIGURE 14. COMPARATIVE SHARE ANALYSIS OF SKIMMED MILK MARKET VALUE FOR CONFECTIONARIES,  BY COUNTRY, 2017 & 2024 (%)
FIGURE 15. COMPARATIVE SHARE ANALYSIS OF SKIMMED MILK MARKET VOLUME FOR CONFECTIONARIES, BY COUNTRY, 2017 & 2024 (%)
FIGURE 16. COMPARATIVE SHARE ANALYSIS OF SKIMMED MILK MARKET VALUE FOR DAIRY,  BY COUNTRY, 2017 & 2024 (%)
FIGURE 17. COMPARATIVE SHARE ANALYSIS OF SKIMMED MILK MARKET VOLUME FOR DAIRY,  BY COUNTRY, 2017 & 2024 (%)
FIGURE 18. COMPARATIVE SHARE ANALYSIS OF SKIMMED MILK MARKET VALUE FOR PREPARED MIXES,  BY COUNTRY, 2017 & 2024 (%)
FIGURE 19. COMPARATIVE SHARE ANALYSIS OF SKIMMED MILK MARKET VOLUME FOR PREPARED MIXES,  BY COUNTRY, 2017 & 2024 (%)
FIGURE 20. COMPARATIVE SHARE ANALYSIS OF SKIMMED MILK MARKET VALUE FOR OTHERS,  BY COUNTRY, 2017 & 2024 (%)
FIGURE 21. COMPARATIVE SHARE ANALYSIS OF SKIMMED MILK MARKET VOLUME FOR OTHERS,  BY COUNTRY, 2017 & 2024 (%)
FIGURE 22. GLOBAL SKIMMED MILK MARKET SHARE, BY DISTRIBUTION CHANNEL, 2017-2024
FIGURE 23. COMPARATIVE SHARE ANALYSIS OF SKIMMED MILK MARKET VALUE FOR SUPERMARKET, BY COUNTRY, 2017 & 2024 (%)
FIGURE 24. COMPARATIVE SHARE ANALYSIS OF SKIMMED MILK MARKET VOLUME FOR SUPERMARKET, BY COUNTRY, 2017 & 2024 (%)
FIGURE 25. COMPARATIVE SHARE ANALYSIS OF SKIMMED MILK MARKET VALUE FOR HYPERMARKET, BY COUNTRY, 2017 & 2024 (%)
FIGURE 26. COMPARATIVE SHARE ANALYSIS OF SKIMMED MILK MARKET VOLUME FOR HYPERMARKET, BY COUNTRY, 2017 & 2024 (%)
FIGURE 27. COMPARATIVE SHARE ANALYSIS OF SKIMMED MILK MARKET VALUE FOR CONVENIENCE STORE, BY COUNTRY, 2017 & 2024 (%)
FIGURE 28. COMPARATIVE SHARE ANALYSIS OF SKIMMED MILK MARKET VOLUME FOR CONVENIENCE STORE, BY COUNTRY, 2017 & 2024 (%)
FIGURE 29. COMPARATIVE SHARE ANALYSIS OF SKIMMED MILK MARKET VALUE FOR ONLINE STORE, BY COUNTRY, 2017 & 2024 (%)
FIGURE 30. COMPARATIVE SHARE ANALYSIS OF SKIMMED MILK MARKET VOLUME FOR ONLINE STORE, BY COUNTRY, 2017 & 2024 (%)
FIGURE 31. COMPARATIVE SHARE ANALYSIS OF SKIMMED MILK MARKET VALUE FOR WHOLESALERS, BY COUNTRY, 2017 & 2024 (%)
FIGURE 32. COMPARATIVE SHARE ANALYSIS OF SKIMMED MILK MARKET VOLUME FOR WHOLESALERS, BY COUNTRY, 2017 & 2024 (%)
FIGURE 33. GLOBAL SKIMMED MILK MARKET SHARE, BY REGION, 2017-2024
FIGURE 34. U.S. SKIMMED MILK MARKET, 2017-2024 ($MILLION)
FIGURE 35. CANADA SKIMMED MILK MARKET, 2017-2024 ($MILLION)
FIGURE 36. MEXICO SKIMMED MILK MARKET, 2017-2024 ($MILLION)
FIGURE 37. UK SKIMMED MILK MARKET, 2017-2024 ($MILLION)
FIGURE 38. GERMANY SKIMMED MILK MARKET, 2017-2024 ($MILLION)
FIGURE 39. FRANCE SKIMMED MILK MARKET, 2017-2024 ($MILLION)
FIGURE 40. ITALY SKIMMED MILK MARKET, 2017-2024 ($MILLION)
FIGURE 41. SPAIN SKIMMED MILK MARKET, 2017-2024 ($MILLION)
FIGURE 42. RUSSIA SKIMMED MILK MARKET, 2017-2024 ($MILLION)
FIGURE 43. REST OF EUROPE SKIMMED MILK MARKET, 2017-2024 ($MILLION)
FIGURE 44. CHINA SKIMMED MILK MARKET, 2017-2024 ($MILLION)
FIGURE 45. JAPAN SKIMMED MILK MARKET, 2017-2024 ($MILLION)
FIGURE 46. INDIA SKIMMED MILK MARKET, 2017-2024 ($MILLION)
FIGURE 47. SOUTH KOREA SKIMMED MILK MARKET, 2017-2024 ($MILLION)
FIGURE 48. AUSTRALIA SKIMMED MILK MARKET, 2017-2024 ($MILLION)
FIGURE 49. REST OF ASIA-PACIFIC SKIMMED MILK MARKET, 2017-2024 ($MILLION)
FIGURE 50. BRAZIL SKIMMED MILK MARKET, 2017-2024 ($MILLION)
FIGURE 51. ARGENTINA SKIMMED MILK MARKET, 2017-2024 ($MILLION)
FIGURE 52. SAUDI ARABIA SKIMMED MILK MARKET, 2017-2024 ($MILLION)
FIGURE 53. SOUTH AFRICA SKIMMED MILK MARKET, 2017-2024 ($MILLION)
FIGURE 54. REST OF LAMEA SKIMMED MILK MARKET, 2017-2024 ($MILLION)


Skimmed milk is the resultant of cream removal from regular milk. It is prepared by placing the whole milk into a machine called a centrifugal separator, which spins some or all of the fat globules out of the milk. Skimmed milk also known as nonfat milk contains 0-0.5% of fat contents and it is a source of high nutritional contents such as protein, calcium, phosphorous, vitamin D, and vitamin A. It helps to build strong bones, teeth, and muscles, and also aids in healthy weight management.

Confectionary and bakery products have gained popularity among masses, due to changes in lifestyles and taste preferences of consumers. This enforces food manufacturers to modify their product portfolio. They have started to invest huge amount in R&D activities for introduction of innovative food products to meet consumers demand. They have also started to use the food ingredients, which are low in fat and calorie to enhance the products and make them healthier. Skim milk have the lowest fat content, nearly 0-0.5% as compared to whole milk, powdered milk, and others, hence it is widely used for the preparation of various dairy, bakery, and confectionery products. Wide applications of skim milk in food industry fuels the growth of the skimmed milk market. Moreover, skim milk has slightly more calcium and protein when compared to full fat milk and has no added sugar. It is loaded with protein, calcium, phosphorous, vitamin D, and vitamin A, making it a source of high-quality, complete protein. It helps build strong bones, teeth, and muscles, and also aids in healthy weight management. Due to these nutritional benefits many health experts and dieticians vouch for skimmed milk, thereby driving the growth of the market. Furthermore, increase in use of casein and caseinates, which is prepared from skim milk and widely used as food ingredients in dairy, sports-nutrition, confectionery, and meat products is anticipated to have a positive impact on the market growth.

PURCHASE OPTIONS

Call or Email us

U.S.-Canada Toll-free: +1-800-792-5285
Int'l : +1-503-894-6022
Europe : +44-845-528-1300
Email : help@alliedmarketresearch.com

Looking for Customization?

 Customization Request

Have a Question?

 Speak with Analyst

Any Confusion?

 Inquire Before Buying

Have a glance of the Report

  Request Sample

Purchase Full Report of
Skimmed Milk Market

Start reading instantly.
This Report and over 67,068+ more Reports, Available with Avenue Library. T&C*.

  • Online Only
  • $3,456
  • Online cloud access only
  • Restricted print, copy, paste & download
  • Read only
  • Free industry update
    (Within 180 days)
  • Free report update in next update cycle
    (May 2019 - May 2020)
  • Data Pack
  • $3,840
  • Restricted to one authorized user
  • One print only
  • Available in
    Excel
  • Free industry update
    (Within 180 days)
  •   Free report update in next update cycle
    (May 2019 - May 2020)
  • Single User
  • $5,769
  • Restricted to one authorized user
  • One print only
  • Available in
    PDF
  • Free industry update
    (Within 180 days)
  •   Free report update in next update cycle
    (May 2019 - May 2020)
  • Five Users
  • $6,450
  • Limited to five authorized users
  • Print upto five copies
  • Available in
    PDF
  • Free industry update
    (Within 180 days)
  •   Free report update in next update cycle
    (May 2019 - May 2020)
  • Enterprise
    License/PDF

  • $10,995
  • Unlimited
    within
    company/enterprise
  • Available in Excel & PDF
  • Free industry update
    (Within 180 days)
  •   Free report update in next update cycle
    (May 2019 - May 2020)
  • Library
    Membership

  • $999 $ 1,175
    Per User/ Per month/ Billed annually
  • Published Content
    E-access
  • Company Profiles
    E-access
  • Newly Added Content Access
  • 10 PDF
    Downloads
  • 5 Excel Data
    Pack Downloads
  • 250 Company Profiles PDF Downloads
  • Buy Now

*Taxes/Fees, if applicable will be added during checkout. All prices in USD

RELATED REPORTS
 

Why Allied Market Research?


Infallible Methodology

To ensure high-level data integrity, accurate analysis, and impeccable forecasts

Analyst Support

For complete satisfaction

Customization

On-demand customization of scope of the report to exactly meet your needs

TARGETED MARKET VIEW

Targeted market view to provide pertinent information and save time of readers

Get fresh content delivered

Get insights on topics that are crucial for your business. Stay abreast of your interest areas.

Get Industry Data Alerts

Why Allied Market Research?

Infallible Methodology

To ensure high-level data integrity, accurate analysis, and impeccable forecasts

Analyst Support

For complete satisfaction

Customization

On-demand customization of scope of the report to exactly meet your needs

TARGETED MARKET VIEW

Targeted market view to provide pertinent information and save time of readers