A11780 | Pages: 332 | Jun 2021 | 2567 Views | | |
Author(s) : Divyanshi Tewari, Himanshu Jangra , Vineet Kumar | Tables: 149 | Charts: 92 |
|
Pandemic disrupted the entire world and affected many industries.
Get detailed COVID-19 impact analysis on the Smart Display Market
Request Now !
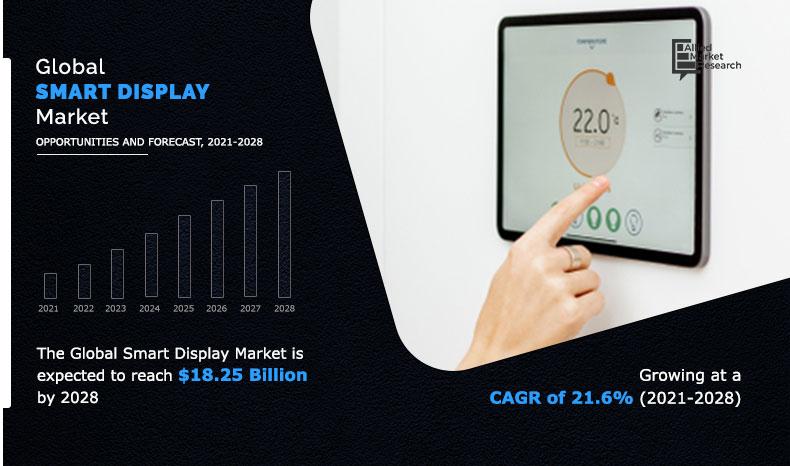
The smart display market size was valued at $3.78 billion in 2020, and is projected to reach at $18.25 billion by 2028, growing at a CAGR of 21.6% from 2021 to 2028.
A smart display is an intelligent digital solution used to be controlled through voice remote devices or with the Internet of Thing (IoT) enabled devices. The smart display application in the automotive and retail sector such as the smart mirror is an innovative technology capable of tracking the user’s personal information and shopper’s experience. Further, smart emerging as an advanced technological solution is adding interactive and advanced controlling features.
Get more information on this report : Request Sample Pages
Smart display applications utilize technologies such as LED, LCD, and other projections onto the display on a preselected content. A smart display is popularly used across retail, sport & entertainment, and healthcare, owing to surge in demand for next-generation advertising and monitoring technology. Besides, smart display applications such as signage and mirrors are designed to enhance customer shopping experiences, greet customers, and display advertisements in retail stores, which fuels its adoption of machine vision technology in the hospital and clinical sector.
The smart display market is expected to witness growth during the forecast period, owing to rise in demand for artificial intelligence and Internet of Things based smart application in the residential sector due to surge in disposable income in developing countries. Further, the market for smart display is expected to be driven by increase in demand for smart mirror systems in the automotive industry. Moreover, increase in demand for digital advertisement across healthcare, retail, and commercial sectors is expected to boost the demand for smart display. Considering these factors, the smart display market is estimated to experience a steep growth in the future.
Get more information on this report : Request Sample Pages
Rise in number of smart retail stores worldwide and surge in demand for enhanced smart display solutions are expected to offer lucrative opportunity for the growth of the automotive smart display market during the forecast period. However, high risk of data breach and device malfunction acts as a major challenge for this market. Further, surge in adoption of smart home application in the residential sector is opportunistic for the market growth.
The global outbreak of COVID-19 has significantly affected the growth of the smart display market in 2020, and the market is estimated to witness relatively slow growth till the end of 2021. Further, the global selling market was primarily hit by several obstacles due to COVID-19 in the manufacturing and selling industries such as lack of availability of raw material and skill workforce, contractual obligations, and project delays or cancellations. Thus, it resulted in decreased demand for the market for automotive.
Get more information on this report : Request Sample Pages
The smart display market is segmented on the basis of type, resolution, display size, end user and region. On the basis of type, it is fragmented into signage, smart mirror, and home display. The signage segment dominated the market, in terms of revenue in 2019, and is expected to follow the same trend during the forecast period. On the basis of resolution, the market is segregated into UHD, FHD, and HD. The HD segment dominated the market, in terms of revenue in 2019, however, the UHD segment is projected to witness significant market share during the forecast period. By end user, the market is divided into residential, retail, automotive, healthcare, and Sport & Entertainment. The smart display market share of retail segment accounted highest in 2019, and the automotive segment is expected to grow at a high CAGR from 2021 to 2028.
Region wise, the smart display market trends are analyzed across North American (the U.S., Canada, and Mexico), Europe (the UK, Germany, France, Spain, Italy, and rest of Europe), Asia-Pacific (China, Japan, India, and rest of Asia-Pacific), and LAMEA (Latin America, the Middle East, and Africa). APAC is expected to develop at highest rate during the forecast period. APAC, specifically Japan, remains a significant participant in the global supply chain market; organizations in the country are intensely putting resources into the technology; for example, usage of multifunction printing technology for cost-efficient methods.
Get more information on this report : Request Sample Pages
The ongoing spread of COVID-19 has become one of the biggest threats to the global economy and is causing widespread concerns and economic hardship for consumers, businesses, and communities across the globe. The “new normal” that includes social distancing and working from home has created challenges with daily activities, regular work, needs, and supplies, causing delayed initiatives and missed opportunities.
The COVID-19 pandemic is impacting the society and overall economy across the globe. The impact of this outbreak is growing day-by-day as well as affecting the supply chain. It is creating uncertainty in the stock market, falling business confidence, massive slowing of supply chain, and increase in panic among customers. European countries under lockdown have suffered a major loss of business and revenue due to shutdown of manufacturing units in the region. Operations of production and manufacturing industries have been heavily impacted by the outbreak of COVID-19, which led to slowdown in growth of the smart display industry in 2020.
According to the smart display market trends, the COVID-19 pandemic has severely impacted the global manufacturing and industrial sectors as production facilities have stalled, which, in turn, led to significant demand in industries.
The emergence of COVID-19 has declined the growth of the personal market size in 2020, and is estimated to witness slow growth till the end of 2021. Implementation of partial or complete lockdown across various countries globally is the prime reason for this decline in growth rate. As industries were temporarily shut, it reduced the need for maintenance from various industries.
Significant factors that impact the growth of the global smart display industry include rapid adoption of artificial intelligence and Internet of Thing enabled smart applications in commercial, residential, and industrial sectors and surge in demand for smart mirror in the automotive industry. However, high risk of customer data breach and device malfunction is acting as a major barrier for early adoption, which hampers the smart display market growth. On the contrary, growth in numbers of smart stores globally is anticipated to provide lucrative opportunities for the smart display market during the forecast period.
Get more information on this report : Request Sample Pages
Competitive analysis and profiles of the major smart display market players such as Samsung, LG Electronics, Alphabet (Google LLC), Panasonic Corporation, Japan Display Inc., Sony, Alpine Electronics, Sharp Corporation, Leyard Optoelectronic, and Manga International Inc. are provided in this report.
Get more information on this report : Request Sample Pages
Key Benefits For Stakeholders
Key Market Segments
By Type
By Resolution
By Display Size
By End User
Key Players
By Region
Chapter 1:Introduction
1.1.Report description
1.2.Key benefits for stakeholders
1.3.Key market segments
1.4.Research methodology
1.4.1.Primary research
1.4.2.Secondary research
1.4.3.Analyst tools and models
Chapter 2:Executive summary
2.1.Key findings
2.1.1.Top impacting factors
2.1.2.Top investment pockets
2.2.CXO perspective
Chapter 3:MARKET OVERVIEW
3.1.Market definition and scope
3.2.Porter’s five forces analysis
3.3.Patent analysis
3.3.1.Smart display patent analysis, by region (2012-2020)
3.3.2.Smart display patent analysis, by applicant
3.4.Market dynamics
3.4.1.Drivers
3.4.1.1.Increase in demand for AI and IoT enabled Smart application
3.4.1.2.Surge in demand for smart mirror in automotive industry
3.4.2.Restraint
3.4.2.1.High risk of customer data breach
3.4.2.2.High cost of the technology in developing countries
3.4.3.Opportunity
3.4.3.1.Growth in adoption of smart technologies in emerging economies such as Asia-Pacific and LAMEA
3.4.3.2.Surge in demand for enhanced smart display application in healthcare sector
3.4.4.Challenges
3.4.4.1.High risk of device malfunction
3.5.COVID-19 impact analysis
3.5.1.Impact on market size
3.5.2.END USE trends, preferences, and budget impact
3.5.3.Key player strategies to tackle negative impact
3.5.3.1.Limited investments for R&D
3.5.3.2.Focus on next-generation products
3.5.3.3.Shift toward agile supply chain model
Chapter 4:Smart display MARKET, BY Type
4.1.Overview
4.2.Signage
4.2.1.Key market trends, growth factors, and opportunities
4.2.2.Market size and forecast, by region
4.2.3.Market analysis, by country
4.3.Home display
4.3.1.Key market trends, growth factors, and opportunities
4.3.2.Market size and forecast, by region
4.3.3.Market analysis, by country
4.4.Smart Mirror
4.4.1.Key market trends, growth factors, and opportunities
4.4.2.Market size and forecast, by region
4.4.3.Market analysis, by country
Chapter 5:Smart display MARKET, BY display size
5.1.Overview
5.2.Below 32 inches
5.2.1.Key market trends, growth factors, and opportunities
5.2.2.Market size and forecast, by region
5.2.3.Market analysis, by country
5.3.Between 32 and 52 inches
5.3.1.Key market trends, growth factors, and opportunities
5.3.2.Market size and forecast, by region
5.3.3.Market analysis, by country
5.4.Above 52 inches
5.4.1.Key market trends, growth factors, and opportunities
5.4.2.Market size and forecast, by region
5.4.3.Market analysis, by country
Chapter 6:Smart display MARKET, BY resolution
6.1.Overview
6.2.FHD
6.2.1.Key market trends, growth factors, and opportunities
6.2.2.Market size and forecast, by region
6.2.3.Market analysis, by country
6.3.HD
6.3.1.Key market trends, growth factors, and opportunities
6.3.2.Market size and forecast, by region
6.3.3.Market analysis, by country
6.4.UHD
6.4.1.Key market trends, growth factors, and opportunities
6.4.2.Market size and forecast, by region
6.4.3.Market analysis, by country
Chapter 7:smart display market, by end-use
7.1.Overview
7.2.Automotive
7.2.1.Key market trends, growth factors, and opportunities
7.2.2.Market size and forecast, by region
7.2.3.Market analysis, by country
7.3.Residential
7.3.1.Key market trends, growth factors, and opportunities
7.3.2.Market size and forecast, by region
7.3.3.Market analysis, by country
7.4.Retail
7.4.1.Key market trends, growth factors, and opportunities
7.4.2.Market size and forecast, by region
7.4.3.Market analysis, by country
7.5.Healthcare
7.5.1.Key market trends, growth factors, and opportunities
7.5.2.Market size and forecast, by region
7.5.3.Market analysis, by country
7.6.Sport & Entertainment
7.6.1.Key market trends, growth factors, and opportunities
7.6.2.Market size and forecast, by region
7.6.3.Market analysis, by country
Chapter 8:digital priting MARKET, BY Region
8.1.Overview
8.2.North America
8.2.1.Key market trends, growth factors, and opportunities
8.2.2.Market size and forecast, by type
8.2.3.Market size and forecast, by display size
8.2.4.Market size and forecast, by resolution
8.2.5.Market size and forecast, by end use
8.2.6.Market analysis, by country
8.2.6.1.U.S.
8.2.6.1.1.Market size and forecast, by type
8.2.6.1.2.Market size and forecast, by resolution
8.2.6.1.3.Market size and forecast, by display size
8.2.6.1.4.Market size and forecast, by END USE
8.2.6.2.Canada
8.2.6.2.1.Market size and forecast, by type
8.2.6.2.2.Market size and forecast, by resolution
8.2.6.2.3.Market size and forecast, by display size
8.2.6.2.4.Market size and forecast, by END USE
8.2.6.3.Mexico
8.2.6.3.1.Market size and forecast, by type
8.2.6.3.2.Market size and forecast, by resolution
8.2.6.3.3.Market size and forecast, by display size
8.2.6.3.4.Market size and forecast, by END USE
8.3.Europe
8.3.1.Key market trends, growth factors, and opportunities
8.3.2.Market size and forecast, by type
8.3.3.Market size and forecast, by display size
8.3.4.Market size and forecast, by resolution
8.3.5.Market size and forecast, by end use
8.3.6.Market analysis, by country
8.3.6.1.UK
8.3.6.1.1.Market size and forecast, by type
8.3.6.1.2.Market size and forecast, by resolution
8.3.6.1.3.Market size and forecast, by display size
8.3.6.1.4.Market size and forecast, by END USE
8.3.6.2.Germany
8.3.6.2.1.Market size and forecast, by type
8.3.6.2.2.Market size and forecast, by resolution
8.3.6.2.3.Market size and forecast, by display size
8.3.6.2.4.Market size and forecast, by END USE
8.3.6.3.France
8.3.6.3.1.Market size and forecast, by type
8.3.6.3.2.Market size and forecast, by resolution
8.3.6.3.3.Market size and forecast, by display size
8.3.6.3.4.Market size and forecast, by END USE
8.3.6.4.Italy
8.3.6.4.1.Market size and forecast, by type
8.3.6.4.2.Market size and forecast, by resolution
8.3.6.4.3.Market size and forecast, by display size
8.3.6.4.4.Market size and forecast, by END USE
8.3.6.5.Rest of Europe
8.3.6.5.1.Market size and forecast, by type
8.3.6.5.2.Market size and forecast, by resolution
8.3.6.5.3.Market size and forecast, by display size
8.3.6.5.4.Market size and forecast, by END USE
8.4.Asia-pacific
8.4.1.Key market trends, growth factors, and opportunities
8.4.2.Market size and forecast, by type
8.4.3.Market size and forecast, by display size
8.4.4.Market size and forecast, by resolution
8.4.5.Market size and forecast, by end use
8.4.6.Market analysis, by country
8.4.6.1.China
8.4.6.1.1.Market size and forecast, by type
8.4.6.1.2.Market size and forecast, by resolution
8.4.6.1.3.Market size and forecast, by display size
8.4.6.1.4.Market size and forecast, by END USE
8.4.6.2.Japan
8.4.6.2.1.Market size and forecast, by type
8.4.6.2.2.Market size and forecast, by resolution
8.4.6.2.3.Market size and forecast, by display size
8.4.6.2.4.Market size and forecast, by END USE
8.4.6.3.India
8.4.6.3.1.Market size and forecast, by type
8.4.6.3.2.Market size and forecast, by resolution
8.4.6.3.3.Market size and forecast, by display size
8.4.6.3.4.Market size and forecast, by END USE
8.4.6.4.South Korea
8.4.6.4.1.Market size and forecast, by type
8.4.6.4.2.Market size and forecast, by resolution
8.4.6.4.3.Market size and forecast, by display size
8.4.6.4.4.Market size and forecast, by END USE
8.4.6.5.Rest of Asia-Pacific
8.4.6.5.1.Market size and forecast, by type
8.4.6.5.2.Market size and forecast, by resolution
8.4.6.5.3.Market size and forecast, by display size
8.4.6.5.4.Market size and forecast, by END USE
8.5.LAMEA
8.5.1.Key market trends, growth factors, and opportunities
8.5.2.Market size and forecast, by type
8.5.3.Market size and forecast, by display size
8.5.4.Market size and forecast, by resolution
8.5.5.Market size and forecast, by end use
8.5.6.Market analysis, by country
8.5.6.1.Latin America
8.5.6.1.1.Market size and forecast, by type
8.5.6.1.2.Market size and forecast, by resolution
8.5.6.1.3.Market size and forecast, by display size
8.5.6.1.4.Market size and forecast, by END USE
8.5.6.2.Middle East
8.5.6.2.1.Market size and forecast, by type
8.5.6.2.2.Market size and forecast, by resolution
8.5.6.2.3.Market size and forecast, by display size
8.5.6.2.4.Market size and forecast, by END USE
8.5.6.3.Africa
8.5.6.3.1.Market size and forecast, by type
8.5.6.3.2.Market size and forecast, by resolution
8.5.6.3.3.Market size and forecast, by display size
8.5.6.3.4.Market size and forecast, by END USE
Chapter 9:Competitive landscape
9.1.Introduction
9.2.Top Winning Strategies
9.2.1.Top winning strategies, by year
9.2.2.Top winning strategies, by development
9.2.3.Top winning strategies, by company
9.3.Product Mapping of top 10 Player
9.4.Competitive heat map
9.5.Competitive Dashboard
Chapter 10:company profile
10.1.Alpine Electronics, Inc. (Alps Alpine Co., Ltd.)
10.1.1.Company overview
10.1.2.Key executives
10.1.3.Company snapshot
10.1.4.Operating business segments
10.1.5.Product portfolio
10.1.6.R&D expenditure
10.1.7.Business performance
10.1.8.Key strategic moves and developments
10.2.Alphabet Inc. (Google LLC)
10.2.1.Company overview
10.2.2.Key executives
10.2.3.Company snapshot
10.2.4.Operating business segments
10.2.5.Product portfolio
10.2.6.R&D expenditure
10.2.7.Business performance
10.2.8.Key strategic moves and developments
10.3.Japan Display Inc. (JDI)
10.3.1.Company overview
10.3.2.Key executives
10.3.3.Company snapshot
10.3.4.Operating business segments
10.3.5.Product portfolio
10.3.6.R&D expenditure
10.3.7.Business performance
10.3.8.Key strategic moves and developments
10.4.Leyard Optoelectronic Co., Ltd.
10.4.1.Company overview
10.4.2.Key executives
10.4.3.Company snapshot
10.4.4.Operating business segments
10.4.5.Product portfolio
10.4.6.Business performance
10.4.7.Key strategic moves and developments
10.5.LG Electronics Inc.
10.5.1.Company overview
10.5.2.Key executives
10.5.3.Company snapshot
10.5.4.Operating business segments
10.5.5.Product portfolio
10.5.6.R&D expenditure
10.5.7.Business performance
10.5.8.Key strategic moves and developments
10.6.Magna International Inc.
10.6.1.Company overview
10.6.2.Key executives
10.6.3.Company snapshot
10.6.4.Operating business segments
10.6.5.Product portfolio
10.6.6.R&D expenditure
10.6.7.Business performance
10.6.8.Key strategic moves and developments
10.7.Panasonic Corporation
10.7.1.Company overview
10.7.2.Key executives
10.7.3.Company snapshot
10.7.4.Operating business segments
10.7.5.Product portfolio
10.7.6.R&D expenditure
10.7.7.Business performance
10.7.8.Key strategic moves and developments
10.8.Samsung
10.8.1.Company overview
10.8.2.Key executives
10.8.3.Company snapshot
10.8.4.Operating business segments
10.8.5.Product portfolio
10.8.6.R&D expenditure
10.8.7.Business performance
10.8.8.Key strategic moves and developments
10.9.Sharp Corporation
10.9.1.Company overview
10.9.2.Key executives
10.9.3.Company snapshot
10.9.4.Operating business segments
10.9.5.Product portfolio
10.9.6.R&D expenditure
10.9.7.Business performance
10.9.8.Key strategic moves and developments
10.10.Sony Corporation
10.10.1.Company overview
10.10.2.Key executives
10.10.3.Company snapshot
10.10.4.Operating business segments
10.10.5.Product portfolio
10.10.6.R&D expenditure
10.10.7.Business performance
10.10.8.Key strategic moves and developments
LIST OF TABLES
TABLE 01.GLOBAL SMART DISPLAY MARKET, BY TYPE, 2020-2028 ($MILLION)
TABLE 02.SIGNAGE SMART DISPLAY MARKET, BY REGION, 2020–2028 ($MILLION)
TABLE 03.HOME DISPLAYSMART DISPLAY MARKET, BY REGION, 2020–2028 ($MILLION)
TABLE 04.SMART MIRRORSMART DISPLAY MARKET, BY REGION, 2020–2028 ($MILLION)
TABLE 05.GLOBAL SMART DISPLAY MARKET, BY DISPLAY SIZE, 2020-2028 ($MILLION)
TABLE 06.ABOVE 32 INCHSMART DISPLAY MARKET, BY REGION, 2020–2028 ($MILLION)
TABLE 07.BETWEEN 32 AND 52 INCHESSMART DISPLAY MARKET, BY REGION, 2020–2028 ($MILLION)
TABLE 08.ABOVE 32 INCHSMART DISPLAY MARKET, BY REGION, 2020–2028 ($MILLION)
TABLE 09.GLOBAL SMART DISPLAY MARKET, BY RESOLUTION, 2020-2028 ($MILLION)
TABLE 10.FHDSMART DISPLAY MARKET, BY REGION, 2020–2028 ($MILLION)
TABLE 11.HDSMART DISPLAY MARKET, BY REGION, 2020–2028 ($MILLION)
TABLE 12.UHDSMART DISPLAY MARKET, BY REGION, 2020–2028 ($MILLION)
TABLE 13.GLOBAL SMART DISPLAY MARKET, BY RESOLUTION, 2020-2028 ($MILLION)
TABLE 14.AUTOMOTIVESMART DISPLAY MARKET, BY REGION, 2020–2028 ($MILLION)
TABLE 15.RESIDENTIALSMART DISPLAY MARKET, BY REGION, 2020–2028 ($MILLION)
TABLE 16.RETAILSMART DISPLAY MARKET, BY REGION, 2020–2028 ($MILLION)
TABLE 17.HEALTHCARESMART DISPLAY MARKET, BY REGION, 2020–2028 ($MILLION)
TABLE 18.SPORT & ENTERTAINMENTSMART DISPLAY MARKET, BY REGION, 2020–2028 ($MILLION)
TABLE 19.SMART DISPLAY MARKET REVENUE, BY REGION, 2020–2028 ($MILLION)
TABLE 20.NORTH AMERICA SMART DISPLAY MARKET, BY TYPE 2020–2028 ($MILLION)
TABLE 21.NORTH AMERICA SMART DISPLAY MARKET, BY TYPE 2020–2028, ($MILLION)
TABLE 22.NORTH AMERICA SMART DISPLAY MARKET, BY RESOLUTION, 2020–2028($MILLION)
TABLE 23.NORTH AMERICA SMART DISPLAY MARKET, BY END USE, 2020–2028($MILLION)
TABLE 24.U.S. SMART DISPLAY MARKET, BY TYPE 2020–2028($MILLION)
TABLE 25.U.S. SMART DISPLAY MARKET, BY RESOLUTION, 2020–2028 ($MILLION)
TABLE 26.U.S. SMART DISPLAY MARKET, BY DISPLAY SIZE 2020–2028 ($MILLION)
TABLE 27.U.S. SMART DISPLAY MARKET, BY END USE, 2020–2028 ($MILLION)
TABLE 28.CANADA. SMART DISPLAY MARKET, BY TYPE 2019–2028($MILLION)
TABLE 29.CANADASMART DISPLAY MARKET, BY RESOLUTION, 2020–2028 ($MILLION)
TABLE 30.CANADASMART DISPLAY MARKET, BY DISPLAY SIZE 2020–2028 ($MILLION)
TABLE 31.CANADASMART DISPLAY MARKET, BY END USE, 2020–2028 ($MILLION)
TABLE 32.MEXICOSMART DISPLAY MARKET, BY TYPE 2020–2028($MILLION)
TABLE 33.MEXICO SMART DISPLAY MARKET, BY END USE, 2020–2028 ($MILLION)
TABLE 34.MEXICO SMART DISPLAY MARKET, BY DISPLAY SIZE 2020–2028 ($MILLION)
TABLE 35.MEXICOSMART DISPLAY MARKET, BY END USE, 2020–2028 ($MILLION)
TABLE 36.EUROPE SMART DISPLAYMARKET, BY TYPE 2020–2028 ($MILLION)
TABLE 37.EUROPE SMART DISPLAY MARKET, BY DISPLAY SIZE 2020–2028, ($MILLION)
TABLE 38.EUROPE SMART DISPLAY MARKET, BY RESOLUTION, 2020–2028($MILLION)
TABLE 39.EUROPE SMART DISPLAY MARKET, BY END USE, 2020–2028($MILLION)
TABLE 40.UKSMART DISPLAY MARKET, BY TYPE 2020–2028($MILLION)
TABLE 41.UKSMART DISPLAY MARKET, BY RESOLUTION, 2020–2028 ($MILLION)
TABLE 42.UKSMART DISPLAY MARKET, BY DISPLAY SIZE 2020–2028 ($MILLION)
TABLE 43.UKSMART DISPLAY MARKET, BY END USE, 2020–2028 ($MILLION)
TABLE 44.GERMANYSMART DISPLAY MARKET, BY TYPE 2020–2028($MILLION)
TABLE 45.GERMANYSMART DISPLAY MARKET, BY RESOLUTION, 2020–2028 ($MILLION)
TABLE 46.GERMANYSMART DISPLAY MARKET, BY DISPLAY SIZE 2020–2028 ($MILLION)
TABLE 47.GERMANYSMART DISPLAY MARKET, BY END USE, 2020–2028 ($MILLION)
TABLE 48.FRANCESMART DISPLAY MARKET, BY TYPE 2020–2028($MILLION)
TABLE 49.FRANCESMART DISPLAY MARKET, BY RESOLUTION, 2020–2028 ($MILLION)
TABLE 50.FRANCESMART DISPLAY MARKET, BY DISPLAY SIZE 2020–2028 ($MILLION)
TABLE 51.FRANCESMART DISPLAY MARKET, BY END USE, 2020–2028 ($MILLION)
TABLE 52.ITALYSMART DISPLAY MARKET, BY TYPE 2020–2028($MILLION)
TABLE 53.ITALYSMART DISPLAY MARKET, BY RESOLUTION, 2020–2028 ($MILLION)
TABLE 54.ITALYSMART DISPLAY MARKET, BY DISPLAY SIZE 2020–2028 ($MILLION)
TABLE 55.ITALYSMART DISPLAY MARKET, BY END USE, 2020–2028 ($MILLION)
TABLE 56.REST OF EUROPESMART DISPLAY MARKET, BY TYPE 2020–2028($MILLION)
TABLE 57.REST OF EUROPESMART DISPLAY MARKET, BY RESOLUTION, 2020–2028 ($MILLION)
TABLE 58.REST OF EUROPESMART DISPLAY MARKET, BY DISPLAY SIZE 2020–2028 ($MILLION)
TABLE 59.REST OF EUROPESMART DISPLAY MARKET, BY END USE, 2020–2028 ($MILLION)
TABLE 60.ASIA-PACIFIC SMART DISPLAYMARKET, BY TYPE 2020–2028 ($MILLION)
TABLE 61.ASIA-PACIFIC SMART DISPLAY MARKET, BY DISPLAY SIZE 2020–2028, ($MILLION)
TABLE 62.ASIA-PACIFIC SMART DISPLAY MARKET, BY RESOLUTION, 2020–2028($MILLION)
TABLE 63.ASIA-PACIFIC SMART DISPLAY MARKET, BY END USE, 2020–2028($MILLION)
TABLE 64.CHINASMART DISPLAY MARKET, BY TYPE 2020–2028($MILLION)
TABLE 65.CHINASMART DISPLAY MARKET, BY RESOLUTION, 2020–2028 ($MILLION)
TABLE 66.CHINASMART DISPLAY MARKET, BY DISPLAY SIZE 2020–2028 ($MILLION)
TABLE 67.CHINASMART DISPLAY MARKET, BY END USE, 2020–2028 ($MILLION)
TABLE 68.JAPANSMART DISPLAY MARKET, BY TYPE 2020–2028($MILLION)
TABLE 69.JAPANSMART DISPLAY MARKET, BY RESOLUTION, 2020–2028 ($MILLION)
TABLE 70.JAPANSMART DISPLAY MARKET, BY DISPLAY SIZE 2020–2028 ($MILLION)
TABLE 71.JAPANSMART DISPLAY MARKET, BY END USE, 2020–2028 ($MILLION)
TABLE 72.INDIASMART DISPLAY MARKET, BY TYPE 2020–2028($MILLION)
TABLE 73.INDIASMART DISPLAY MARKET, BY RESOLUTION, 2020–2028 ($MILLION)
TABLE 74.INDIA SMART DISPLAY MARKET, BY DISPLAY SIZE 2020–2028 ($MILLION)
TABLE 75.INDIASMART DISPLAY MARKET, BY END USE, 2020–2028 ($MILLION)
TABLE 76.SOUTH KOREASMART DISPLAY MARKET, BY TYPE 2020–2028($MILLION)
TABLE 77.SOUTH KOREASMART DISPLAY MARKET, BY RESOLUTION, 2020–2028 ($MILLION)
TABLE 78.SOUTH KOREASMART DISPLAY MARKET, BY DISPLAY SIZE 2020–2028 ($MILLION)
TABLE 79.SOUTH KOREASMART DISPLAY MARKET, BY END USE, 2020–2028 ($MILLION)
TABLE 80.ASIA-PACIFICSMART DISPLAY MARKET, BY TYPE 2020–2028($MILLION)
TABLE 81.ASIA-PACIFICSMART DISPLAY MARKET, BY RESOLUTION, 2020–2028 ($MILLION)
TABLE 82.ASIA-PACIFICSMART DISPLAY MARKET, BY DISPLAY SIZE 2020–2028 ($MILLION)
TABLE 83.REEST OF ASIA-PACIFICSMART DISPLAY MARKET, BY END USE, 2020–2028 ($MILLION)
TABLE 84.LAMEA SMART DISPLAYMARKET, BY TYPE 2020–2028 ($MILLION)
TABLE 85.LAMEA SMART DISPLAY MARKET, BY DISPLAY SIZE 2020–2028, ($MILLION)
TABLE 86.LAMEA SMART DISPLAY MARKET, BY RESOLUTION, 2020–2028($MILLION)
TABLE 87.LAMEA SMART DISPLAY MARKET, BY END USE, 2020–2028($MILLION)
TABLE 88.LATIN AMERICASMART DISPLAY MARKET, BY TYPE 2020–2028($MILLION)
TABLE 89.LATIN AMERICASMART DISPLAY MARKET, BY RESOLUTION, 2020–2028 ($MILLION)
TABLE 90.LATIN AMERICASMART DISPLAY MARKET, BY DISPLAY SIZE 2020–2028 ($MILLION)
TABLE 91.LATIN AMERICASMART DISPLAY MARKET, BY END USE, 2020–2028 ($MILLION)
TABLE 92.MIDDLE EASTSMART DISPLAY MARKET, BY TYPE 2019–2028($MILLION)
TABLE 93.MIDDLE EASTSMART DISPLAY MARKET, BY RESOLUTION, 2020–2028 ($MILLION)
TABLE 94.MIDDLE EASTSMART DISPLAY MARKET, BY DISPLAY SIZE 2020–2028 ($MILLION)
TABLE 95.MIDDLE EASTSMART DISPLAY MARKET, BY END USE, 2020–2028 ($MILLION)
TABLE 96.AFRICASMART DISPLAY MARKET, BY TYPE 2020–2028($MILLION)
TABLE 97.AFRICASMART DISPLAY MARKET, BY RESOLUTION, 2020–2028 ($MILLION)
TABLE 98.AFRICASMART DISPLAY MARKET, BY DISPLAY SIZE 2020–2028 ($MILLION)
TABLE 99.AFRICASMART DISPLAY MARKET, BY END USE, 2020–2028 ($MILLION)
TABLE 100.ALPS ALPINE CO., LTD.:KEY EXECUTIVES
TABLE 101.ALPS ALPINE CO., LTD.: COMPANY SNAPSHOT
TABLE 102.ALPS ALPINE CO., LTD.: OPERATING SEGMENTS
TABLE 103.ALPS ALPINE CO., LTD.: PRODUCT PORTFOLIO
TABLE 104.ALPS ALPINE CO., LTD.: KEY STRATEGIC MOVES AND DEVELOPMENTS
TABLE 105.ALPHABET INC.:KEY EXECUTIVES
TABLE 106.ALPHABET INC.: COMPANY SNAPSHOT
TABLE 107.ALPHABET INC.: OPERATING SEGMENTS
TABLE 108.ALPHABET INC.: PRODUCT PORTFOLIO
TABLE 109.ALPHABET INC.: KEY STRATEGIC MOVES AND DEVELOPMENTS
TABLE 110.JDI:KEY EXECUTIVES
TABLE 111.JDI: COMPANY SNAPSHOT
TABLE 112.JDI: OPERATING SEGMENTS
TABLE 113.JDI: PRODUCT PORTFOLIO
TABLE 114.JDI: KEY STRATEGIC MOVES AND DEVELOPMENTS
TABLE 115.LEYARD OPTOELECTRONIC CO., LTD.:KEY EXECUTIVES
TABLE 116.LEYARD OPTOELECTRONIC CO., LTD.: COMPANY SNAPSHOT
TABLE 117.LEYARD OPTOELECTRONIC CO., LTD.: OPERATING SEGMENTS
TABLE 118.LEYARD OPTOELECTRONIC CO., LTD.: PRODUCT PORTFOLIO
TABLE 119.LEYARD OPTOELECTRONIC CO., LTD.: KEY STRATEGIC MOVES AND DEVELOPMENTS
TABLE 120.LG ELECTRONICS INC.:KEY EXECUTIVES
TABLE 121.LG ELECTRONICS INC.: COMPANY SNAPSHOT
TABLE 122.LG ELECTRONICS INC.: OPERATING SEGMENTS
TABLE 123.LG ELECTRONICS INC.: PRODUCT PORTFOLIO
TABLE 124.LG ELECTRONICS INC.: KEY STRATEGIC MOVES AND DEVELOPMENTS
TABLE 125.MAGNA INTERNATIONAL INC.:KEY EXECUTIVES
TABLE 126.MAGNA INTERNATIONAL INC.: COMPANY SNAPSHOT
TABLE 127.MAGNA INTERNATIONAL INC.: OPERATING SEGMENTS
TABLE 128.MAGNA INTERNATIONAL INC.: PRODUCT PORTFOLIO
TABLE 129.MAGNA INTERNATIONAL INC.: KEY STRATEGIC MOVES AND DEVELOPMENTS
TABLE 130.PANASONIC CORPORATION:KEY EXECUTIVES
TABLE 131.PANASONIC CORPORATION: COMPANY SNAPSHOT
TABLE 132.PANASONIC CORPORATION: PRODUCT CATEGORY
TABLE 133.PANASONIC CORPORATION: PRODUCT PORTFOLIO
TABLE 134.PANASONIC CORPORATION: KEY STRATEGIC MOVES AND DEVELOPMENTS
TABLE 135.SAMSUNG:KEY EXECUTIVES
TABLE 136.SAMSUNG: COMPANY SNAPSHOT
TABLE 137.SAMSUNG: OPERATING SEGMENTS
TABLE 138.SAMSUNG: PRODUCT PORTFOLIO
TABLE 139.SAMSUNG: KEY STRATEGIC MOVES AND DEVELOPMENTS
TABLE 140.SHARP CORPORATION:KEY EXECUTIVES
TABLE 141.SHARP CORPORATION: COMPANY SNAPSHOT
TABLE 142.SHARP CORPORATION: OPERATING SEGMENTS
TABLE 143.SHARP CORPORATION: PRODUCT PORTFOLIO
TABLE 144.SHARP CORPORATION: KEY STRATEGIC MOVES AND DEVELOPMENTS
TABLE 145.SONY CORPORATION: KEY EXECUTIVES
TABLE 146.SONY CORPORATION: COMPANY SNAPSHOT
TABLE 147.SONY CORPORATION: OPERATING SEGMENTS
TABLE 148.SONY CORPORATION: PRODUCT PORTFOLIO
TABLE 149.SONY CORPORATION: KEY STRATEGIC MOVES AND DEVELOPMENTS
LIST OF FIGURES
FIGURE 01.KEY MARKET SEGMENTS
FIGURE 02.EXECUTIVE SUMMARY
FIGURE 03.EXECUTIVE SUMMARY
FIGURE 04.TOP IMPACTING FACTORS
FIGURE 05.TOP INVESTMENT POCKETS
FIGURE 06.MODERATE BARGAINING POWER OF SUPPLIERS
FIGURE 07.MODERATE THREAT OF NEW ENTRANTS
FIGURE 08.MODERATE TO HIGH THREAT OF SUBSTITUTES
FIGURE 09.MODERATE INTENSITY OF RIVALRY
FIGURE 10.HIGH BARGAINING POWER OF BUYERS
FIGURE 11.PATENT ANALYSIS, BY REGION
FIGURE 12.PATENT ANALYSIS, BY APPLICANT
FIGURE 13.SMART DISPLAY MARKET, BY TYPE, 2020-2028 (%)
FIGURE 14.COMPARATIVE SHARE ANALYSIS OF SIGNAGE SMART DISPLAY MARKET, BY COUNTRY, 2020 & 2028 (%)
FIGURE 15.COMPARATIVE SHARE ANALYSIS OF HOME DISPLAYSMART DISPLAY MARKET, BY COUNTRY, 2020 & 2028 (%)
FIGURE 16.COMPARATIVE SHARE ANALYSIS OF SMART MIRRORSMART DISPLAY MARKET, BY COUNTRY, 2020 & 2028 (%)
FIGURE 17.SMART DISPLAY MARKET, BY DISPLAY SIZE, 2020-2028 (%)
FIGURE 18.COMPARATIVE SHARE ANALYSIS OF ABOVE 32 INCHSMART DISPLAY MARKET, BY COUNTRY, 2019 &2028 (%)
FIGURE 19.COMPARATIVE SHARE ANALYSIS OF BETWEEN 32 AND 52 INCHESSMART DISPLAY MARKET, BY COUNTRY, 2020 & 2028 (%)
FIGURE 20.COMPARATIVE SHARE ANALYSIS OF ABOVE 32 INCHSMART DISPLAY MARKET, BY COUNTRY, 2020 & 2028 (%)
FIGURE 21.SMART DISPLAY MARKET, BY RESOLUTION, 2020-2028 (%)
FIGURE 22.COMPARATIVE SHARE ANALYSIS OF FHDSMART DISPLAY MARKET, BY COUNTRY, 2020 & 2028 (%)
FIGURE 23.COMPARATIVE SHARE ANALYSIS OF HDSMART DISPLAY MARKET, BY COUNTRY, 2020 & 2028 (%)
FIGURE 24.COMPARATIVE SHARE ANALYSIS OF UHDSMART DISPLAY MARKET, BY COUNTRY, 2020 &2028 (%)
FIGURE 25.SMART DISPLAY MARKET, BY END-USER, 2020-2028 (%)
FIGURE 26.COMPARATIVE SHARE ANALYSIS OF AUTOMOTIVESMART DISPLAY MARKET, BY COUNTRY, 2020 &2028 (%)
FIGURE 27.COMPARATIVE SHARE ANALYSIS OF RESIDENTIALSMART DISPLAY MARKET, BY COUNTRY, 2020 &2028 (%)
FIGURE 28.COMPARATIVE SHARE ANALYSIS OF RETAILSMART DISPLAY MARKET, BY COUNTRY, 2020 &2028 (%)
FIGURE 29.COMPARATIVE SHARE ANALYSIS OF HEALTHCARESMART DISPLAY MARKET, BY COUNTRY, 2020 &2028 (%)
FIGURE 30.COMPARATIVE SHARE ANALYSIS OF SPORT & ENTERTAINMENTSMART DISPLAY MARKET, BY COUNTRY, 2020 &2028 (%)
FIGURE 31.SMART DISPLAY MARKET, BY REGION, 2020-2028
FIGURE 32.NORTH AMERICA SMART DISPLAY MARKET, BY COUNTRY, 2020-2028
FIGURE 33.U.S. SMART DISPLAY MARKET, 2020-2028($MILLION)
FIGURE 34.CANADA SMART DISPLAY MARKET, 2020-2028($MILLION)
FIGURE 35.MEXICOSMART DISPLAY MARKET, 2020-2028($MILLION)
FIGURE 36.EUROPESMART DISPLAY MARKET, BY COUNTRY, 2020-2028
FIGURE 37.UK. SMART DISPLAY MARKET, 2020-2028($MILLION)
FIGURE 38.GERMANYSMART DISPLAY MARKET, 2020-2028($MILLION)
FIGURE 39.FRANCESMART DISPLAY MARKET, 2020-2028($MILLION)
FIGURE 40.ITALY SMART DISPLAY MARKET, 2020-2028($MILLION)
FIGURE 41.REST OF EUROPESMART DISPLAY MARKET, 2020-2028($MILLION)
FIGURE 42.ASIA-PACIFICSMART DISPLAY MARKET, BY COUNTRY, 2020-2028
FIGURE 43.CHINASMART DISPLAY MARKET, 2020-2028($MILLION)
FIGURE 44.JAPANSMART DISPLAY MARKET, 2020-2028($MILLION)
FIGURE 45.INDIASMART DISPLAY MARKET, 2020-2028($MILLION)
FIGURE 46.SOUTH KOREA SMART DISPLAY MARKET, 2020-2028($MILLION)
FIGURE 47.REST OF ASIA-PACIFICSMART DISPLAY MARKET, 2020-2028($MILLION)
FIGURE 48.LAMEASMART DISPLAY MARKET, BY COUNTRY, 2020-2028
FIGURE 49.LATIN AMERICA SMART DISPLAY MARKET, 2020-2028($MILLION)
FIGURE 50.MIDDLE EAST SMART DISPLAY MARKET, 2020-2028($MILLION)
FIGURE 51.AFRICA SMART DISPLAY MARKET, 2020-2028($MILLION)
FIGURE 52.TOP WINNING STRATEGIES, BY YEAR, 2018–2021
FIGURE 53.TOP WINNING STRATEGIES, BY DEVELOPMENT, 2018–2021 (%)
FIGURE 54.TOP WINNING STRATEGIES, BY COMPANY, 2018–2021
FIGURE 55.PRODUCT MAPPING OF TOP 10 PLAYERS
FIGURE 56.COMPETITIVE HEATMAP OF KEY PLAYERS
FIGURE 57.COMPETITIVE DASHBOARD OF KEY PLAYERS
FIGURE 58.ALPS ALPINE CO., LTD.: R&D EXPENDITURE, 2018–2020 ($MILLION)
FIGURE 59.ALPS ALPINE CO., LTD.: REVENUE, 2018–2020 ($MILLION)
FIGURE 60.ALPS ALPINE CO., LTD.: REVENUE SHARE, BY SEGMENT, 2020 (%)
FIGURE 61.ALPS ALPINE CO., LTD.: REVENUE SHARE, BY REGION, 2020 (%)
FIGURE 62.ALPHABET INC.: R&D EXPENDITURE, 2018–2020 ($MILLION)
FIGURE 63.ALPHABET INC.: NET SALES, 2018–2020 ($MILLION)
FIGURE 64.ALPHABET INC.: REVENUE SHARE BY SEGMENT, 2020 (%)
FIGURE 65.ALPHABET INC.: REVENUE SHARE, BY REGION, 2020 (%)
FIGURE 66.JDI: R&D EXPENDITURE, 2017–2019 ($MILLION)
FIGURE 67.JDI: REVENUE, 2017–2019 ($MILLION)
FIGURE 68.LEYARD OPTOELECTRONIC CO., LTD.: REVENUE, 2018–2020 ($MILLION)
FIGURE 69.LG ELECTRONICS INC.: R&D EXPENDITURE, 2018–2020 ($MILLION)
FIGURE 70.LG ELECTRONICS INC.: REVENUE, 2018–2020 ($MILLION)
FIGURE 71.LG ELECTRONICS INC.: REVENUE SHARE, BY SEGMENT, 2020 (%)
FIGURE 72.LG ELECTRONICS INC.: REVENUE SHARE, BY REGION, 2020 (%)
FIGURE 73.MAGNA INTERNATIONAL INC.: R&D EXPENDITURE, 2018–2020 ($MILLION)
FIGURE 74.MAGNA INTERNATIONAL INC.: REVENUE, 2018–2020 ($MILLION)
FIGURE 75.MAGNA INTERNATIONAL INC.: REVENUE SHARE, BY SEGMENT, 2020 (%)
FIGURE 76.MAGNA INTERNATIONAL INC.: REVENUE SHARE, BY REGION, 2020 (%)
FIGURE 77.PANASONIC CORPORATION: R&D EXPENDITURE, 2018–2020 ($MILLION)
FIGURE 78.PANASONIC CORPORATION: REVENUE, 2018–2020 ($MILLION)
FIGURE 79.PANASONIC CORPORATION: REVENUE SHARE, BY SEGMENT, 2020 (%)
FIGURE 80.PANASONIC CORPORATION: REVENUE SHARE, BY REGION, 2020 (%)
FIGURE 81.SAMSUNG: R&D EXPENDITURE, 2018–2020 ($MILLION)
FIGURE 82.SAMSUNG: NET SALES, 2018–2020 ($MILLION)
FIGURE 83.SAMSUNG: REVENUE SHARE, BY SEGMENT, 2020 (%)
FIGURE 84.SAMSUNG: REVENUE SHARE, BY REGION, 2020 (%)
FIGURE 85.SHARP CORPORATION: R&D EXPENDITURE, 2018–2020 ($MILLION)
FIGURE 86.SHARP CORPORATION: REVENUE, 2018–2020 ($MILLION)
FIGURE 87.SHARP CORPORATION: REVENUE SHARE, BY SEGMENT, 2020 (%)
FIGURE 88.SHARP CORPORATION: REVENUE SHARE, BY REGION, 2020 (%)
FIGURE 89.SONY CORPORATION: R&D EXPENDITURE, 2018–2020 ($MILLION)
FIGURE 90.SONY CORPORATION: REVENUE, 2018–2020 ($MILLION)
FIGURE 91.SONY CORPORATION: REVENUE SHARE, BY SEGMENT, 2020 (%)
FIGURE 92.SONY CORPORATION: REVENUE SHARE, BY REGION, 2020 (%)
Smart display is a digital screen designed to use around the home, retail, and automotive sectors for digital communication, which sometimes also includes a sizable touch screen. Further, the home display devices can be for more than just control but support entertainment, video chats, information videos, and control other smart applications inside homes.
Smart display is popular for use in retail sectors for digital communication and can be programmed, scheduled as per user preferences, especially with set daily routines to display images and videos information. Moreover, smart display application such as home display has advance features such as Bluetooth speaker with screen to make it more user friendly. These devices can be easily installed by consumers and are compatible with wide range of smart electronic appliances.
Globally, various key players are investing in smart display application to make them compatible with various industrial platforms. For instance, Leyard launched a new 216-inch, 8k video wall with 0.6 mm fine pitch suitable for digital communication across retail, healthcare, automotive, and other sectors. In addition, LG Electronics has launched new three series of outdoor LED displays with a pixel compatible of all weathers.
The key players profiled in the report include Samsung, LG Electronics, Alphabet (Google LLC), Panasonic Corporation, Japan Display Inc., Sony, Alpine Electronics, Sharp Corporation, Leyard Optoelectronic, and Manga International Inc.
A. The Smart Display Market is estimated to grow at a CAGR of 21.6% from 2021 to 2028.
A. The Smart Display Market is projected to reach $18.25 billion by 2028.
A. To get the latest version of sample report
A. Factors such as increase in apid adoption of artificial intelligence and Internet of Thing enabled smart applications in commercial, residential, and industrial sectors and surge in demand for smart mirror in the automotive industry
A. The key players profiled in the report include Samsung, LG Electronics, Alphabet (Google LLC), Panasonic Corporation, Japan Display Inc., Sony, Alpine Electronics, Sharp Corporation, Leyard Optoelectronic, and Manga International Inc and many more.
A. On the basis of top growing big corporations, we select top 10 players.
A. The smart display market is segmented on the basis of type, resolution, display size, end user and region.
A. The key growth strategies of Smart Display market players include product portfolio expansion, mergers & acquisitions, agreements, geographical expansion, and collaborations.
A. UHD Segment holds a dominant position throughout the forecast period.
A. Healthcare segment will grow at a highest CAGR of 25% during 2021 - 2028
Start reading instantly.
This Report and over 13,000+ thousand more Reports, Available with Avenue Library. T&C*.
Enterprise
License/PDF
*Taxes/Fees, if applicable will be added during checkout. All prices in USD
To ensure high-level data integrity, accurate analysis, and impeccable forecasts
For complete satisfaction
On-demand customization of scope of the report to exactly meet your needs
Targeted market view to provide pertinent information and save time of readers
Get insights on topics that are crucial for your business. Stay abreast of your interest areas.
To ensure high-level data integrity, accurate analysis, and impeccable forecasts
For complete satisfaction
On-demand customization of scope of the report to exactly meet your needs
Targeted market view to provide pertinent information and save time of readers