0
2021
Smart Irrigation Market

Smart Irrigation Market

By Type (Climate Based and Sensor Based) Component (Controllers, Sensors, Meters, and Others), and End Use (Agriculture, Golf Course, Residential, and Others): Global Opportunity Analysis and Industry Forecast, 2021-2030

Report Code: A02219
Jul 2021 | Pages: 256
Tables: 115
Charts: 61
  • Formats*:

  • pdf

    Single User License, Five User
    License & Enterprise User License

  • xls

    Data Pack Excel License

  • ppt

    It comes with the additional cost
    of $2500.00 contact sales.


COVID-19

Pandemic disrupted the entire world and affected many industries.

Get detailed COVID-19 impact analysis on the Smart Irrigation Market

Request Now !

Smart Irrigation Market Outlook - 2030

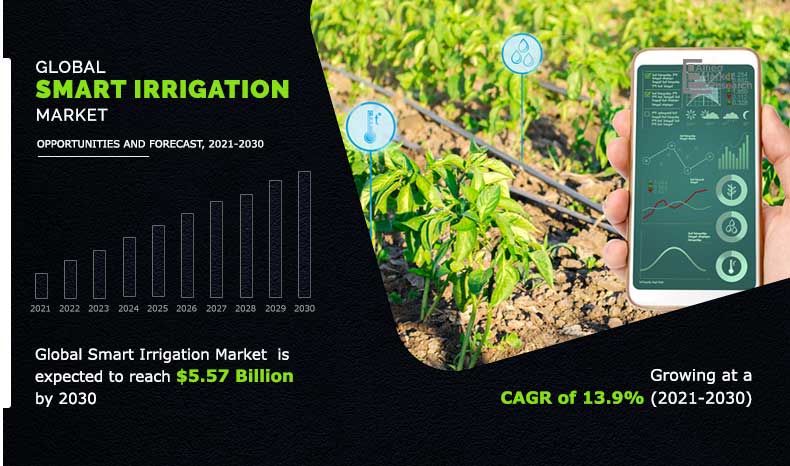
The global smart irrigation market size was valued at $1.44 billion in 2020, and is projected to reach $5.57 billion by 2030, growing at a CAGR of 13.9% from 2021 to 2030.

The emergence of COVID 19 has declined the growth of Smart Irrigation market in 2020 and is estimated to witness slow growth till the end of 2021 due to implementation of partial and complete lockdown across various countries globally as it has impacted the manufacturing and industrial sector.

Smart irrigation system are a combination of an advanced technology and are the key component of precision agriculture. These help monitor weather, soil conditions, and plant water use to automatically adjust the watering schedule. These systems are used in agriculture, golf course, and residential sectors. 

Global-Smart-Irrigation-Market

Availability of advanced features in irrigation system, increase in government initiatives and policies to promote water conservation & farming, and rise in penetration of automated monitoring systems in the farming sector drive the growth of the smart irrigation systems market trends. 

Smart Irrigation Market
By Type

Your browser does not support the canvas element.

Sensor Based segment will grow at a highest CAGR of 14.9% during 2021 - 2030

Get more information on this report : Request Sample Pages

However, high initial investment and maintenance cost and lack of skilled workforce in the developing regions for operating the technology are expected to pose major threats for the smart irrigation market analysis. Furthermore, the surge in demand for 5G network for remote monitoring and rise in adoption of smart technologies and smart infrastructures among regions are expected to offer lucrative opportunities for the global smart irrigation market growth.

Increase in competition and low awareness among small scale manufactures are the key factors that hamper the growth of the smart irrigation market forecast. Rise in awareness for need of smart irrigation and surge in need of water conservation are the factors providing lucrative smart irrigation market opportunity globally.

Segment Overview 

The smart irrigation market share is segmented on the basis of type, component, end use and region. By type, the market is bifurcated into climate based and sensor based.  By component the market is segmented into controllers, sensors, meters and others. By end use, the market is analyzed across agriculture (conventional method, farming, and greenhouse), residential and others. Region-wise, the market is studied across North America, Europe, Asia-Pacific, and LAMEA along with their prominent countries.

Smart Irrigation Market
By Component

Your browser does not support the canvas element.

Sensors segment is projected as one of the most lucrative segments.

Get more information on this report : Request Sample Pages

Competitive Analysis

The key players profiled in the smart irrigation industry include Rain Bird Corporation, The Toro Company, Hunter Industries, CALSENSE, ET Water Systems, Inc., HydroPoint Data Systems, Weathermatic, Rachio inc., Stevens Water Monitoring System, Orbit Irrigation Products Inc. These key players have adopted strategies, such as product portfolio expansion, mergers & acquisitions, agreements, regional expansion, and collaborations, to enhance their market penetration.

COVID-19 Impact Analysis

The ongoing spread of COVID-19 has become one of the biggest threats to the global economy and is causing widespread concerns and economic hardship for consumers, businesses, and communities across the globe. The “new normal” that includes social distancing and working from home has created challenges with daily activities, regular work, needs, and supplies, causing delayed initiatives and missed opportunities.

The COVID-19 pandemic is impacting the society and overall economy across the globe. The impact of this outbreak is growing day-by-day as well as affecting the supply chain. This creates uncertainty in the stock market, decreases business confidence, slows supply chain, and increases panic among customers. European countries under lockdown have suffered a major loss of business and revenue due to shutdown of manufacturing units in the region. Operations of production and manufacturing industries have been heavily impacted by the outbreak of COVID-19, which led to slowdown in growth of the market outlook in 2020.

According to the smart irrigation market trends, the COVID-19 pandemic has severely impacted the global manufacturing and industrial sectors as production facilities have stalled, which, in turn, led to significant demand in industries.

Smart Irrigation Market
By End Use

Your browser does not support the canvas element.

Agriculture Segment holds a dominant position throughout the forecast period.

Get more information on this report : Request Sample Pages

The emergence of COVID-19 has declined the growth of the smart irrigation market in 2020, and is estimated to witness slow growth till the end of 2021. Implementation of partial or complete lockdown across various countries globally is the prime reason for decline in growth rate. As industries were temporarily shut, it reduced the need for maintenance from various industries.

Top Impacting Factors

Notable factors positively affecting the growth of the smart irrigation market include the growing advanced features in irrigation system, increasing government initiatives and policies to promote water conservation & farming and increasing penetration of automated monitoring systems in the farming sector. However, high initial investment and maintenance cost and lack of skilled workforce in developing regions for operating the technology are expected to pose major threats for the growth of the smart irrigation market. Furthermore, the surge in demand for 5G network for remote monitoring and rise in adoption of smart technologies and smart infrastructures among regions are expected to offer lucrative opportunities for the market growth in the coming years.

Availability of Advanced Features in Irrigation System 

Smart irrigation systems are used in agriculture, golf course, residential, and other sectors. Smart irrigation system with IoT technology helps in water level detection, as it automatically irrigates the water based on the moisture level in the soil, and also helps keep track of the land condition. The rise in demand for IoT and cloud technology is attributed to increased demand for smart irrigation, which, in turn, drives the market growth.

High Initial Investment and Maintenance Cost 

Smart irrigation system is equipped with IoT technology, automotive system, and sensors. This increases its cost. In addition, the installation and maintenance costs of these systems are high. These factors majorly hamper the growth of the smart irrigation market.

Smart Irrigation Market
By Region

2030
Asia-pacific 
North America
Europe
LAMEA

Asia-Pacific would exhibit the highest CAGR of 17.3% during 2020-2030

Get more information on this report : Request Sample Pages

Key Benefits For Stakeholders

  • This study comprises analytical depiction of the smart irrigation market size along with the current trends and future estimations to depict imminent investment pockets.
  • The overall smart irrigation market analysis is determined to understand the profitable trends to gain a stronger foothold. 
  • The report presents information related to key drivers, restraints, and opportunities with a detailed impact analysis.
  • The present smart irrigation market forecast is quantitatively analyzed from 2020 to 2028 to benchmark the financial competency. 
  • Porter’s five forces analysis illustrates the potency of the buyers and the sensor market share of key vendors.
  • The report includes the market trends and the smart irrigation market share of key vendors.

Key Market Segments

By Type

  • Climate-based
  • Sensor-based

By Component

  • Controllers
  • Sensors
  • Meters
  • Others

By End Use

  • Agriculture
  • Golf Course
  • Residential
  • Others

By Region

  • North America
    • U.S.
    • Canada
    • Mexico
  • Europe 
    • UK
    • Germany
    • France
    • Italy
    • Rest of Europe
  • Asia-Pacific
    • China
    • Japan
    • India
    • Singapore
    • Rest of Asia-Pacific
  • LAMEA
    • Latin America
    • Middle East
    • Africa

Smart Irrigation Market Report Highlights

Aspects Details
By TYPE
  • CLIMATE BASED
  • SENSOR BASED
By COMPONENT
  • CONTROLLERS
  • SENSORS
  • OTHERS
By END USER
  • AGRICULTURE
  • GOLF COURSE
  • RESIDENTIAL
  • OTHERS
By Region
  • North America  (U.S., Canada, Mexico)
  • Europe  (France, Germany, Italy, Spain, UK, Russia, Rest of Europe)
  • Asia-Pacific  (China, Japan, India, South Korea, Australia, Thailand, Malaysia, Indonesia, Rest of Asia-Pacific)
  • LAMEA  (Brazil, South Africa, Saudi Arabia, UAE, Argentina, Rest of LAMEA)
Key Market Players WEATHERMATIC, ORBIT IRRIGATION PRODUCTS LLC (PLATINUM EQUITY), CALSENSE, HYDROPOINT DATA SYSTEMS, INC., RAIN BIRD CORPORATION, STEVENS WATER MONITORING SYSTEMS INC., RACHIO, INC., HUNTER INDUSTRIES, INC., THE TORO COMPANY, ET WATER SYSTEMS, INC. (JAIN IRRIGATION SYSTEMS LTD.)
 

CHAPTER 1:INTRODUCTION

1.1.REPORT DESCRIPTION
1.2.KEY BENEFITS FOR STAKEHOLDERS
1.3.KEY MARKET SEGMENTS
1.4.RESEARCH METHODOLOGY

1.4.1.PRIMARY RESEARCH
1.4.2.SECONDARY RESEARCH
1.4.3.ANALYST TOOLS AND MODELS

CHAPTER 2:EXECUTIVE SUMMARY

2.1.KEY FINDINGS

2.1.1.TOP IMPACTING FACTORS
2.1.2.TOP INVESTMENT POCKETS

2.2.CXO PERSPECTIVE

CHAPTER 3:MARKET OVERVIEW

3.1.MARKET DEFINITION AND SCOPE
3.2.PORTER’S FIVE FORCES ANALYSIS
3.3.PATENT ANALYSIS

3.3.1.BY REGION (2020-2030)
3.3.2.BY APPLICANT

3.4.MARKET DYNAMICS

3.4.1.DRIVERS

3.4.1.1.THE GROWING ADVANCED FEATURES IN IRRIGATION SYSTEM.
3.4.1.2.INCREASING GOVERNMENT INITIATIVES AND POLICIES TO PROMOTE WATER CONSERVATION AND FARMING.
3.4.1.3.INCREASING PENETRATION OF AUTOMATED MONITORING SYSTEMS IN THE FARMING SECTOR.

3.4.2.RESTRAINTS

3.4.2.1.HIGH INITIAL INVESTMENT AND MAINTENANCE COST.
3.4.2.2.LACK OF SKILLED WORKFORCE IN DEVELOPING REGIONS FOR OPERATING THE TECHNOLOGY.

3.4.3.OPPORTUNITY

3.4.3.1.GROWING DEMAND FOR 5G NETWORK FOR REMOTE MONITORING.
3.4.3.2.GROWING ADOPTION OF SMART TECHNOLOGIES AND SMART INFRASTRUCTURES AMONG REGIONS.

3.5.COVID IMPACT

3.5.1.IMPACT ON MARKET SIZE
3.5.2.END USER TRENDS, PREFERENCES, AND BUDGET IMPACT
3.5.3.END USER TRENDS, PREFERENCES, AND BUDGET IMPACT
3.5.4.PARENT INDUSTRY IMPACT
3.5.5.KEY PLAYER STRATEGIES TO TACKLE NEGATIVE IMPACT

3.5.5.1.LIMITING CUTS TO R&D EXPENSE:
3.5.5.2.FOCUSING ON NEXT-GENERATION PRODUCTS
3.5.5.3.SHIFTING TOWARD AGILE SUPPLY CHAIN MODEL
3.5.6.OPPORTUNITY WINDOW

CHAPTER 4:SMART IRRIGATION MARKET, BY TYPE

4.1.OVERVIEW
4.2.CLIMATE BASED

4.2.1.KEY MARKET TRENDS, GROWTH FACTORS, AND OPPORTUNITIES
4.2.2.MARKET SIZE AND FORECAST, BY REGION
4.2.3.MARKET ANALYSIS, BY COUNTRY

4.3.SENSOR BASED

4.3.1.KEY MARKET TRENDS, GROWTH FACTORS, AND OPPORTUNITIES
4.3.2.MARKET SIZE AND FORECAST, BY REGION
4.3.3.MARKET ANALYSIS, BY COUNTRY

CHAPTER 5:SMART IRRIGATION MARKET, BY COMPONENT

5.1.OVERVIEW
5.2.CONTROLLERS

5.2.1.KEY MARKET TRENDS, GROWTH FACTORS, AND OPPORTUNITIES
5.2.2.MARKET SIZE AND FORECAST, BY REGION
5.2.3.MARKET ANALYSIS, BY COUNTRY

5.3.SENSORS

5.3.1.KEY MARKET TRENDS, GROWTH FACTORS, AND OPPORTUNITIES
5.3.2.MARKET SIZE AND FORECAST, BY REGION
5.3.3.MARKET ANALYSIS, BY COUNTRY

5.4.OTHERS

5.4.1.KEY MARKET TRENDS, GROWTH FACTORS, AND OPPORTUNITIES
5.4.2.MARKET SIZE AND FORECAST, BY REGION
5.4.3.MARKET ANALYSIS, BY COUNTRY

CHAPTER 6:SMART IRRIGATION MARKET, BY  END USER

6.1.OVERVIEW
6.2.AGRICULTURE

6.2.1.KEY MARKET TRENDS, GROWTH FACTORS, AND OPPORTUNITIES
6.2.2.MARKET SIZE AND FORECAST, BY REGION
6.2.3.MARKET ANALYSIS, BY COUNTRY

6.3.GOLF COURSE

6.3.1.KEY MARKET TRENDS, GROWTH FACTORS, AND OPPORTUNITIES
6.3.2.MARKET SIZE AND FORECAST, BY REGION
6.3.3.MARKET ANALYSIS, BY COUNTRY

6.4.RESIDENTIAL

6.4.1.KEY MARKET TRENDS, GROWTH FACTORS, AND OPPORTUNITIES
6.4.2.MARKET SIZE AND FORECAST, BY REGION
6.4.3.MARKET ANALYSIS, BY COUNTRY

6.5.OTHERS

6.5.1.KEY MARKET TRENDS, GROWTH FACTORS, AND OPPORTUNITIES
6.5.2.MARKET SIZE AND FORECAST, BY REGION
6.5.3.MARKET ANALYSIS, BY COUNTRY

CHAPTER 7:SMART IRRIGATION MARKET, BY REGION

7.1.OVERVIEW
7.2.NORTH AMERICA

7.2.1.KEY MARKET TRENDS, GROWTH FACTORS, AND OPPORTUNITIES
7.2.2.MARKET SIZE AND FORECAST, BY TYPE
7.2.3.MARKET SIZE AND FORECAST, BY COMPONENT
7.2.4.MARKET SIZE AND FORECAST, BY END USE
7.2.5.MARKET ANALYSIS, BY COUNTRY

7.2.5.1.U.S.

7.2.5.1.1.MARKET SIZE AND FORECAST, BY TYPE
7.2.5.1.2.MARKET SIZE AND FORECAST, BY COMPONENT
7.2.5.1.3.MARKET SIZE AND FORECAST, BY END USE

7.2.5.2.CANADA

7.2.5.2.1.MARKET SIZE AND FORECAST, BY TYPE
7.2.5.2.2.MARKET SIZE AND FORECAST, BY COMPONENT
7.2.5.2.3.MARKET SIZE AND FORECAST, BY END USE

7.2.5.3.MEXICO

7.2.5.3.1.MARKET SIZE AND FORECAST, BY TYPE
7.2.5.3.2.MARKET SIZE AND FORECAST, BY COMPONENT
7.2.5.3.3.MARKET SIZE AND FORECAST, BY END USE

7.3.EUROPE

7.3.1.KEY MARKET TRENDS, GROWTH FACTORS, AND OPPORTUNITIES
7.3.2.MARKET SIZE AND FORECAST, BY TECHNOLOGY
7.3.3.MARKET SIZE AND FORECAST, BY COMPONENT
7.3.4.MARKET SIZE AND FORECAST, BY END USE
7.3.5.MARKET ANALYSIS, BY COUNTRY

7.3.5.1.UK

7.3.5.1.1.MARKET SIZE AND FORECAST, BY TYPE
7.3.5.1.2.MARKET SIZE AND FORECAST, BY COMPONENT
7.3.5.1.3.MARKET SIZE AND FORECAST, BY END USE

7.3.5.2.GERMANY

7.3.5.2.1.MARKET SIZE AND FORECAST, BY TYPE
7.3.5.2.2.MARKET SIZE AND FORECAST, BY COMPONENT
7.3.5.2.3.MARKET SIZE AND FORECAST, BY END USE

7.3.5.3.FRANCE

7.3.5.3.1.MARKET SIZE AND FORECAST, BY TYPE
7.3.5.3.2.MARKET SIZE AND FORECAST, BY COMPONENT
7.3.5.3.3.MARKET SIZE AND FORECAST, BY END USE

7.3.5.4.REST OF EUROPE

7.3.5.4.1.MARKET SIZE AND FORECAST, BY TYPE
7.3.5.4.2.MARKET SIZE AND FORECAST, BY COMPONENT
7.3.5.4.3.MARKET SIZE AND FORECAST, BY END USE

7.4.ASIA-PACIFIC

7.4.1.KEY MARKET TRENDS, GROWTH FACTORS, AND OPPORTUNITIES
7.4.2.MARKET SIZE AND FORECAST, BY TYPE
7.4.3.MARKET SIZE AND FORECAST, BY COMPONENT
7.4.4.MARKET SIZE AND FORECAST, BY END USE
7.4.5.MARKET ANALYSIS, BY COUNTRY

7.4.5.1.CHINA

7.4.5.1.1.MARKET SIZE AND FORECAST, BY TYPE
7.4.5.1.2.MARKET SIZE AND FORECAST, BY COMPONENT
7.4.5.1.3.MARKET SIZE AND FORECAST, BY END USE

7.4.5.2.JAPAN

7.4.5.2.2.MARKET SIZE AND FORECAST, BY TYPE
7.4.5.2.3.MARKET SIZE AND FORECAST, BY COMPONENT
7.4.5.2.4.MARKET SIZE AND FORECAST, BY END USE

7.4.5.3.INDIA

7.4.5.3.1.MARKET SIZE AND FORECAST, BY TYPE
7.4.5.3.2.MARKET SIZE AND FORECAST, BY COMPONENT
7.4.5.3.3.MARKET SIZE AND FORECAST, BY END USE

7.4.5.4.SINGAPORE

7.4.5.4.2.MARKET SIZE AND FORECAST, BY TYPE
7.4.5.4.3.MARKET SIZE AND FORECAST, BY COMPONENT
7.4.5.4.4.MARKET SIZE AND FORECAST, BY END USE
7.4.5.5.REST OF ASIA-PACIFIC MARKET SIZE AND FORECAST, BY TYPE
7.4.5.5.1.MARKET SIZE AND FORECAST, BY COMPONENT
7.4.5.5.2.MARKET SIZE AND FORECAST, BY END USE

7.5.LAMEA

7.5.1.KEY MARKET TRENDS, GROWTH FACTORS, AND OPPORTUNITIES
7.5.2.MARKET SIZE AND FORECAST, BY TYPE
7.5.3.MARKET SIZE AND FORECAST, BY COMPONENT
7.5.4.MARKET SIZE AND FORECAST, BY END USE
7.5.5.MARKET ANALYSIS, BY COUNTRY

7.5.5.1.LATIN AMERICA

7.5.5.1.1.MARKET SIZE AND FORECAST, BY TYPE
7.5.5.1.2.MARKET SIZE AND FORECAST, BY COMPONENT
7.5.5.1.3.MARKET SIZE AND FORECAST, BY END USE

7.5.5.2.MIDDLE EAST

7.5.5.2.1.MARKET SIZE AND FORECAST, BY  TYPE
7.5.5.2.2.MARKET SIZE AND FORECAST, BY COMPONENT
7.5.5.2.3.MARKET SIZE AND FORECAST, BY END USE

7.5.5.3.AFRICA

7.5.5.3.1.MARKET SIZE AND FORECAST, BY TYPE
7.5.5.3.2.MARKET SIZE AND FORECAST, BY COMPONENT
7.5.5.3.3.MARKET SIZE AND FORECAST, BY END USE

CHAPTER 8:COMPETITIVE LANDSCAPE

8.1.INTRODUCTION

8.1.1.MARKET PLAYER POSITIONING, 2019

8.2.TOP WINNING STRATEGIES

8.2.1.TOP WINNING STRATEGIES, BY YEAR
8.2.2.TOP WINNING STRATEGIES, BY DEVELOPMENT
8.2.3.TOP WINNING STRATEGIES, BY COMPANY

8.3.COMPETITIVE DASHBOARD
8.4.COMPETITIVE HEATMAP

CHAPTER 9:COMPANY PROFILES

9.1.CALSENSE

9.1.1.COMPANY OVERVIEW
9.1.2.KEY EXECUTIVES
9.1.3.COMPANY SNAPSHOT
9.1.4.OPERATING BUSINESS SEGMENTS
9.1.5.PRODUCT PORTFOLIO
9.1.6.KEY STRATEGIC MOVES AND DEVELOPMENTS

9.2.ET WATER SYSTEMS, INC. (JAIN IRRIGATION SYSTEMS LTD.)

9.2.1.COMPANY OVERVIEW
9.2.2.KEY EXECUTIVES
9.2.3.COMPANY SNAPSHOT
9.2.4.OPERATING BUSINESS SEGMENTS
9.2.5.PRODUCT PORTFOLIO
9.2.6.R&D EXPENDITURE
9.2.7.BUSINESS PERFORMANCE
9.2.8.KEY STRATEGIC MOVES AND DEVELOPMENTS

9.3.HUNTER INDUSTRIES, INC.

9.3.1.COMPANY OVERVIEW
9.3.2.KEY EXECUTIVES
9.3.3.COMPANY SNAPSHOT
9.3.4.OPERATING BUSINESS SEGMENTS
9.3.5.PRODUCT PORTFOLIO
9.3.6.KEY STRATEGIC MOVES AND DEVELOPMENTS

9.4.HYDROPOINT DATA SYSTEMS, INC.

9.4.1.COMPANY OVERVIEW
9.4.2.KEY EXECUTIVES
9.4.3.COMPANY SNAPSHOT
9.4.4.OPERATING BUSINESS SEGMENTS
9.4.5.PRODUCT PORTFOLIO
9.4.6.KEY STRATEGIC MOVES AND DEVELOPMENTS

9.5.ORBIT IRRIGATION PRODUCTS LLC (PLATINUM EQUITY)

9.5.1.COMPANY OVERVIEW
9.5.2.KEY EXECUTIVES
9.5.3.COMPANY SNAPSHOT
9.5.4.OPERATING BUSINESS SEGMENTS
9.5.5.PRODUCT PORTFOLIO

9.6.RACHIO, INC.

9.6.1.COMPANY OVERVIEW
9.6.2.KEY EXECUTIVES
9.6.3.COMPANY SNAPSHOT
9.6.4.OPERATING BUSINESS SEGMENTS
9.6.5.PRODUCT PORTFOLIO
9.6.6.KEY STRATEGIC MOVES AND DEVELOPMENTS

9.7.RAIN BIRD CORPORATION

9.7.1.COMPANY OVERVIEW
9.7.2.KEY EXECUTIVES
9.7.3.COMPANY SNAPSHOT
9.7.4.OPERATING BUSINESS SEGMENTS
9.7.5.PRODUCT PORTFOLIO
9.7.6.KEY STRATEGIC MOVES AND DEVELOPMENTS

9.8.STEVENS WATER MONITORING SYSTEMS INC.

9.8.1.COMPANY OVERVIEW
9.8.2.KEY EXECUTIVES
9.8.3.COMPANY SNAPSHOT
9.8.4.OPERATING BUSINESS SEGMENTS
9.8.5.PRODUCT PORTFOLIO

9.9.THE TORO COMPANY

9.9.1.COMPANY OVERVIEW
9.9.2.KEY EXECUTIVES
9.9.3.COMPANY SNAPSHOT
9.9.4.OPERATING BUSINESS SEGMENTS
9.9.5.PRODUCT PORTFOLIO
9.9.6.R&D EXPENDITURE
9.9.7.BUSINESS PERFORMANCE
9.9.8.KEY STRATEGIC MOVES AND DEVELOPMENTS

9.10.WEATHERMATIC

9.10.1.COMPANY OVERVIEW
9.10.2.KEY EXECUTIVES
9.10.3.COMPANY SNAPSHOT
9.10.4.OPERATING BUSINESS SEGMENTS
9.10.5.PRODUCT PORTFOLIO
9.10.6.KEY STRATEGIC MOVES AND DEVELOPMENTS

LIST OF TABLES

TABLE 01.SMART IRRIGATION MARKET SHARE FOR CLIMATE BASED, BY REGION, 2020-2028 ($MILLION)
TABLE 02.SMART IRRIGATTION MARKET SHARE, FOR SENSOR BASED, BY REGION 2020-2028 ($MILLION)
TABLE 03.SMART IRRIGATION SHARE FOR CONTROLLERS, BY REGION, 2020-2030 ($MILLION)
TABLE 04.SMART IRRIGATION  MARKET SHARE, FOR SENSORS, BY REGION 2020-2028 ($MILLION)
TABLE 05.SMART IRRIGATION MARKET  SHARE, FOR OTHERS, BY REGION 2020-2028 ($MILLION)
TABLE 06.SMART IRRIGATION MARKET FOR AGRICULTURE, BY REGION 2020-2028 ($MILLION)
TABLE 07.SMART IRRIGATION MARKET FOR GOLF COURSE, BY REGION 2020-2028 ($MILLION)
TABLE 08.SMART IRRIGATION MARKET FOR RESIDENTIAL, BY REGION 2020-2030 ($MILLION)
TABLE 09.SMART IRRIGATION MARKET FOR OTHERS, BY REGION 2020-2028 ($MILLION)
TABLE 10.SMART IRRIGATION MARKET REVENUE, BY REGION, 2020–2030 ($MILLION)
TABLE 11.NORTH AMERICA SMART IRRIGATION MARKET, BY TYPE, 2020–2030 ($MILLION)
TABLE 12.NORTH AMERICA SMART IRRIGATION MARKET, BY COMPONENT, 2020–2030 ($MILLION)
TABLE 13.NORTH AMERICA SMART IRRIGATION MARKET, BY END USE, 2020–2030 ($MILLION)
TABLE 14.U.S. SMART IRRIGATION MARKET, BY TYPE, 2020–2030 ($MILLION)
TABLE 15.U.S. SMART IRRIGATION MARKET, BY COMPONENT, 2020–2030 ($MILLION)
TABLE 16.U.S. SMART IRRIGATION MARKET, BY END USE, 2020–2030 ($MILLION)
TABLE 17.CANADA SMART IRRIGATION MARKET, BY TYPE, 2020–2030 ($MILLION)
TABLE 18.CANADA SMART IRRIGATION MARKET, BY COMPONENT, 2020–2030 ($MILLION)
TABLE 19.CANADA SMART IRRIGATION MARKET, BY END USE, 2020–2030 ($MILLION)
TABLE 20.SMART IRRIGATION MARKET, BY TYPE, 2020–2030 ($MILLION)
TABLE 21.MEXICO SMART IRRIGATION MARKET, BY COMPONENT, 2020–2030 ($MILLION)
TABLE 22.MEXICO SMART IRRIGATION MARKET, BY END USE, 2020–2030 ($MILLION)
TABLE 23.EUROPE SMART IRRIGATION MARKET, BY TYPE, 2020–2030 ($MILLION)
TABLE 24.EUROPE SMART IRRIGATION MARKET, BY COMPONENT, 2020–2030 ($MILLION)
TABLE 25.EUROPE SMART IRRIGATION MARKET, BY END USE, 2020–2030 ($MILLION)
TABLE 26.UK SMART IRRIGATION MARKET, BY TYPE, 2020–2030 ($MILLION)
TABLE 27.UK SMART IRRIGATION MARKET, BY COMPONENT, 2020–2030 ($MILLION)
TABLE 28.UK SMART IRRIGATION MARKET, BY END USE, 2020–2030 ($MILLION)
TABLE 29.GERMANY SMART IRRIGATION MARKET, BY TYPE, 2020–2030 ($MILLION)
TABLE 30.GERMANY SMART IRRIGATION MARKET, BY COMPONENT, 2020–2030 ($MILLION)
TABLE 31.GERMANY SMART IRRIGATION MARKET, BY END USE, 2020–2030 ($MILLION)
TABLE 32.FRANCE SMART IRRIGATION MARKET, BY TYPE, 2020–2030 ($MILLION)
TABLE 33.FRANCE SMART IRRIGATION MARKET, BY COMPONENT, 2020–2030 ($MILLION)
TABLE 34.FRANCE SMART IRRIGATION MARKET, BY END USE, 2020–2030 ($MILLION)
TABLE 35.REST OF EUROPE SMART IRRIGATION MARKET, BY TYPE, 2020–2030 ($MILLION)
TABLE 36.REST OF EUROPE SMART IRRIGATION MARKET, BY COMPONENT, 2020–2028 ($MILLION)
TABLE 37.REST OF EUROPE SMART IRRIGATION MARKET, BY END USE, 2020–2030 ($MILLION)
TABLE 38.ASIA-PACIFIC SMART IRRIGATION MARKET, BY TYPE, 2020–2030 ($MILLION)
TABLE 39.ASIA-PACIFIC SMART IRRIGATION MARKET, BY COMPONENT, 2020–2030 ($MILLION)
TABLE 40.ASIA-PACIFIC SMART IRRIGATION MARKET, BY END USE, 2020–2028 ($MILLION)
TABLE 41.CHINA SMART IRRIGATION MARKET, BY TYPE, 2020–2030 ($MILLION)
TABLE 42.CHINA SMART IRRIGATION MARKET, BY COMPONENT, 2020–2028 ($MILLION)
TABLE 43.CHINA SMART IRRIGATION MARKET, BY END USE, 2020–2030 ($MILLION)
TABLE 44.JAPAN SMART IRRIGATION MARKET, BY TYPE, 2020–2030 ($MILLION)
TABLE 45.JAPAN SMART IRRIGATION MARKET, BY COMPONENT, 2020–2028 ($MILLION)
TABLE 46.JAPAN SMART IRRIGATION MARKET, BY END USE, 2020–2030 ($MILLION)
TABLE 47.INDIA SMART IRRIGATION MARKET, BY TYPE, 2020–2028 ($MILLION)
TABLE 48.INDIA SMART IRRIGATION MARKET, BY COMPONENT, 2020–2028 ($MILLION)
TABLE 49.INDIA SMART IRRIGATION MARKET, BY END USE, 2020–2030 ($MILLION)
TABLE 50.SINGAPORE SMART IRRIGATION MARKET, BY TYPE, 2020–2030 ($MILLION)
TABLE 51.SINGAPORE SMART IRRIGATION MARKET, BY COMPONENT, 2020–2030 ($MILLION)
TABLE 52.SINGAPORE SMART IRRIGATION MARKET, BY END USE, 2020–2030 ($MILLION)
TABLE 53.REST OF ASIA-PACIFIC SMART IRRIGATION MARKET, BY TYPE, 2020–2030 ($MILLION)
TABLE 54.REST OF ASIA-PACIFIC SMART IRRIGATION MARKET, BYCOMPONENT, 2020–2030 ($MILLION)
TABLE 55.REST OF ASIA-PACIFIC SMART IRRIGATION MARKET, BY END USE, 2020–2030 ($MILLION)
TABLE 56.LAMEA SMART IRRIGATION MARKET, BY TYPE, 2020–2030 ($MILLION)
TABLE 57.LAMEA SMART IRRIGATION MARKET, BY COMPONENT, 2020–2030 ($MILLION)
TABLE 58.LAMEA SMART IRRIGATION MARKET, BY END USE, 2020–2030 ($MILLION)
TABLE 59.LATIN AMERICA SMART IRRIGATION MARKET, BY TYPE, 2020–2028 ($MILLION)
TABLE 60.LATIN AMERICA SMART IRRIGATION MARKET, BY COMPONENT, 2020–2030 ($MILLION)
TABLE 61.LATIN AMERICA SMART IRRIGATION MARKET, BY END USE, 2020–2030 ($MILLION)
TABLE 62.MIDDLE EAST SMART IRRIGATION MARKET, BY TYPE, 2020–2030 ($MILLION)
TABLE 63.MIDDLE EAST SMART IRRIGATION MARKET, BY COMPONENT, 2020–2030 ($MILLION)
TABLE 64.MIDDLE EAST SMART IRRIGATION MARKET, BY END USE, 2020–2030 ($MILLION)
TABLE 65.AFRICA SMART IRRIGATION MARKET, BY TYPE, 2020–2030 ($MILLION)
TABLE 66.AFRICA SMART IRRIGATION MARKET, BY TCOMPONENT, 2020–2030 ($MILLION)
TABLE 67.AFRICA SMART IRRIGATION MARKET, BY END USE, 2020–2030 ($MILLION)
TABLE 68.CALSENSE:KEY EXECUTIVES
TABLE 69.CALSENSE: COMPANY SNAPSHOT
TABLE 70.CALSENSE: OPERATING SEGMENTS
TABLE 71.CALSENSE: PRODUCT PORTFOLIO
TABLE 72.CALSENSE: KEY STRATEGIC MOVES AND DEVELOPMENTS
TABLE 73.JAIN IRRIGATION SYSTEMS LTD.:KEY EXECUTIVES
TABLE 74.JAIN IRRIGATION SYSTEMS LTD.: COMPANY SNAPSHOT
TABLE 75.INFINEON TECHNOLOGIES AG: OPERATING SEGMENTS
TABLE 76.JAIN IRRIGATION SYSTEMS LTD.: PRODUCT PORTFOLIO
TABLE 77.JAIN IRRIGATION SYSTEMS LTD.: KEY STRATEGIC MOVES AND DEVELOPMENTS
TABLE 78.HUNTER INDUSTRIES, INC.:KEY EXECUTIVES
TABLE 79.HUNTER INDUSTRIES, INC.: COMPANY SNAPSHOT
TABLE 80.HUNTER INDUSTRIES, INC.: OPERATING SEGMENTS
TABLE 81.HUNTER INDUSTRIES, INC.: PRODUCT PORTFOLIO
TABLE 82.HUNTER INDUSTRIES, INC.: KEY STRATEGIC MOVES AND DEVELOPMENTS
TABLE 83.HYDROPOINT DATA SYSTEMS, INC.:KEY EXECUTIVES
TABLE 84.HYDROPOINT DATA SYSTEMS, INC.: COMPANY SNAPSHOT
TABLE 85.HYDROPOINT DATA SYSTEMS, INC.: OPERATING SEGMENTS
TABLE 86.HYDROPOINT DATA SYSTEMS, INC.: PRODUCT PORTFOLIO
TABLE 87.HYDROPOINT DATA SYSTEMS, INC.: KEY STRATEGIC MOVES AND DEVELOPMENTS
TABLE 88.ORBIT IRRIGATION PRODUCTS LLC (PLATINUM EQUITY):KEY EXECUTIVES
TABLE 89.ORBIT IRRIGATION PRODUCTS LLC (PLATINUM EQUITY): COMPANY SNAPSHOT
TABLE 90.ORBIT IRRIGATION PRODUCTS LLC (PLATINUM EQUITY): OPERATING SEGMENTS
TABLE 91.ORBIT IRRIGATION PRODUCTS LLC (PLATINUM EQUITY): PRODUCT PORTFOLIO
TABLE 92.RACHIO, INC.:KEY EXECUTIVES
TABLE 93.RACHIO, INC.: COMPANY SNAPSHOT
TABLE 94.RACHIO, INC.: OPERATING SEGMENTS
TABLE 95.RACHIO, INC.: PRODUCT PORTFOLIO
TABLE 96.RACHIO, INC.: KEY STRATEGIC MOVES AND DEVELOPMENTS
TABLE 97.RAIN BIRD CORPORATION:KEY EXECUTIVES
TABLE 98.RAIN BIRD CORPORATION: COMPANY SNAPSHOT
TABLE 99.RAIN BIRD CORPORATION: OPERATING SEGMENTS
TABLE 100.RAIN BIRD CORPORATION: PRODUCT PORTFOLIO
TABLE 101.RAIN BIRD CORPORATION: KEY STRATEGIC MOVES AND DEVELOPMENTS
TABLE 102.STEVENS WATER MONITORING SYSTEMS INC.:KEY EXECUTIVES
TABLE 103.STEVENS WATER MONITORING SYSTEMS INC.: COMPANY SNAPSHOT
TABLE 104.STEVENS WATER MONITORING SYSTEMS INC.: OPERATING SEGMENTS
TABLE 105.STEVENS WATER MONITORING SYSTEMS INC.: PRODUCT PORTFOLIO
TABLE 106.THE TORO COMPANY:KEY EXECUTIVES
TABLE 107.THE TORO COMPANY: COMPANY SNAPSHOT
TABLE 108.THE TORO COMPANY: OPERATING SEGMENTS
TABLE 109.THE TORO COMPANY: PRODUCT PORTFOLIO
TABLE 110.THE TORO COMPANY: KEY STRATEGIC MOVES AND DEVELOPMENTS
TABLE 111.WEATHERMATIC:KEY EXECUTIVES
TABLE 112.WEATHERMATIC: COMPANY SNAPSHOT
TABLE 113.WEATHERMATIC: OPERATING SEGMENTS
TABLE 114.WEATHERMATIC: PRODUCT PORTFOLIO
TABLE 115.WEATHERMATIC: KEY STRATEGIC MOVES AND DEVELOPMENTS

LIST OF FIGURES

FIGURE 01.KEY MARKET SEGMENTS
FIGURE 02.EXECUTIVE SUMMARY, BY SEGMENTATION
FIGURE 03.EXECUTIVE SUMMARY, BY REGION
FIGURE 04.TOP IMPACTING FACTORS
FIGURE 05.TOP INVESTMENT POCKETS
FIGURE 06.MODERATE BARGAINING POWER OF SUPPLIERS
FIGURE 07.HIGH THREAT OF NEW ENTRANTS
FIGURE 08.MODERATE TO HIGH THREAT OF SUBSTITUTES
FIGURE 09.MODERATE TO HIGH INTENSITY OF RIVALRY
FIGURE 10.MODERATE BARGAINING POWER OF BUYERS
FIGURE 11.PATENT ANALYSIS, BY COUNTRY
FIGURE 12.PATENT ANALYSIS, BY APPLICANT
FIGURE 13.SMART IRRIGATION MARKET SHARE, BY TYPE, 2020–2028 (%)
FIGURE 14.SMART IRRIGATION MARKET SHARE, BY TYPE, 2021-2028 ($MILLION)
FIGURE 15.COMPARATIVE SHARE ANALYSIS SMART IRRIGATION MARKET FOR CLIMATE BASED, BY COUNTRY, 2020 & 2028 (%)
FIGURE 16.COMPARATIVE SHARE ANALYSIS SMART IRRIGATION MARKET FOR SENSOR BASED, BY COUNTRY, 2020 & 2030 (%)
FIGURE 17.SMART IRRIGATION MARKET SHARE, BY COMPONENT, 2020–2028 (%)
FIGURE 18.SMART IRRIGATION SHARE, BY COMPONENT, 2020-2030 ($MILLION)
FIGURE 19.COMPARATIVE SHARE ANALYSIS SMART IRRIGATION MARKET FOR CONTROLLERS, BY COUNTRY, 2020 & 2028 (%)
FIGURE 20.COMPARATIVE SHARE ANALYSIS S SMART IRRIGATION MARKET FOR SENSORS, BY COUNTRY, 2020 & 2028 (%)
FIGURE 21.COMPARATIVE SHARE ANALYSIS SMART IRRIGATION MARKET FOR OTHERS, BY COUNTRY, 2020 & 2030 (%)
FIGURE 22.SMART IRRIGATION MARKET SHARE, BY END USER, 2020–2030 (%)
FIGURE 23.SMART IRRIGATION MARKET SHARE, BY END USER, 2020-2030 ($MILLION)
FIGURE 24.COMPARATIVE SHARE ANALYSIS SMART IRRIGATION MARKET FOR AGRICULTURE, BY COUNTRY, 2020 & 2030 (%)
FIGURE 25.COMPARATIVE SHARE ANALYSIS SMART IRRIGATION MARKET FOR GOLF COURSE, BY COUNTRY, 2020 & 2030 (%)
FIGURE 26.COMPARATIVE SHARE ANALYSIS SMART IRRIGATION MARKET FOR RESIDENTIAL, BY COUNTRY, 2020 & 2028 (%)
FIGURE 27.COMPARATIVE SHARE ANALYSIS GSMART IRRIGATION MARKET FOR OTHERS, BY COUNTRY, 2020 & 2028 (%)
FIGURE 28.SMART IRRIGATION MARKET, BY REGION, 2020-2030 (%)
FIGURE 29.COMPARATIVE SHARE ANALYSIS OF NORTH AMERICA SMART IRRIGATION MARKET, BY COUNTRY, 2020–2028 (%)
FIGURE 30.U.S. SMART IRRIGATION  MARKET, 2020–2030 ($MILLION)
FIGURE 31.CANADA SMART IRRIGATION MARKET, 2020–2028 ($MILLION)
FIGURE 32.MEXICO SMART IRRIGATION MARKET, 2020–2030 ($MILLION)
FIGURE 33.COMPARATIVE SHARE ANALYSIS OF EUROPE SMART IRRIGATION MARKET, BY COUNTRY, 2020–2030 (%)
FIGURE 34.UK SMART IRRIGATION MARKET, 2020–2030 ($MILLION)
FIGURE 35.GERMANY SMART IRRIGATION MARKET, 2020–2028 ($MILLION)
FIGURE 36.FRANCE SMART IRRIGATION MARKET, 2020–2028 ($MILLION)
FIGURE 37.REST OF EUROPE SMART IRRIGATION MARKET, 2020–2028 ($MILLION)
FIGURE 38.COMPARATIVE SHARE ANALYSIS OF ASIA-PACIFIC SMART IRRIGATION MARKET, BY COUNTRY, 2020–2030 (%)
FIGURE 39.CHINA SMART IRRIGATION MARKET, 2020–2028 ($MILLION)
FIGURE 40.JAPAN SMART IRRIGATION MARKET, 2020–2028 ($MILLION)
FIGURE 41.INDIA SMART IRIGATION MARKET, 2020–2028 ($MILLION)
FIGURE 42.SINGAPORE SMART IRRIGATION MARKET, 2020–2030 ($MILLION)
FIGURE 43.REST OF ASIA-PACIFIC SMART IRRIGATION MARKET, 2020–2030 ($MILLION)
FIGURE 44.COMPARATIVE SHARE ANALYSIS OF LAMEA SMART IRRIGATION MARKET, BY COUNTRY, 2020–2030 (%)
FIGURE 45.LATIN AMERICA SMART IRRIGATION MARKET, 2020–2028 ($MILLION)
FIGURE 46.MIDDLE EAST SMART IRRIGATION MARKET, 2020–2028 ($MILLION)
FIGURE 47.AFRICA SMART IRRIGATION MARKET, 2020–2030 ($MILLION)
FIGURE 48.MARKET PLAYER POSITIONING, 2019
FIGURE 49.TOP WTOP WINNING STRATEGIES, BY YEAR, 2018–2021
FIGURE 50.TOP WINNING STRATEGIES, BY DEVELOPMENT, 2018–2021 (%)
FIGURE 51.TOP WINNING STRATEGIES, BY COMPANY, 2018–2021
FIGURE 52.COMPETITIVE DASHBOARD
FIGURE 53.COMPETITIVE HEATMAP OF KEY PLAYERS
FIGURE 54.JAIN IRRIGATION SYSTEMS LTD.: R&D EXPENDITURE, 2018–2020 ($MILLION)
FIGURE 55.JAIN IRRIGATION SYSTEMS LTD.: REVENUE, 2018–2020 ($MILLION)
FIGURE 56.JAIN IRRIGATION SYSTEMS LTD.: REVENUE SHARE, BY SEGMENT, 2020 (%)
FIGURE 57.JAIN IRRIGATION SYSTEMS LTD.: REVENUE SHARE, BY REGION, 2020 (%)
FIGURE 58.THE TORO COMPANY: R&D EXPENDITURE, 2018–2020 ($MILLION)
FIGURE 59.THE TORO COMPANY: REVENUE, 2018–2020 ($MILLION)
FIGURE 60.THE TORO COMPANY: REVENUE SHARE, BY SEGMENT, 2020 (%)
FIGURE 61.THE TORO COMPANY: REVENUE SHARE, BY REGION, 2020 (%)


The smart irrigation market is competitive, owing to strong presence of existing vendors. Smart irrigation vendors, who have access to extensive technical and financial resources, are anticipated to gain a competitive edge over their rivals as they have the capacity to cater to the market requirements. The competitive environment in this market is expected to further intensify with increase in technological innovations, product extensions, and different strategies adopted by key vendors.

The smart irrigation market holds a substantial scope for growth on a global scale. Its contribution to the market is anticipated to increase significantly within the span of the forecasted period. Recent discoveries and innovations have created vast opportunities for numerous players to step in the smart irrigation market.

The surge in demand for 5G network for remote monitoring and the rise in advanced features in irrigation system drive the market growth. High initial investment and maintenance cost and lack of skilled workforce in developing regions for operating the technology is the biggest limitation for the market growth.

Surge in competition and reduced awareness among small scale manufactures are the key factors that hamper the growth of the market. Increase in awareness for need of smart irrigation and rise in requirement of water conservation are the factors opportunistic for the market growth.
 

PURCHASE OPTIONS

Call or Email us

U.S.-Canada Toll-free: +1-800-792-5285
Int'l : +1-503-894-6022
Europe : +44-845-528-1300
Email : help@alliedmarketresearch.com
 
FREQUENTLY ASKED QUESTIONS?

A. The Smart Irrigation Market is estimated to grow at a CAGR of 13.9% from 2021 to 2030.

A. The Smart Irrigation Market is projected to reach $5.57 billion by 2030.

A. To get the latest version of sample report

A. Factors such asAvailability of advanced features in irrigation system, increase in government initiatives and policies to promote water conservation & farming, and rise in penetration of automated monitoring systems in the farming sector drives the growth of the Smart Irrigation market

A. The key players profiled in the report include Rain Bird Corporation, The Toro Company, Hunter Industries, CALSENSE, ET Water Systems, Inc., HydroPoint Data Systems, Weathermatic, Rachio inc., Stevens Water Monitoring System, Orbit Irrigation Products Inc, and many more.

A. On the basis of top growing big corporations, we select top 10 players.

A. The Smart Irrigation Market is segmented on the basis of type, component, end use, and region.

A. The key growth strategies of Smart Irrigation market players include product portfolio expansion, mergers & acquisitions, agreements, geographical expansion, and collaborations.

A. Agriculture Segment holds a dominant position throughout the forecast period.

A. Sensor Based segment will grow at a highest CAGR of 14.9% during 2021 - 2030

Looking for Customization?

 Customization Request

Have a Question?

 Speak with Analyst

Any Confusion?

 Inquire Before Buying

Have a glance of the Report

  Request Sample
RELATED TAGS

Purchase Full Report of
Smart Irrigation Market

Start reading instantly.
This Report and over 66,782+ more Reports, Available with Avenue Library. T&C*.

  • Online Only
  • $3,713
  • Online cloud access only
  • Restricted print, copy, paste & download
  • Read only
  • Free industry update
    (Within 180 days)
  • Free report update in next update cycle
    (Jul 2022 - Jul 2023)
  • Data Pack
  • $4,126
  • Restricted to one authorized user
  • One print only
  • Available in
    Excel
  • Free industry update
    (Within 180 days)
  •   Free report update in next update cycle
    (Jul 2022 - Jul 2023)
  • Single User
  • $5,770
  • Restricted to one authorized user
  • One print only
  • Available in
    PDF
  • Free industry update
    (Within 180 days)
  •   Free report update in next update cycle
    (Jul 2022 - Jul 2023)
  • Five Users
  • $6,930
  • Limited to five authorized users
  • Print upto five copies
  • Available in
    PDF
  • Free industry update
    (Within 180 days)
  •   Free report update in next update cycle
    (Jul 2022 - Jul 2023)
  • Enterprise
    License/PDF

  • $10,665
  • Unlimited
    within
    company/enterprise
  • Available in Excel & PDF
  • Free industry update
    (Within 180 days)
  •   Free report update in next update cycle
    (Jul 2022 - Jul 2023)
  • Library
    Membership

  • $999 $ 1,175
    Per User/ Per month/ Billed annually
  • Published Content
    E-access
  • Company Profiles
    E-access
  • Newly Added Content Access
  • 10 PDF
    Downloads
  • 5 Excel Data
    Pack Downloads
  • 250 Company Profiles PDF Downloads
  • Buy Now

*Taxes/Fees, if applicable will be added during checkout. All prices in USD

RELATED REPORTS
 

Why Allied Market Research?


Infallible Methodology

To ensure high-level data integrity, accurate analysis, and impeccable forecasts

Analyst Support

For complete satisfaction

Customization

On-demand customization of scope of the report to exactly meet your needs

TARGETED MARKET VIEW

Targeted market view to provide pertinent information and save time of readers

Get fresh content delivered

Get insights on topics that are crucial for your business. Stay abreast of your interest areas.

Get Industry Data Alerts

Why Allied Market Research?

Infallible Methodology

To ensure high-level data integrity, accurate analysis, and impeccable forecasts

Analyst Support

For complete satisfaction

Customization

On-demand customization of scope of the report to exactly meet your needs

TARGETED MARKET VIEW

Targeted market view to provide pertinent information and save time of readers