0
2023
Soybean Meal Market

Soybean Meal Market

by Nature (Organic, Conventional), by Application (Food Industry, Animal Feed Industry, Pharmaceutical), by Sales Channel (Online, Offline, B2B): Global Opportunity Analysis and Industry Forecast, 2021-2031

Report Code: A04941
Jan 2023 | Pages: 250
Tables: 227
Charts: 74
  • Formats*:

  • pdf

    Single User License, Five User
    License & Enterprise User License

  • xls

    Data Pack Excel License

  • ppt

    It comes with the additional cost
    of $2500.00 contact sales.


Soybean Meal Market Research, 2031

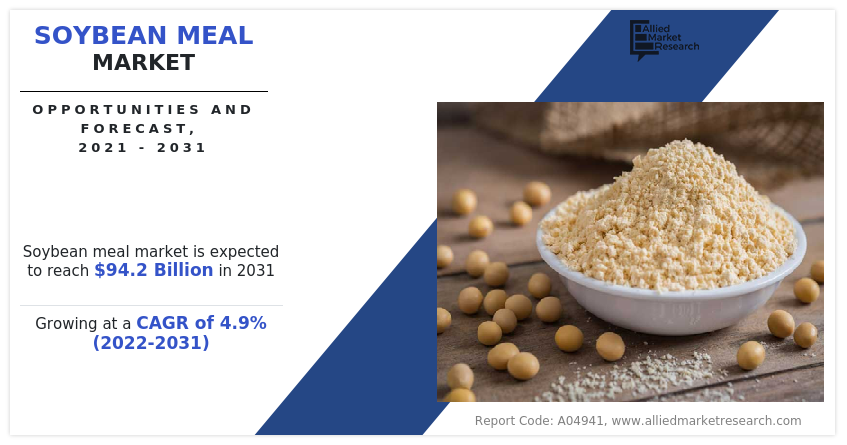
The global soybean meal market size was valued at $59.2 billion in 2021, and is projected to reach $94.2 billion by 2031, growing at a CAGR of 4.9% from 2022 to 2031.

Soybean meal is a great animal feed because it is highly digested, tasty, and contains a lot of digestible energy. Depending on the degree of dehulling and the processing technique, soybean meal has a CP content of 45–55% and a TDN of 75–84%. All of the necessary amino acids are present in the protein, however, the concentrations of cystine and methionine are not ideal. In high-energy diets, methionine may be particularly crucial as the first limiting amino acid. Large quantities have not been fed to dairy or beef cattle due to the high rate of CP degradation in the rumen. Various processing techniques for soybeans have been developed recently to lessen CP breakdown in the rumen. In terms of calcium and phosphorus, soybean meal is superior to cereal grains. Full-fat roasted soybeans have recently become a significant component of the diets of dairy cattle, particularly in affluent nations. It has also been demonstrated that feeding full-fat soybeans can increase milk concentrations of conjugated linoleic acid, a substance that has been linked to a lower risk of cancer in people. The oilseed crop that is most widely cultivated worldwide is soybean. India is the country with the highest production of soybean seeds in South Asia. A seasonal crop, soybeans may thrive in a variety of environments. Soybeans are typically solvent extracted and have an oil content of 16–21%.
In the years to come, the industry's general growth trajectory is anticipated to be supported by the increase of animal husbandry and the growing public awareness of livestock emissions.

Soybean Meal Market

The nutritional components of products made from soybean meal are essential components for optimizing diets and estimating the overall amount of nutrients provided to animals. Maximum feed items for livestock and poultry contain soybean meal. The industry that produces animal feed has the biggest need for soybean meal. However, soybean meal is an essential part of the daily diet for dairy animals such as cattle and buffalo because it increases their ability to produce milk. Additionally, to  satisfy the rising demand for meat, soybean meal is fed to animals including pigs, ruminants, and fowl to help them gain weight. Additionally, in food products for human consumption, such as bakery goods and nutritional supplements, soybean meal is used as a substitute for meat products to increase the body's protein supply.

Although a sizable amount of the soybean meal sector is devoted to supplying human protein requirements, growing consumer concern over the quality of animal food items is creating new demand for animal feed. Additionally, the use of soybean meal concentrates in ground feeds and the maximization of productivity in monocultures reduce the reliance on easily available fishmeal in nature. The health benefits that soybean meal concentrate provides when used in animal feeds are valued by livestock farmers in addition to aquaculture producers, which is anticipated to support the growth of the soybean meal ingredients market during the forecast period.

Nowadays, almost all food and beverage products on the market follow the organic trend. As consumers become more health concerned and knowledgeable about the unsanitary production and development of food crops and their impact on the body, there is a growing market demand for organic products. For example, the absence of radiation, genetic engineering, harmful chemicals, GMO ingredients, pesticides, and fertilizers are advantages of organic products.

Additionally, according to the Research Institute of Organic Agriculture, 3.1 million organic farmers produced $123 million in revenue in 2019. (FIBL). Furthermore, Australia has the largest amount of organic agricultural land on the planet, at 35.7 billion hectares. Latin America and Asia are next with 11% and 5.9% of the world's organic acreage, respectively, followed by Europe with 16.5 million hectares, or more than 60% of the total. A different estimate by FIBL states that 1.5% of cropland worldwide is organic, and this percentage is rising along with the demand for organic goods. More than three-quarters of consumers globally feel non-GMO food products are significantly or somewhat healthier, despite the fact that leading international scientific organizations to endorse genetically modified organisms. Globally, GMOs continue to top consumers' lists of concerns regarding food. Major corporations are also making progress in the development of organic products to fulfil the increased soybean meal market demand. The market for organic products is also expected to rise as a result of rising disposable income and rising spending on organic products, particularly in developing countries like China, India, Brazil, and Mexico. The use of chemicals, artificial additives, preservatives, or non-organic materials is also low during the stages of producing, processing, and preserving organic soy protein. Major market players are promoting soy products with organic labels since these products are created from raw materials grown organically.

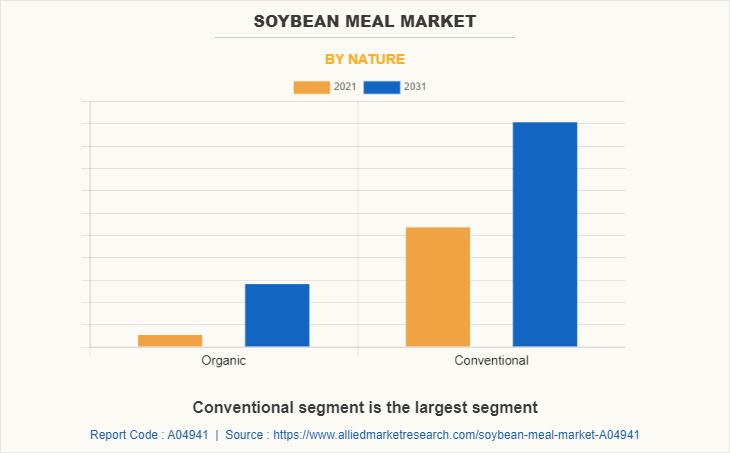
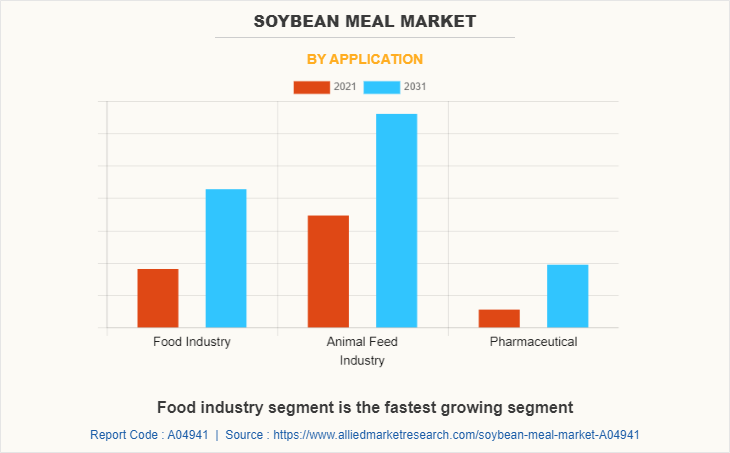
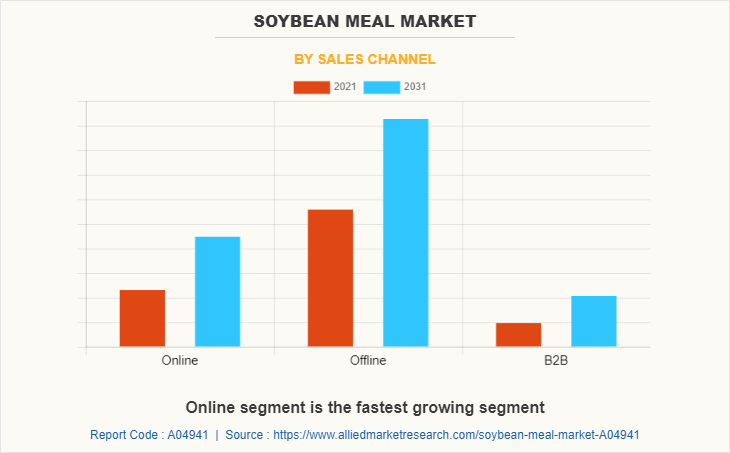
The soybean meal market is segmented on the basis of nature, application, sales channel, and region. By nature, the market is divided into organic and conventional. By application, the soybean meal market is fragmented into food industry, animal feed industry, and pharmaceutical. By sales channel, it is classified into online, offline, and B2B. Region wise, the soybean meal market is analyzed across North America, Europe, Asia-Pacific, and LAMEA.
Soybean Meal Market

The conventional segment, as per nature, dominated the soybean meal market in 2021 and is anticipated to maintain its dominance throughout the soybean meal market foreacst period. This is attributed to the low price and easy availability of conventional soybean meal. For children, adults, and animal feed, the amount of proteins and vitamins in conventionally produced soybean meals is adequate.
Soybean Meal Market

The animal feed industry segment dominates the global soybean meal market. Cattle are fed soybean meal during the fattening phase to encourage efficient growth. This is due to the fact that it increases the amount of fat deposits in the carcass, which improves the food's quality and appeal to consumers. To meet the nutritional needs of grass-fed cattle, particularly grass-fed beef, high-energy or high-protein feeds should be supplemented if the grass is of poor nutritional quality.
Soybean Meal Market

The online segment exhibits the fastest soybean meal market growth. Online platforms are more often used to buy soybean meals because of how simple they are to use and how quickly they can be accessed. Online sales are increasing as a result of time-saving features, easy access to information on the ingredients used in soybean meal products, and the availability of home delivery.
Soybean Meal Market

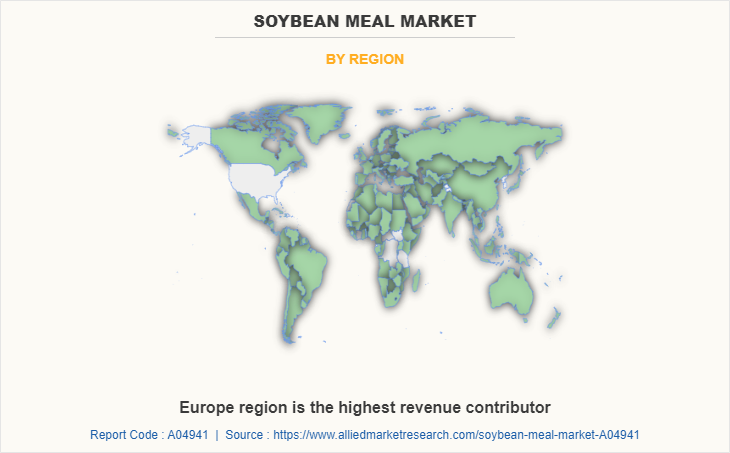
Region wise, Asia-Pacific dominated the market with the largest soybean meal market share during the soybean meal market foreacst period. Due to the growing potential in the Chinese and Indian markets, Asia-Pacific now has the largest market for soybean meal. In India, the demand for soy protein is rising as a result of the rapidly growing market for soybean meal, which has also raised the country's protein needs.

Since the general population has become more aware of the nutritional benefits of soybean meal, consumption has increased. Considering that it contains a lot of protein, it is frequently considered to be a healthy option. Consuming soybean meal reduces levels of cholesterol and low-density lipoprotein cholesterol. Additionally, it promotes the growth of lean muscle mass, enhances the healing of strained muscles, and lessens oxidative stress and inflammation of the muscles. A health claim that has been approved by the U.S. Food and Drug Administration states that a diet low in saturated fat and cholesterol that includes 25 gm of soy protein per day lessens the risk of heart disease (FDA). Additionally, men's prostate health, muscle mass, bone health, menopausal symptoms, and breast cancer prevention are all benefited by soybean meal content. Thus, it is projected that a number of health benefits and a rise in consumer health consciousness will fuel soybean meal market expansion.

The lack of regulatory standards is one of the main factors impeding the growth of the soybean meal industry. In countries where frameworks based on scientific risk have been established to govern national food safety standards, this trend is noticeably more prevalent. For instance, the components of soybean meal are subject to strict criteria set by federal and state regulatory agencies in the U.S. Certain usage and labeling laws in the U.S. limit the growth of soybean meal as a dairy substitute. Additionally, only 8% of soy proteins may be used in chili, and only 12% of soy proteins may be used in Salisbury steaks and meatballs. Additionally, there is a 3.5% restriction on the quantity of soy flour that can be used in normal sausage products, and it must be correctly labeled before being put on the market. Components of soybean meal should never be used in infant food, according to the European Communities Commission, because they could increase the risk of allergies. The market for soybean meal cannot grow due to these restrictions.

The major players analyzed for the soybean meal industry are Mahesh Agro Food Industries, Louis Dreyfus Company B.V., Bunge Limited, Mamta Hygiene Products Pvt. Ltd., Nordic Soya Ltd., Mukwano Industries Uganda Ltd., Gujarat Ambuja Exports Limited, AdamPolSoya, Wudi Deda Agriculture Co. Ltd., Agrocorp International Pte Ltd, Shafer Commodities Inc., Denofa AS, Kohinoor Feeds and Fats Ltd., Minnesota Soybean Processors, Granol Indstria Comrcio e Exportao S/A, DHN International, Gauri Agrotech Products Pvt. Ltd., The Scoular Company, CHS Inc., and Kemin Industries, Inc. Key players operating in the soybean meal market have adopted product launch, business expansion, and mergers & acquisitions as key strategies to expand their soybean meal market share, increase profitability, and remain competitive in the market.

Key Benefits For Stakeholders

  • This report provides a quantitative analysis of the soybean meal market size, segments, current trends, estimations, and dynamics of the soybean meal market analysis from 2021 to 2031 to identify the prevailing soybean meal market opportunities.
  • The market research is offered along with information related to key drivers, restraints, and opportunities.
  • Porter's five forces analysis highlights the potency of buyers and suppliers to enable stakeholders make profit-oriented business decisions and strengthen their supplier-buyer network.
  • In-depth analysis of the soybean meal market segmentation assists to determine the prevailing market opportunities.
  • Major countries in each region are mapped according to their revenue contribution to the global market.
  • Market player positioning facilitates benchmarking and provides a clear understanding of the present position of the market players.
  • The report includes the analysis of the regional as well as global soybean meal market trends, key players, market segments, application areas, and soybean meal market growth strategies.

Soybean Meal Market Report Highlights

Aspects Details
Market Size By 2031 USD 94.2 billion
Growth Rate CAGR of 4.9%
Forecast period 2021 - 2031
Report Pages 250
By Nature
  • Organic
  • Conventional
By Application
  • Food Industry
  • Animal Feed Industry
  • Pharmaceutical
By Sales Channel
  • Offline
    • sub-type
      • Supermarkets and hypermarkets
      • Convenience stores
      • Others
  • B2B
  • Online
By Region
  • North America  (U.S., Canada, Mexico)
  • Europe  (Germany, Spain, UK, Italy, France, Russia, Finland, Rest of Europe)
  • Asia-Pacific  (China, Japan, India, Indonesia, Thailand, Vietnam, Philippines, Rest of Asia-Pacific)
  • LAMEA  (Brazil, Argentina, South Africa, Saudi Arabia, Rest of LAMEA)
Key Market Players The Scoular Company, CHS Inc., Minnesota Soybean Processors., Kemin Industries, Inc., Mamta Hygiene Products Pvt Ltd, DHN International, Granol Indstria Comrcio e Exportao S/A, Mahesh Agro Food Industries, Gauri Agrotech Products Pvt. Ltd., Mukwano Industries Uganda Ltd., Nordic Soya Ltd., Kohinoor Feeds and Fats Ltd., Wudi Deda Agriculture Co. Limited, AdamPolSoya, Denofa AS, Agrocorp International Pte Ltd, Gujarat Ambuja Exports Limited, Bunge Limited, Shafer Commodities Inc., Louis Dreyfus Company B.V.
 
  • CHAPTER 1:INTRODUCTION

    • 1.1.Report description

    • 1.2.Key market segments

    • 1.3.Key benefits to the stakeholders

    • 1.4.Research Methodology

      • 1.4.1.Secondary research

      • 1.4.2.Primary research

      • 1.4.3.Analyst tools and models

  • CHAPTER 2:EXECUTIVE SUMMARY

    • 2.1.Key findings of the study

    • 2.2.CXO Perspective

  • CHAPTER 3:MARKET OVERVIEW

    • 3.1.Market definition and scope

    • 3.2.Key findings

      • 3.2.1.Top investment pockets

    • 3.3.Porter’s five forces analysis

    • 3.4.Market dynamics

      • 3.4.1.Drivers

        • 3.4.1.1. Increase in health awareness among consumers
        • 3.4.1.2. Rise in consumption of plant protein and veganism
        • 3.4.1.3. Increase in usage of soybean meal for animal feed

      • 3.4.2.Restraints

        • 3.4.2.1. Undefined regulatory guidelines
        • 3.4.2.2. Increase in prevalence of diseases in soybean plants

      • 3.4.3.Opportunities

        • 3.4.3.1. Rise in demand for organic products
        • 3.4.3.2. Growing application of soybean meal in various industries

    • 3.5.COVID-19 Impact Analysis on the market

    • 3.6.Market Share Analysis

    • 3.7.Value Chain Analysis

  • CHAPTER 4: SOYBEAN MEAL MARKET, BY NATURE

    • 4.1 Overview

      • 4.1.1 Market size and forecast

    • 4.2. Organic

      • 4.2.1 Key market trends, growth factors and opportunities

      • 4.2.2 Market size and forecast, by region

      • 4.2.3 Market share analysis by country

    • 4.3. Conventional

      • 4.3.1 Key market trends, growth factors and opportunities

      • 4.3.2 Market size and forecast, by region

      • 4.3.3 Market share analysis by country

  • CHAPTER 5: SOYBEAN MEAL MARKET, BY APPLICATION

    • 5.1 Overview

      • 5.1.1 Market size and forecast

    • 5.2. Food Industry

      • 5.2.1 Key market trends, growth factors and opportunities

      • 5.2.2 Market size and forecast, by region

      • 5.2.3 Market share analysis by country

    • 5.3. Animal Feed Industry

      • 5.3.1 Key market trends, growth factors and opportunities

      • 5.3.2 Market size and forecast, by region

      • 5.3.3 Market share analysis by country

    • 5.4. Pharmaceutical

      • 5.4.1 Key market trends, growth factors and opportunities

      • 5.4.2 Market size and forecast, by region

      • 5.4.3 Market share analysis by country

  • CHAPTER 6: SOYBEAN MEAL MARKET, BY SALES CHANNEL

    • 6.1 Overview

      • 6.1.1 Market size and forecast

    • 6.2. Online

      • 6.2.1 Key market trends, growth factors and opportunities

      • 6.2.2 Market size and forecast, by region

      • 6.2.3 Market share analysis by country

    • 6.3. Offline

      • 6.3.1 Key market trends, growth factors and opportunities

      • 6.3.2 Market size and forecast, by region

      • 6.3.3 Market share analysis by country

      • 6.3.4 Offline Soybean Meal Market by sub-type

        • 6.3.4.1 Supermarkets and hypermarkets Market size and forecast, by region
        • 6.3.4.2 Convenience stores Market size and forecast, by region
        • 6.3.4.3 Others Market size and forecast, by region
    • 6.4. B2B

      • 6.4.1 Key market trends, growth factors and opportunities

      • 6.4.2 Market size and forecast, by region

      • 6.4.3 Market share analysis by country

  • CHAPTER 7: SOYBEAN MEAL MARKET, BY REGION

    • 7.1 Overview

      • 7.1.1 Market size and forecast

    • 7.2 North America

      • 7.2.1 Key trends and opportunities

      • 7.2.2 North America Market size and forecast, by Nature

      • 7.2.3 North America Market size and forecast, by Application

      • 7.2.4 North America Market size and forecast, by Sales Channel

        • 7.2.4.1 North America Offline Soybean Meal Market by sub-type
      • 7.2.5 North America Market size and forecast, by country

        • 7.2.5.1 U.S.
          • 7.2.5.1.1 Key market trends, growth factors and opportunities
          • 7.2.5.1.2 Market size and forecast, by Nature
          • 7.2.5.1.3 Market size and forecast, by Application
          • 7.2.5.1.4 Market size and forecast, by Sales Channel
        • 7.2.5.2 Canada
          • 7.2.5.2.1 Key market trends, growth factors and opportunities
          • 7.2.5.2.2 Market size and forecast, by Nature
          • 7.2.5.2.3 Market size and forecast, by Application
          • 7.2.5.2.4 Market size and forecast, by Sales Channel
        • 7.2.5.3 Mexico
          • 7.2.5.3.1 Key market trends, growth factors and opportunities
          • 7.2.5.3.2 Market size and forecast, by Nature
          • 7.2.5.3.3 Market size and forecast, by Application
          • 7.2.5.3.4 Market size and forecast, by Sales Channel
    • 7.3 Europe

      • 7.3.1 Key trends and opportunities

      • 7.3.2 Europe Market size and forecast, by Nature

      • 7.3.3 Europe Market size and forecast, by Application

      • 7.3.4 Europe Market size and forecast, by Sales Channel

        • 7.3.4.1 Europe Offline Soybean Meal Market by sub-type
      • 7.3.5 Europe Market size and forecast, by country

        • 7.3.5.1 Germany
          • 7.3.5.1.1 Key market trends, growth factors and opportunities
          • 7.3.5.1.2 Market size and forecast, by Nature
          • 7.3.5.1.3 Market size and forecast, by Application
          • 7.3.5.1.4 Market size and forecast, by Sales Channel
        • 7.3.5.2 Spain
          • 7.3.5.2.1 Key market trends, growth factors and opportunities
          • 7.3.5.2.2 Market size and forecast, by Nature
          • 7.3.5.2.3 Market size and forecast, by Application
          • 7.3.5.2.4 Market size and forecast, by Sales Channel
        • 7.3.5.3 UK
          • 7.3.5.3.1 Key market trends, growth factors and opportunities
          • 7.3.5.3.2 Market size and forecast, by Nature
          • 7.3.5.3.3 Market size and forecast, by Application
          • 7.3.5.3.4 Market size and forecast, by Sales Channel
        • 7.3.5.4 Italy
          • 7.3.5.4.1 Key market trends, growth factors and opportunities
          • 7.3.5.4.2 Market size and forecast, by Nature
          • 7.3.5.4.3 Market size and forecast, by Application
          • 7.3.5.4.4 Market size and forecast, by Sales Channel
        • 7.3.5.5 France
          • 7.3.5.5.1 Key market trends, growth factors and opportunities
          • 7.3.5.5.2 Market size and forecast, by Nature
          • 7.3.5.5.3 Market size and forecast, by Application
          • 7.3.5.5.4 Market size and forecast, by Sales Channel
        • 7.3.5.6 Russia
          • 7.3.5.6.1 Key market trends, growth factors and opportunities
          • 7.3.5.6.2 Market size and forecast, by Nature
          • 7.3.5.6.3 Market size and forecast, by Application
          • 7.3.5.6.4 Market size and forecast, by Sales Channel
        • 7.3.5.7 Finland
          • 7.3.5.7.1 Key market trends, growth factors and opportunities
          • 7.3.5.7.2 Market size and forecast, by Nature
          • 7.3.5.7.3 Market size and forecast, by Application
          • 7.3.5.7.4 Market size and forecast, by Sales Channel
        • 7.3.5.8 Rest of Europe
          • 7.3.5.8.1 Key market trends, growth factors and opportunities
          • 7.3.5.8.2 Market size and forecast, by Nature
          • 7.3.5.8.3 Market size and forecast, by Application
          • 7.3.5.8.4 Market size and forecast, by Sales Channel
    • 7.4 Asia-Pacific

      • 7.4.1 Key trends and opportunities

      • 7.4.2 Asia-Pacific Market size and forecast, by Nature

      • 7.4.3 Asia-Pacific Market size and forecast, by Application

      • 7.4.4 Asia-Pacific Market size and forecast, by Sales Channel

        • 7.4.4.1 Asia-Pacific Offline Soybean Meal Market by sub-type
      • 7.4.5 Asia-Pacific Market size and forecast, by country

        • 7.4.5.1 China
          • 7.4.5.1.1 Key market trends, growth factors and opportunities
          • 7.4.5.1.2 Market size and forecast, by Nature
          • 7.4.5.1.3 Market size and forecast, by Application
          • 7.4.5.1.4 Market size and forecast, by Sales Channel
        • 7.4.5.2 Japan
          • 7.4.5.2.1 Key market trends, growth factors and opportunities
          • 7.4.5.2.2 Market size and forecast, by Nature
          • 7.4.5.2.3 Market size and forecast, by Application
          • 7.4.5.2.4 Market size and forecast, by Sales Channel
        • 7.4.5.3 India
          • 7.4.5.3.1 Key market trends, growth factors and opportunities
          • 7.4.5.3.2 Market size and forecast, by Nature
          • 7.4.5.3.3 Market size and forecast, by Application
          • 7.4.5.3.4 Market size and forecast, by Sales Channel
        • 7.4.5.4 Indonesia
          • 7.4.5.4.1 Key market trends, growth factors and opportunities
          • 7.4.5.4.2 Market size and forecast, by Nature
          • 7.4.5.4.3 Market size and forecast, by Application
          • 7.4.5.4.4 Market size and forecast, by Sales Channel
        • 7.4.5.5 Thailand
          • 7.4.5.5.1 Key market trends, growth factors and opportunities
          • 7.4.5.5.2 Market size and forecast, by Nature
          • 7.4.5.5.3 Market size and forecast, by Application
          • 7.4.5.5.4 Market size and forecast, by Sales Channel
        • 7.4.5.6 Vietnam
          • 7.4.5.6.1 Key market trends, growth factors and opportunities
          • 7.4.5.6.2 Market size and forecast, by Nature
          • 7.4.5.6.3 Market size and forecast, by Application
          • 7.4.5.6.4 Market size and forecast, by Sales Channel
        • 7.4.5.7 Philippines
          • 7.4.5.7.1 Key market trends, growth factors and opportunities
          • 7.4.5.7.2 Market size and forecast, by Nature
          • 7.4.5.7.3 Market size and forecast, by Application
          • 7.4.5.7.4 Market size and forecast, by Sales Channel
        • 7.4.5.8 Rest of Asia-Pacific
          • 7.4.5.8.1 Key market trends, growth factors and opportunities
          • 7.4.5.8.2 Market size and forecast, by Nature
          • 7.4.5.8.3 Market size and forecast, by Application
          • 7.4.5.8.4 Market size and forecast, by Sales Channel
    • 7.5 LAMEA

      • 7.5.1 Key trends and opportunities

      • 7.5.2 LAMEA Market size and forecast, by Nature

      • 7.5.3 LAMEA Market size and forecast, by Application

      • 7.5.4 LAMEA Market size and forecast, by Sales Channel

        • 7.5.4.1 LAMEA Offline Soybean Meal Market by sub-type
      • 7.5.5 LAMEA Market size and forecast, by country

        • 7.5.5.1 Brazil
          • 7.5.5.1.1 Key market trends, growth factors and opportunities
          • 7.5.5.1.2 Market size and forecast, by Nature
          • 7.5.5.1.3 Market size and forecast, by Application
          • 7.5.5.1.4 Market size and forecast, by Sales Channel
        • 7.5.5.2 Argentina
          • 7.5.5.2.1 Key market trends, growth factors and opportunities
          • 7.5.5.2.2 Market size and forecast, by Nature
          • 7.5.5.2.3 Market size and forecast, by Application
          • 7.5.5.2.4 Market size and forecast, by Sales Channel
        • 7.5.5.3 South Africa
          • 7.5.5.3.1 Key market trends, growth factors and opportunities
          • 7.5.5.3.2 Market size and forecast, by Nature
          • 7.5.5.3.3 Market size and forecast, by Application
          • 7.5.5.3.4 Market size and forecast, by Sales Channel
        • 7.5.5.4 Saudi Arabia
          • 7.5.5.4.1 Key market trends, growth factors and opportunities
          • 7.5.5.4.2 Market size and forecast, by Nature
          • 7.5.5.4.3 Market size and forecast, by Application
          • 7.5.5.4.4 Market size and forecast, by Sales Channel
        • 7.5.5.5 Rest of LAMEA
          • 7.5.5.5.1 Key market trends, growth factors and opportunities
          • 7.5.5.5.2 Market size and forecast, by Nature
          • 7.5.5.5.3 Market size and forecast, by Application
          • 7.5.5.5.4 Market size and forecast, by Sales Channel
  • CHAPTER 8: COMPETITIVE LANDSCAPE

    • 8.1. Introduction

    • 8.2. Top winning strategies

    • 8.3. Product Mapping of Top 10 Player

    • 8.4. Competitive Dashboard

    • 8.5. Competitive Heatmap

    • 8.6. Top player positioning, 2021

  • CHAPTER 9: COMPANY PROFILES

    • 9.1 Mahesh Agro Food Industries

      • 9.1.1 Company overview

      • 9.1.2 Key Executives

      • 9.1.3 Company snapshot

      • 9.1.4 Operating business segments

      • 9.1.5 Product portfolio

      • 9.1.6 Business performance

      • 9.1.7 Key strategic moves and developments

    • 9.2 Louis Dreyfus Company B.V.

      • 9.2.1 Company overview

      • 9.2.2 Key Executives

      • 9.2.3 Company snapshot

      • 9.2.4 Operating business segments

      • 9.2.5 Product portfolio

      • 9.2.6 Business performance

      • 9.2.7 Key strategic moves and developments

    • 9.3 Bunge Limited

      • 9.3.1 Company overview

      • 9.3.2 Key Executives

      • 9.3.3 Company snapshot

      • 9.3.4 Operating business segments

      • 9.3.5 Product portfolio

      • 9.3.6 Business performance

      • 9.3.7 Key strategic moves and developments

    • 9.4 Mamta Hygiene Products Pvt Ltd

      • 9.4.1 Company overview

      • 9.4.2 Key Executives

      • 9.4.3 Company snapshot

      • 9.4.4 Operating business segments

      • 9.4.5 Product portfolio

      • 9.4.6 Business performance

      • 9.4.7 Key strategic moves and developments

    • 9.5 Nordic Soya Ltd.

      • 9.5.1 Company overview

      • 9.5.2 Key Executives

      • 9.5.3 Company snapshot

      • 9.5.4 Operating business segments

      • 9.5.5 Product portfolio

      • 9.5.6 Business performance

      • 9.5.7 Key strategic moves and developments

    • 9.6 Mukwano Industries Uganda Ltd.

      • 9.6.1 Company overview

      • 9.6.2 Key Executives

      • 9.6.3 Company snapshot

      • 9.6.4 Operating business segments

      • 9.6.5 Product portfolio

      • 9.6.6 Business performance

      • 9.6.7 Key strategic moves and developments

    • 9.7 Gujarat Ambuja Exports Limited

      • 9.7.1 Company overview

      • 9.7.2 Key Executives

      • 9.7.3 Company snapshot

      • 9.7.4 Operating business segments

      • 9.7.5 Product portfolio

      • 9.7.6 Business performance

      • 9.7.7 Key strategic moves and developments

    • 9.8 AdamPolSoya

      • 9.8.1 Company overview

      • 9.8.2 Key Executives

      • 9.8.3 Company snapshot

      • 9.8.4 Operating business segments

      • 9.8.5 Product portfolio

      • 9.8.6 Business performance

      • 9.8.7 Key strategic moves and developments

    • 9.9 Wudi Deda Agriculture Co. Limited

      • 9.9.1 Company overview

      • 9.9.2 Key Executives

      • 9.9.3 Company snapshot

      • 9.9.4 Operating business segments

      • 9.9.5 Product portfolio

      • 9.9.6 Business performance

      • 9.9.7 Key strategic moves and developments

    • 9.10 Agrocorp International Pte Ltd

      • 9.10.1 Company overview

      • 9.10.2 Key Executives

      • 9.10.3 Company snapshot

      • 9.10.4 Operating business segments

      • 9.10.5 Product portfolio

      • 9.10.6 Business performance

      • 9.10.7 Key strategic moves and developments

    • 9.11 Shafer Commodities Inc.

      • 9.11.1 Company overview

      • 9.11.2 Key Executives

      • 9.11.3 Company snapshot

      • 9.11.4 Operating business segments

      • 9.11.5 Product portfolio

      • 9.11.6 Business performance

      • 9.11.7 Key strategic moves and developments

    • 9.12 Denofa AS

      • 9.12.1 Company overview

      • 9.12.2 Key Executives

      • 9.12.3 Company snapshot

      • 9.12.4 Operating business segments

      • 9.12.5 Product portfolio

      • 9.12.6 Business performance

      • 9.12.7 Key strategic moves and developments

    • 9.13 Kohinoor Feeds and Fats Ltd.

      • 9.13.1 Company overview

      • 9.13.2 Key Executives

      • 9.13.3 Company snapshot

      • 9.13.4 Operating business segments

      • 9.13.5 Product portfolio

      • 9.13.6 Business performance

      • 9.13.7 Key strategic moves and developments

    • 9.14 Minnesota Soybean Processors.

      • 9.14.1 Company overview

      • 9.14.2 Key Executives

      • 9.14.3 Company snapshot

      • 9.14.4 Operating business segments

      • 9.14.5 Product portfolio

      • 9.14.6 Business performance

      • 9.14.7 Key strategic moves and developments

    • 9.15 Granol Indstria Comrcio e Exportao S/A

      • 9.15.1 Company overview

      • 9.15.2 Key Executives

      • 9.15.3 Company snapshot

      • 9.15.4 Operating business segments

      • 9.15.5 Product portfolio

      • 9.15.6 Business performance

      • 9.15.7 Key strategic moves and developments

    • 9.16 DHN International

      • 9.16.1 Company overview

      • 9.16.2 Key Executives

      • 9.16.3 Company snapshot

      • 9.16.4 Operating business segments

      • 9.16.5 Product portfolio

      • 9.16.6 Business performance

      • 9.16.7 Key strategic moves and developments

    • 9.17 Gauri Agrotech Products Pvt. Ltd.

      • 9.17.1 Company overview

      • 9.17.2 Key Executives

      • 9.17.3 Company snapshot

      • 9.17.4 Operating business segments

      • 9.17.5 Product portfolio

      • 9.17.6 Business performance

      • 9.17.7 Key strategic moves and developments

    • 9.18 The Scoular Company

      • 9.18.1 Company overview

      • 9.18.2 Key Executives

      • 9.18.3 Company snapshot

      • 9.18.4 Operating business segments

      • 9.18.5 Product portfolio

      • 9.18.6 Business performance

      • 9.18.7 Key strategic moves and developments

    • 9.19 CHS Inc.

      • 9.19.1 Company overview

      • 9.19.2 Key Executives

      • 9.19.3 Company snapshot

      • 9.19.4 Operating business segments

      • 9.19.5 Product portfolio

      • 9.19.6 Business performance

      • 9.19.7 Key strategic moves and developments

    • 9.20 Kemin Industries, Inc.

      • 9.20.1 Company overview

      • 9.20.2 Key Executives

      • 9.20.3 Company snapshot

      • 9.20.4 Operating business segments

      • 9.20.5 Product portfolio

      • 9.20.6 Business performance

      • 9.20.7 Key strategic moves and developments

  • LIST OF TABLES

  • TABLE 1. GLOBAL SOYBEAN MEAL MARKET, BY NATURE, 2021-2031 (REVENUE, $MILLION)
    TABLE 2. SOYBEAN MEAL MARKET FOR ORGANIC, BY REGION, 2021-2031 (REVENUE, $MILLION)
    TABLE 3. SOYBEAN MEAL MARKET FOR CONVENTIONAL, BY REGION, 2021-2031 (REVENUE, $MILLION)
    TABLE 4. GLOBAL SOYBEAN MEAL MARKET, BY APPLICATION, 2021-2031 (REVENUE, $MILLION)
    TABLE 5. SOYBEAN MEAL MARKET FOR FOOD INDUSTRY, BY REGION, 2021-2031 (REVENUE, $MILLION)
    TABLE 6. SOYBEAN MEAL MARKET FOR ANIMAL FEED INDUSTRY, BY REGION, 2021-2031 (REVENUE, $MILLION)
    TABLE 7. SOYBEAN MEAL MARKET FOR PHARMACEUTICAL, BY REGION, 2021-2031 (REVENUE, $MILLION)
    TABLE 8. GLOBAL SOYBEAN MEAL MARKET, BY SALES CHANNEL, 2021-2031 (REVENUE, $MILLION)
    TABLE 9. SOYBEAN MEAL MARKET FOR ONLINE, BY REGION, 2021-2031 (REVENUE, $MILLION)
    TABLE 10. SOYBEAN MEAL MARKET FOR OFFLINE, BY REGION, 2021-2031 (REVENUE, $MILLION)
    TABLE 11. GLOBAL OFFLINE SOYBEAN MEAL MARKET, BY SUB-TYPE, 2021-2031 (REVENUE, $MILLION)
    TABLE 12. SOYBEAN MEAL MARKET FOR SUPERMARKETS AND HYPERMARKETS, BY REGION, 2021-2031 (REVENUE, $MILLION)
    TABLE 13. SOYBEAN MEAL MARKET FOR CONVENIENCE STORES, BY REGION, 2021-2031 (REVENUE, $MILLION)
    TABLE 14. SOYBEAN MEAL MARKET FOR OTHERS, BY REGION, 2021-2031 (REVENUE, $MILLION)
    TABLE 15. SOYBEAN MEAL MARKET FOR B2B, BY REGION, 2021-2031 (REVENUE, $MILLION)
    TABLE 16. SOYBEAN MEAL MARKET, BY REGION, 2021-2031 (REVENUE, $MILLION)
    TABLE 17. NORTH AMERICA SOYBEAN MEAL MARKET, BY NATURE, 2021-2031 (REVENUE, $MILLION)
    TABLE 18. NORTH AMERICA SOYBEAN MEAL MARKET, BY APPLICATION, 2021-2031 (REVENUE, $MILLION)
    TABLE 19. NORTH AMERICA SOYBEAN MEAL MARKET, BY SALES CHANNEL, 2021-2031 (REVENUE, $MILLION)
    TABLE 20. NORTH AMERICA OFFLINE SOYBEAN MEAL MARKET, BY SUB-TYPE, 2021-2031 (REVENUE, $MILLION)
    TABLE 21. NORTH AMERICA SOYBEAN MEAL MARKET, BY COUNTRY, 2021-2031 (REVENUE, $MILLION)
    TABLE 22. U.S. SOYBEAN MEAL MARKET, BY NATURE, 2021-2031 (REVENUE, $MILLION)
    TABLE 23. U.S. SOYBEAN MEAL MARKET, BY APPLICATION, 2021-2031 (REVENUE, $MILLION)
    TABLE 24. U.S. SOYBEAN MEAL MARKET, BY SALES CHANNEL, 2021-2031 (REVENUE, $MILLION)
    TABLE 25. CANADA SOYBEAN MEAL MARKET, BY NATURE, 2021-2031 (REVENUE, $MILLION)
    TABLE 26. CANADA SOYBEAN MEAL MARKET, BY APPLICATION, 2021-2031 (REVENUE, $MILLION)
    TABLE 27. CANADA SOYBEAN MEAL MARKET, BY SALES CHANNEL, 2021-2031 (REVENUE, $MILLION)
    TABLE 28. MEXICO SOYBEAN MEAL MARKET, BY NATURE, 2021-2031 (REVENUE, $MILLION)
    TABLE 29. MEXICO SOYBEAN MEAL MARKET, BY APPLICATION, 2021-2031 (REVENUE, $MILLION)
    TABLE 30. MEXICO SOYBEAN MEAL MARKET, BY SALES CHANNEL, 2021-2031 (REVENUE, $MILLION)
    TABLE 31. EUROPE SOYBEAN MEAL MARKET, BY NATURE, 2021-2031 (REVENUE, $MILLION)
    TABLE 32. EUROPE SOYBEAN MEAL MARKET, BY APPLICATION, 2021-2031 (REVENUE, $MILLION)
    TABLE 33. EUROPE SOYBEAN MEAL MARKET, BY SALES CHANNEL, 2021-2031 (REVENUE, $MILLION)
    TABLE 34. EUROPE OFFLINE SOYBEAN MEAL MARKET, BY SUB-TYPE, 2021-2031 (REVENUE, $MILLION)
    TABLE 35. EUROPE SOYBEAN MEAL MARKET, BY COUNTRY, 2021-2031 (REVENUE, $MILLION)
    TABLE 36. GERMANY SOYBEAN MEAL MARKET, BY NATURE, 2021-2031 (REVENUE, $MILLION)
    TABLE 37. GERMANY SOYBEAN MEAL MARKET, BY APPLICATION, 2021-2031 (REVENUE, $MILLION)
    TABLE 38. GERMANY SOYBEAN MEAL MARKET, BY SALES CHANNEL, 2021-2031 (REVENUE, $MILLION)
    TABLE 39. SPAIN SOYBEAN MEAL MARKET, BY NATURE, 2021-2031 (REVENUE, $MILLION)
    TABLE 40. SPAIN SOYBEAN MEAL MARKET, BY APPLICATION, 2021-2031 (REVENUE, $MILLION)
    TABLE 41. SPAIN SOYBEAN MEAL MARKET, BY SALES CHANNEL, 2021-2031 (REVENUE, $MILLION)
    TABLE 42. UK SOYBEAN MEAL MARKET, BY NATURE, 2021-2031 (REVENUE, $MILLION)
    TABLE 43. UK SOYBEAN MEAL MARKET, BY APPLICATION, 2021-2031 (REVENUE, $MILLION)
    TABLE 44. UK SOYBEAN MEAL MARKET, BY SALES CHANNEL, 2021-2031 (REVENUE, $MILLION)
    TABLE 45. ITALY SOYBEAN MEAL MARKET, BY NATURE, 2021-2031 (REVENUE, $MILLION)
    TABLE 46. ITALY SOYBEAN MEAL MARKET, BY APPLICATION, 2021-2031 (REVENUE, $MILLION)
    TABLE 47. ITALY SOYBEAN MEAL MARKET, BY SALES CHANNEL, 2021-2031 (REVENUE, $MILLION)
    TABLE 48. FRANCE SOYBEAN MEAL MARKET, BY NATURE, 2021-2031 (REVENUE, $MILLION)
    TABLE 49. FRANCE SOYBEAN MEAL MARKET, BY APPLICATION, 2021-2031 (REVENUE, $MILLION)
    TABLE 50. FRANCE SOYBEAN MEAL MARKET, BY SALES CHANNEL, 2021-2031 (REVENUE, $MILLION)
    TABLE 51. RUSSIA SOYBEAN MEAL MARKET, BY NATURE, 2021-2031 (REVENUE, $MILLION)
    TABLE 52. RUSSIA SOYBEAN MEAL MARKET, BY APPLICATION, 2021-2031 (REVENUE, $MILLION)
    TABLE 53. RUSSIA SOYBEAN MEAL MARKET, BY SALES CHANNEL, 2021-2031 (REVENUE, $MILLION)
    TABLE 54. FINLAND SOYBEAN MEAL MARKET, BY NATURE, 2021-2031 (REVENUE, $MILLION)
    TABLE 55. FINLAND SOYBEAN MEAL MARKET, BY APPLICATION, 2021-2031 (REVENUE, $MILLION)
    TABLE 56. FINLAND SOYBEAN MEAL MARKET, BY SALES CHANNEL, 2021-2031 (REVENUE, $MILLION)
    TABLE 57. REST OF EUROPE SOYBEAN MEAL MARKET, BY NATURE, 2021-2031 (REVENUE, $MILLION)
    TABLE 58. REST OF EUROPE SOYBEAN MEAL MARKET, BY APPLICATION, 2021-2031 (REVENUE, $MILLION)
    TABLE 59. REST OF EUROPE SOYBEAN MEAL MARKET, BY SALES CHANNEL, 2021-2031 (REVENUE, $MILLION)
    TABLE 60. ASIA-PACIFIC SOYBEAN MEAL MARKET, BY NATURE, 2021-2031 (REVENUE, $MILLION)
    TABLE 61. ASIA-PACIFIC SOYBEAN MEAL MARKET, BY APPLICATION, 2021-2031 (REVENUE, $MILLION)
    TABLE 62. ASIA-PACIFIC SOYBEAN MEAL MARKET, BY SALES CHANNEL, 2021-2031 (REVENUE, $MILLION)
    TABLE 63. ASIA-PACIFIC OFFLINE SOYBEAN MEAL MARKET, BY SUB-TYPE, 2021-2031 (REVENUE, $MILLION)
    TABLE 64. ASIA-PACIFIC SOYBEAN MEAL MARKET, BY COUNTRY, 2021-2031 (REVENUE, $MILLION)
    TABLE 65. CHINA SOYBEAN MEAL MARKET, BY NATURE, 2021-2031 (REVENUE, $MILLION)
    TABLE 66. CHINA SOYBEAN MEAL MARKET, BY APPLICATION, 2021-2031 (REVENUE, $MILLION)
    TABLE 67. CHINA SOYBEAN MEAL MARKET, BY SALES CHANNEL, 2021-2031 (REVENUE, $MILLION)
    TABLE 68. JAPAN SOYBEAN MEAL MARKET, BY NATURE, 2021-2031 (REVENUE, $MILLION)
    TABLE 69. JAPAN SOYBEAN MEAL MARKET, BY APPLICATION, 2021-2031 (REVENUE, $MILLION)
    TABLE 70. JAPAN SOYBEAN MEAL MARKET, BY SALES CHANNEL, 2021-2031 (REVENUE, $MILLION)
    TABLE 71. INDIA SOYBEAN MEAL MARKET, BY NATURE, 2021-2031 (REVENUE, $MILLION)
    TABLE 72. INDIA SOYBEAN MEAL MARKET, BY APPLICATION, 2021-2031 (REVENUE, $MILLION)
    TABLE 73. INDIA SOYBEAN MEAL MARKET, BY SALES CHANNEL, 2021-2031 (REVENUE, $MILLION)
    TABLE 74. INDONESIA SOYBEAN MEAL MARKET, BY NATURE, 2021-2031 (REVENUE, $MILLION)
    TABLE 75. INDONESIA SOYBEAN MEAL MARKET, BY APPLICATION, 2021-2031 (REVENUE, $MILLION)
    TABLE 76. INDONESIA SOYBEAN MEAL MARKET, BY SALES CHANNEL, 2021-2031 (REVENUE, $MILLION)
    TABLE 77. THAILAND SOYBEAN MEAL MARKET, BY NATURE, 2021-2031 (REVENUE, $MILLION)
    TABLE 78. THAILAND SOYBEAN MEAL MARKET, BY APPLICATION, 2021-2031 (REVENUE, $MILLION)
    TABLE 79. THAILAND SOYBEAN MEAL MARKET, BY SALES CHANNEL, 2021-2031 (REVENUE, $MILLION)
    TABLE 80. VIETNAM SOYBEAN MEAL MARKET, BY NATURE, 2021-2031 (REVENUE, $MILLION)
    TABLE 81. VIETNAM SOYBEAN MEAL MARKET, BY APPLICATION, 2021-2031 (REVENUE, $MILLION)
    TABLE 82. VIETNAM SOYBEAN MEAL MARKET, BY SALES CHANNEL, 2021-2031 (REVENUE, $MILLION)
    TABLE 83. PHILIPPINES SOYBEAN MEAL MARKET, BY NATURE, 2021-2031 (REVENUE, $MILLION)
    TABLE 84. PHILIPPINES SOYBEAN MEAL MARKET, BY APPLICATION, 2021-2031 (REVENUE, $MILLION)
    TABLE 85. PHILIPPINES SOYBEAN MEAL MARKET, BY SALES CHANNEL, 2021-2031 (REVENUE, $MILLION)
    TABLE 86. REST OF ASIA-PACIFIC SOYBEAN MEAL MARKET, BY NATURE, 2021-2031 (REVENUE, $MILLION)
    TABLE 87. REST OF ASIA-PACIFIC SOYBEAN MEAL MARKET, BY APPLICATION, 2021-2031 (REVENUE, $MILLION)
    TABLE 88. REST OF ASIA-PACIFIC SOYBEAN MEAL MARKET, BY SALES CHANNEL, 2021-2031 (REVENUE, $MILLION)
    TABLE 89. LAMEA SOYBEAN MEAL MARKET, BY NATURE, 2021-2031 (REVENUE, $MILLION)
    TABLE 90. LAMEA SOYBEAN MEAL MARKET, BY APPLICATION, 2021-2031 (REVENUE, $MILLION)
    TABLE 91. LAMEA SOYBEAN MEAL MARKET, BY SALES CHANNEL, 2021-2031 (REVENUE, $MILLION)
    TABLE 92. LAMEA OFFLINE SOYBEAN MEAL MARKET, BY SUB-TYPE, 2021-2031 (REVENUE, $MILLION)
    TABLE 93. LAMEA SOYBEAN MEAL MARKET, BY COUNTRY, 2021-2031 (REVENUE, $MILLION)
    TABLE 94. BRAZIL SOYBEAN MEAL MARKET, BY NATURE, 2021-2031 (REVENUE, $MILLION)
    TABLE 95. BRAZIL SOYBEAN MEAL MARKET, BY APPLICATION, 2021-2031 (REVENUE, $MILLION)
    TABLE 96. BRAZIL SOYBEAN MEAL MARKET, BY SALES CHANNEL, 2021-2031 (REVENUE, $MILLION)
    TABLE 97. ARGENTINA SOYBEAN MEAL MARKET, BY NATURE, 2021-2031 (REVENUE, $MILLION)
    TABLE 98. ARGENTINA SOYBEAN MEAL MARKET, BY APPLICATION, 2021-2031 (REVENUE, $MILLION)
    TABLE 99. ARGENTINA SOYBEAN MEAL MARKET, BY SALES CHANNEL, 2021-2031 (REVENUE, $MILLION)
    TABLE 100. SOUTH AFRICA SOYBEAN MEAL MARKET, BY NATURE, 2021-2031 (REVENUE, $MILLION)
    TABLE 101. SOUTH AFRICA SOYBEAN MEAL MARKET, BY APPLICATION, 2021-2031 (REVENUE, $MILLION)
    TABLE 102. SOUTH AFRICA SOYBEAN MEAL MARKET, BY SALES CHANNEL, 2021-2031 (REVENUE, $MILLION)
    TABLE 103. SAUDI ARABIA SOYBEAN MEAL MARKET, BY NATURE, 2021-2031 (REVENUE, $MILLION)
    TABLE 104. SAUDI ARABIA SOYBEAN MEAL MARKET, BY APPLICATION, 2021-2031 (REVENUE, $MILLION)
    TABLE 105. SAUDI ARABIA SOYBEAN MEAL MARKET, BY SALES CHANNEL, 2021-2031 (REVENUE, $MILLION)
    TABLE 106. REST OF LAMEA SOYBEAN MEAL MARKET, BY NATURE, 2021-2031 (REVENUE, $MILLION)
    TABLE 107. REST OF LAMEA SOYBEAN MEAL MARKET, BY APPLICATION, 2021-2031 (REVENUE, $MILLION)
    TABLE 108. REST OF LAMEA SOYBEAN MEAL MARKET, BY SALES CHANNEL, 2021-2031 (REVENUE, $MILLION)
    TABLE 109. MAHESH AGRO FOOD INDUSTRIES: KEY EXECUTIVES
    TABLE 110. MAHESH AGRO FOOD INDUSTRIES: COMPANY SNAPSHOT
    TABLE 111. MAHESH AGRO FOOD INDUSTRIES: OPERATING SEGMENTS
    TABLE 112. MAHESH AGRO FOOD INDUSTRIES: PRODUCT PORTFOLIO
    TABLE 113. MAHESH AGRO FOOD INDUSTRIES: NET SALES
    TABLE 114. MAHESH AGRO FOOD INDUSTRIES: KEY STRATERGIES
    TABLE 115. LOUIS DREYFUS COMPANY B.V.: KEY EXECUTIVES
    TABLE 116. LOUIS DREYFUS COMPANY B.V.: COMPANY SNAPSHOT
    TABLE 117. LOUIS DREYFUS COMPANY B.V.: OPERATING SEGMENTS
    TABLE 118. LOUIS DREYFUS COMPANY B.V.: PRODUCT PORTFOLIO
    TABLE 119. LOUIS DREYFUS COMPANY B.V.: NET SALES
    TABLE 120. LOUIS DREYFUS COMPANY B.V.: KEY STRATERGIES
    TABLE 121. BUNGE LIMITED: KEY EXECUTIVES
    TABLE 122. BUNGE LIMITED: COMPANY SNAPSHOT
    TABLE 123. BUNGE LIMITED: OPERATING SEGMENTS
    TABLE 124. BUNGE LIMITED: PRODUCT PORTFOLIO
    TABLE 125. BUNGE LIMITED: NET SALES
    TABLE 126. BUNGE LIMITED: KEY STRATERGIES
    TABLE 127. MAMTA HYGIENE PRODUCTS PVT LTD: KEY EXECUTIVES
    TABLE 128. MAMTA HYGIENE PRODUCTS PVT LTD: COMPANY SNAPSHOT
    TABLE 129. MAMTA HYGIENE PRODUCTS PVT LTD: OPERATING SEGMENTS
    TABLE 130. MAMTA HYGIENE PRODUCTS PVT LTD: PRODUCT PORTFOLIO
    TABLE 131. MAMTA HYGIENE PRODUCTS PVT LTD: NET SALES
    TABLE 132. MAMTA HYGIENE PRODUCTS PVT LTD: KEY STRATERGIES
    TABLE 133. NORDIC SOYA LTD.: KEY EXECUTIVES
    TABLE 134. NORDIC SOYA LTD.: COMPANY SNAPSHOT
    TABLE 135. NORDIC SOYA LTD.: OPERATING SEGMENTS
    TABLE 136. NORDIC SOYA LTD.: PRODUCT PORTFOLIO
    TABLE 137. NORDIC SOYA LTD.: NET SALES
    TABLE 138. NORDIC SOYA LTD.: KEY STRATERGIES
    TABLE 139. MUKWANO INDUSTRIES UGANDA LTD.: KEY EXECUTIVES
    TABLE 140. MUKWANO INDUSTRIES UGANDA LTD.: COMPANY SNAPSHOT
    TABLE 141. MUKWANO INDUSTRIES UGANDA LTD.: OPERATING SEGMENTS
    TABLE 142. MUKWANO INDUSTRIES UGANDA LTD.: PRODUCT PORTFOLIO
    TABLE 143. MUKWANO INDUSTRIES UGANDA LTD.: NET SALES
    TABLE 144. MUKWANO INDUSTRIES UGANDA LTD.: KEY STRATERGIES
    TABLE 145. GUJARAT AMBUJA EXPORTS LIMITED: KEY EXECUTIVES
    TABLE 146. GUJARAT AMBUJA EXPORTS LIMITED: COMPANY SNAPSHOT
    TABLE 147. GUJARAT AMBUJA EXPORTS LIMITED: OPERATING SEGMENTS
    TABLE 148. GUJARAT AMBUJA EXPORTS LIMITED: PRODUCT PORTFOLIO
    TABLE 149. GUJARAT AMBUJA EXPORTS LIMITED: NET SALES
    TABLE 150. GUJARAT AMBUJA EXPORTS LIMITED: KEY STRATERGIES
    TABLE 151. ADAMPOLSOYA: KEY EXECUTIVES
    TABLE 152. ADAMPOLSOYA: COMPANY SNAPSHOT
    TABLE 153. ADAMPOLSOYA: OPERATING SEGMENTS
    TABLE 154. ADAMPOLSOYA: PRODUCT PORTFOLIO
    TABLE 155. ADAMPOLSOYA: NET SALES
    TABLE 156. ADAMPOLSOYA: KEY STRATERGIES
    TABLE 157. WUDI DEDA AGRICULTURE CO. LIMITED: KEY EXECUTIVES
    TABLE 158. WUDI DEDA AGRICULTURE CO. LIMITED: COMPANY SNAPSHOT
    TABLE 159. WUDI DEDA AGRICULTURE CO. LIMITED: OPERATING SEGMENTS
    TABLE 160. WUDI DEDA AGRICULTURE CO. LIMITED: PRODUCT PORTFOLIO
    TABLE 161. WUDI DEDA AGRICULTURE CO. LIMITED: NET SALES
    TABLE 162. WUDI DEDA AGRICULTURE CO. LIMITED: KEY STRATERGIES
    TABLE 163. AGROCORP INTERNATIONAL PTE LTD: KEY EXECUTIVES
    TABLE 164. AGROCORP INTERNATIONAL PTE LTD: COMPANY SNAPSHOT
    TABLE 165. AGROCORP INTERNATIONAL PTE LTD: OPERATING SEGMENTS
    TABLE 166. AGROCORP INTERNATIONAL PTE LTD: PRODUCT PORTFOLIO
    TABLE 167. AGROCORP INTERNATIONAL PTE LTD: NET SALES
    TABLE 168. AGROCORP INTERNATIONAL PTE LTD: KEY STRATERGIES
    TABLE 169. SHAFER COMMODITIES INC.: KEY EXECUTIVES
    TABLE 170. SHAFER COMMODITIES INC.: COMPANY SNAPSHOT
    TABLE 171. SHAFER COMMODITIES INC.: OPERATING SEGMENTS
    TABLE 172. SHAFER COMMODITIES INC.: PRODUCT PORTFOLIO
    TABLE 173. SHAFER COMMODITIES INC.: NET SALES
    TABLE 174. SHAFER COMMODITIES INC.: KEY STRATERGIES
    TABLE 175. DENOFA AS: KEY EXECUTIVES
    TABLE 176. DENOFA AS: COMPANY SNAPSHOT
    TABLE 177. DENOFA AS: OPERATING SEGMENTS
    TABLE 178. DENOFA AS: PRODUCT PORTFOLIO
    TABLE 179. DENOFA AS: NET SALES
    TABLE 180. DENOFA AS: KEY STRATERGIES
    TABLE 181. KOHINOOR FEEDS AND FATS LTD.: KEY EXECUTIVES
    TABLE 182. KOHINOOR FEEDS AND FATS LTD.: COMPANY SNAPSHOT
    TABLE 183. KOHINOOR FEEDS AND FATS LTD.: OPERATING SEGMENTS
    TABLE 184. KOHINOOR FEEDS AND FATS LTD.: PRODUCT PORTFOLIO
    TABLE 185. KOHINOOR FEEDS AND FATS LTD.: NET SALES
    TABLE 186. KOHINOOR FEEDS AND FATS LTD.: KEY STRATERGIES
    TABLE 187. MINNESOTA SOYBEAN PROCESSORS.: KEY EXECUTIVES
    TABLE 188. MINNESOTA SOYBEAN PROCESSORS.: COMPANY SNAPSHOT
    TABLE 189. MINNESOTA SOYBEAN PROCESSORS.: OPERATING SEGMENTS
    TABLE 190. MINNESOTA SOYBEAN PROCESSORS.: PRODUCT PORTFOLIO
    TABLE 191. MINNESOTA SOYBEAN PROCESSORS.: NET SALES
    TABLE 192. MINNESOTA SOYBEAN PROCESSORS.: KEY STRATERGIES
    TABLE 193. GRANOL INDSTRIA COMRCIO E EXPORTAO S/A: KEY EXECUTIVES
    TABLE 194. GRANOL INDSTRIA COMRCIO E EXPORTAO S/A: COMPANY SNAPSHOT
    TABLE 195. GRANOL INDSTRIA COMRCIO E EXPORTAO S/A: OPERATING SEGMENTS
    TABLE 196. GRANOL INDSTRIA COMRCIO E EXPORTAO S/A: PRODUCT PORTFOLIO
    TABLE 197. GRANOL INDSTRIA COMRCIO E EXPORTAO S/A: NET SALES
    TABLE 198. GRANOL INDSTRIA COMRCIO E EXPORTAO S/A: KEY STRATERGIES
    TABLE 199. DHN INTERNATIONAL: KEY EXECUTIVES
    TABLE 200. DHN INTERNATIONAL: COMPANY SNAPSHOT
    TABLE 201. DHN INTERNATIONAL: OPERATING SEGMENTS
    TABLE 202. DHN INTERNATIONAL: PRODUCT PORTFOLIO
    TABLE 203. DHN INTERNATIONAL: NET SALES
    TABLE 204. DHN INTERNATIONAL: KEY STRATERGIES
    TABLE 205. GAURI AGROTECH PRODUCTS PVT. LTD.: KEY EXECUTIVES
    TABLE 206. GAURI AGROTECH PRODUCTS PVT. LTD.: COMPANY SNAPSHOT
    TABLE 207. GAURI AGROTECH PRODUCTS PVT. LTD.: OPERATING SEGMENTS
    TABLE 208. GAURI AGROTECH PRODUCTS PVT. LTD.: PRODUCT PORTFOLIO
    TABLE 209. GAURI AGROTECH PRODUCTS PVT. LTD.: NET SALES
    TABLE 210. GAURI AGROTECH PRODUCTS PVT. LTD.: KEY STRATERGIES
    TABLE 211. THE SCOULAR COMPANY: KEY EXECUTIVES
    TABLE 212. THE SCOULAR COMPANY: COMPANY SNAPSHOT
    TABLE 213. THE SCOULAR COMPANY: OPERATING SEGMENTS
    TABLE 214. THE SCOULAR COMPANY: PRODUCT PORTFOLIO
    TABLE 215. THE SCOULAR COMPANY: NET SALES
    TABLE 216. THE SCOULAR COMPANY: KEY STRATERGIES
    TABLE 217. CHS INC.: KEY EXECUTIVES
    TABLE 218. CHS INC.: COMPANY SNAPSHOT
    TABLE 219. CHS INC.: OPERATING SEGMENTS
    TABLE 220. CHS INC.: PRODUCT PORTFOLIO
    TABLE 221. CHS INC.: NET SALES
    TABLE 222. CHS INC.: KEY STRATERGIES
    TABLE 223. KEMIN INDUSTRIES, INC.: KEY EXECUTIVES
    TABLE 224. KEMIN INDUSTRIES, INC.: COMPANY SNAPSHOT
    TABLE 225. KEMIN INDUSTRIES, INC.: OPERATING SEGMENTS
    TABLE 226. KEMIN INDUSTRIES, INC.: PRODUCT PORTFOLIO
    TABLE 227. KEMIN INDUSTRIES, INC.: NET SALES
    TABLE 228. KEMIN INDUSTRIES, INC.: KEY STRATERGIES
  • LIST OF FIGURES

  • FIGURE 1. SEGMENTATION OF SOYBEAN MEAL MARKET,2021-2031
    FIGURE 2.SOYBEAN MEAL MARKET,2021-2031
    FIGURE 3. TOP INVESTMENT POCKETS, BY REGION
    FIGURE 4.PORTER FIVE-1
    FIGURE 5.PORTER FIVE-2
    FIGURE 6.PORTER FIVE-3
    FIGURE 7.PORTER FIVE-4
    FIGURE 8.PORTER FIVE-5
    FIGURE 9.SOYBEAN MEAL MARKET:DRIVERS, RESTRAINTS AND OPPORTUNITIES
    FIGURE 10.MARKET SHARE ANALYSIS
    FIGURE 11.VALUE CHAIN ANALYSIS
    FIGURE 12.SOYBEAN MEAL MARKET,BY NATURE,2021(%)
    FIGURE 13.COMPARATIVE SHARE ANALYSIS OF ORGANIC SOYBEAN MEAL MARKET, 2021 AND 2031(%)
    FIGURE 14.COMPARATIVE SHARE ANALYSIS OF CONVENTIONAL SOYBEAN MEAL MARKET, 2021 AND 2031(%)
    FIGURE 15.SOYBEAN MEAL MARKET,BY APPLICATION,2021(%)
    FIGURE 16.COMPARATIVE SHARE ANALYSIS OF FOOD INDUSTRY SOYBEAN MEAL MARKET, 2021 AND 2031(%)
    FIGURE 17.COMPARATIVE SHARE ANALYSIS OF ANIMAL FEED INDUSTRY SOYBEAN MEAL MARKET, 2021 AND 2031(%)
    FIGURE 18.COMPARATIVE SHARE ANALYSIS OF PHARMACEUTICAL SOYBEAN MEAL MARKET, 2021 AND 2031(%)
    FIGURE 19.SOYBEAN MEAL MARKET,BY SALES CHANNEL,2021(%)
    FIGURE 20.COMPARATIVE SHARE ANALYSIS OF ONLINE SOYBEAN MEAL MARKET, 2021 AND 2031(%)
    FIGURE 21.COMPARATIVE SHARE ANALYSIS OF OFFLINE SOYBEAN MEAL MARKET, 2021 AND 2031(%)
    FIGURE 22.COMPARATIVE SHARE ANALYSIS OF B2B SOYBEAN MEAL MARKET, 2021 AND 2031(%)
    FIGURE 23.SOYBEAN MEAL MARKET BY REGION,2021
    FIGURE 24.U.S. SOYBEAN MEAL MARKET,2021-2031($MILLION)
    FIGURE 25.CANADA SOYBEAN MEAL MARKET,2021-2031($MILLION)
    FIGURE 26.MEXICO SOYBEAN MEAL MARKET,2021-2031($MILLION)
    FIGURE 27.GERMANY SOYBEAN MEAL MARKET,2021-2031($MILLION)
    FIGURE 28.SPAIN SOYBEAN MEAL MARKET,2021-2031($MILLION)
    FIGURE 29.UK SOYBEAN MEAL MARKET,2021-2031($MILLION)
    FIGURE 30.ITALY SOYBEAN MEAL MARKET,2021-2031($MILLION)
    FIGURE 31.FRANCE SOYBEAN MEAL MARKET,2021-2031($MILLION)
    FIGURE 32.RUSSIA SOYBEAN MEAL MARKET,2021-2031($MILLION)
    FIGURE 33.FINLAND SOYBEAN MEAL MARKET,2021-2031($MILLION)
    FIGURE 34.REST OF EUROPE SOYBEAN MEAL MARKET,2021-2031($MILLION)
    FIGURE 35.CHINA SOYBEAN MEAL MARKET,2021-2031($MILLION)
    FIGURE 36.JAPAN SOYBEAN MEAL MARKET,2021-2031($MILLION)
    FIGURE 37.INDIA SOYBEAN MEAL MARKET,2021-2031($MILLION)
    FIGURE 38.INDONESIA SOYBEAN MEAL MARKET,2021-2031($MILLION)
    FIGURE 39.THAILAND SOYBEAN MEAL MARKET,2021-2031($MILLION)
    FIGURE 40.VIETNAM SOYBEAN MEAL MARKET,2021-2031($MILLION)
    FIGURE 41.PHILIPPINES SOYBEAN MEAL MARKET,2021-2031($MILLION)
    FIGURE 42.REST OF ASIA-PACIFIC SOYBEAN MEAL MARKET,2021-2031($MILLION)
    FIGURE 43.BRAZIL SOYBEAN MEAL MARKET,2021-2031($MILLION)
    FIGURE 44.ARGENTINA SOYBEAN MEAL MARKET,2021-2031($MILLION)
    FIGURE 45.SOUTH AFRICA SOYBEAN MEAL MARKET,2021-2031($MILLION)
    FIGURE 46.SAUDI ARABIA SOYBEAN MEAL MARKET,2021-2031($MILLION)
    FIGURE 47.REST OF LAMEA SOYBEAN MEAL MARKET,2021-2031($MILLION)
    FIGURE 48. TOP WINNING STRATEGIES, BY YEAR
    FIGURE 49. TOP WINNING STRATEGIES, BY DEVELOPMENT
    FIGURE 50. TOP WINNING STRATEGIES, BY COMPANY
    FIGURE 51.PRODUCT MAPPING OF TOP 10 PLAYERS
    FIGURE 52.COMPETITIVE DASHBOARD
    FIGURE 53.COMPETITIVE HEATMAP OF TOP 10 KEY PLAYERS
    FIGURE 54.TOP PLAYER POSITIONING, 2021
    FIGURE 55.DHN INTERNATIONAL.: NET SALES ($MILLION)
    FIGURE 56.MAMTA HYGIENE PRODUCTS PVT LTD.: NET SALES ($MILLION)
    FIGURE 57.LOUIS DREYFUS COMPANY B.V..: NET SALES ($MILLION)
    FIGURE 58.MAHESH AGRO FOOD INDUSTRIES (MAFI GROUP).: NET SALES ($MILLION)
    FIGURE 59.BUNGE LIMITED.: NET SALES ($MILLION)
    FIGURE 60.GUJARAT AMBUJA EXPORTS LIMITED.: NET SALES ($MILLION)
    FIGURE 61.ADAMPOLSOYA.: NET SALES ($MILLION)
    FIGURE 62.SHAFER COMMODITIES INC..: NET SALES ($MILLION)
    FIGURE 63.WUDI DEDA AGRICULTURE CO. LIMITED.: NET SALES ($MILLION)
    FIGURE 64.MUKWANO INDUSTRIES UGANDA LTD..: NET SALES ($MILLION)
    FIGURE 65.GAURI AGROTECH PRODUCTS PVT. LTD..: NET SALES ($MILLION)
    FIGURE 66.AGROCORP INTERNATIONAL PTE LTD.: NET SALES ($MILLION)
    FIGURE 67.DENOFA AS.: NET SALES ($MILLION)
    FIGURE 68.KOHINOOR FEEDS AND FATS LTD..: NET SALES ($MILLION)
    FIGURE 69.THE SCOULAR COMPANY.: NET SALES ($MILLION)
    FIGURE 70.CHS INC..: NET SALES ($MILLION)
    FIGURE 71.KEMIN INDUSTRIES, INC..: NET SALES ($MILLION)
    FIGURE 72.MINNESOTA SOYBEAN PROCESSORS..: NET SALES ($MILLION)
    FIGURE 73.GRANOL INDSTRIA COMRCIO E EXPORTAO S/A.: NET SALES ($MILLION)
    FIGURE 74.NORDIC SOYA LTD..: NET SALES ($MILLION)


According to the insights of the CXOs, the soybean meal market is expected to witness robust growth during the forecast period. This is attributed to an increase in disposable income in developing countries, a change in the lifestyle of consumers, and an increase in awareness of the health benefits of soybean meal such as the higher composition of protein content and lower carbohydrates. Moreover, the rise in demand for soybean meal among infant food companies has fueled the growth of the global soybean meal market.

CXO further added that the demand for plant-based protein has surged with the growth in awareness regarding well-being among consumers, which is generally promoted by the growing online health sector or by the local key players either by advertisement or by counseling their customers in person regarding the benefits of their products over their health. As the knowledge regarding nutritional deficiency is still very less among consumers, spreading awareness is still necessary for developing countries, which are highly affected.

Furthermore, the key manufacturers added that the availability of counterfeit soybean meal and easy availability of its substitutes in the market at competitive prices are the factors projected to hamper the growth of the market during the forecast period.

PURCHASE OPTIONS

Call or Email us

U.S.-Canada Toll-free: +1-800-792-5285
Int'l : +1-503-894-6022
Europe : +44-845-528-1300
Email : help@alliedmarketresearch.com
 
FREQUENTLY ASKED QUESTIONS?

A. The global soybean meal market size was valued at $59,206.6 million in 2021, and is projected to reach $94,150.2 million by 2031, registering a CAGR of 4.9% from 2022 to 2031.

A. The forecast period in the soybean meal market report is 2022 to 2031.

A. The base year calculated in the soybean meal market report is 2021.

A. The top companies analyzed for global soybean meal market report are Mahesh Agro Food Industries, Louis Dreyfus Company B.V., Bunge Limited, Mamta Hygiene Products Pvt. Ltd., Nordic Soya Ltd., Mukwano Industries Uganda Ltd., Gujarat Ambuja Exports Limited, AdamPolSoya, Wudi Deda Agriculture Co. Ltd., Agrocorp International Pte Ltd, Shafer Commodities Inc., Denofa AS, Kohinoor Feeds and Fats Ltd., Minnesota Soybean Processors, Granol Indstria Comrcio e Exportao S/A, DHN International, Gauri Agrotech Products Pvt. Ltd., The Scoular Company, CHS Inc., and Kemin Industries, Inc.

A. The conventional segment is the most influential segment in the soybean meal market report.

A. Asia-Pacific holds the maximum market share of the soybean meal market.

A. The company profile has been selected on the basis of key developments such as partnership, product launch, merger and acquisition.

A. The market value of the soybean meal market in 2021 was $59,206.6 million.

Looking for Customization?

 Customization Request

Have a Question?

 Speak with Analyst

Any Confusion?

 Inquire Before Buying

Have a glance of the Report

  Request Sample
RELATED TAGS

Purchase Full Report of
Soybean Meal Market

Start reading instantly.
This Report and over 67,404+ more Reports, Available with Avenue Library. T&C*.

  • Online Only
  • $3,570
  • Online cloud access only
  • Restricted print, copy, paste & download
  • Read only
  • Free industry update
    (Within 180 days)
  • Free report update in next update cycle
    (Jan 2024 - Jan 2025)
  • Data Pack
  • $3,840
  • Restricted to one authorized user
  • One print only
  • Available in
    Excel
  • Free industry update
    (Within 180 days)
  •   Free report update in next update cycle
    (Jan 2024 - Jan 2025)
  • Single User
  • $5,730
  • Restricted to one authorized user
  • One print only
  • Available in
    PDF
  • Free industry update
    (Within 180 days)
  •   Free report update in next update cycle
    (Jan 2024 - Jan 2025)
  • Five Users
  • $6,450
  • Limited to five authorized users
  • Print upto five copies
  • Available in
    PDF
  • Free industry update
    (Within 180 days)
  •   Free report update in next update cycle
    (Jan 2024 - Jan 2025)
  • Enterprise
    License/PDF

  • $9,600
  • Unlimited
    within
    company/enterprise
  • Available in Excel & PDF
  • Free industry update
    (Within 180 days)
  •   Free report update in next update cycle
    (Jan 2024 - Jan 2025)
  • Library
    Membership

  • $999 $ 1,175
    Per User/ Per month/ Billed annually
  • Published Content
    E-access
  • Company Profiles
    E-access
  • Newly Added Content Access
  • 10 PDF
    Downloads
  • 5 Excel Data
    Pack Downloads
  • 250 Company Profiles PDF Downloads
  • Buy Now

*Taxes/Fees, if applicable will be added during checkout. All prices in USD

RELATED REPORTS
 

Why Allied Market Research?


Infallible Methodology

To ensure high-level data integrity, accurate analysis, and impeccable forecasts

Analyst Support

For complete satisfaction

Customization

On-demand customization of scope of the report to exactly meet your needs

TARGETED MARKET VIEW

Targeted market view to provide pertinent information and save time of readers

Get fresh content delivered

Get insights on topics that are crucial for your business. Stay abreast of your interest areas.

Get Industry Data Alerts

Why Allied Market Research?

Infallible Methodology

To ensure high-level data integrity, accurate analysis, and impeccable forecasts

Analyst Support

For complete satisfaction

Customization

On-demand customization of scope of the report to exactly meet your needs

TARGETED MARKET VIEW

Targeted market view to provide pertinent information and save time of readers