
Sports Equipment And Apparel Market Research, 2034
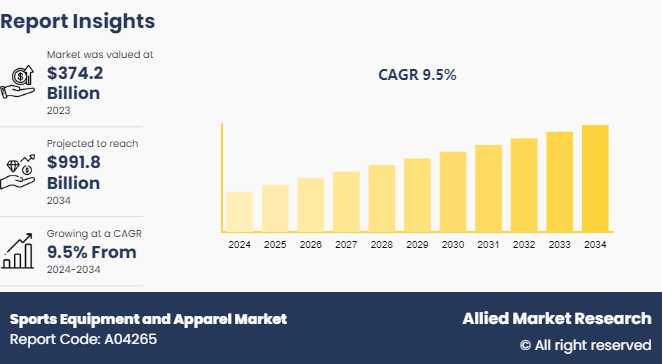
The global sports equipment and apparel market was valued at $374.2 billion in 2023, and is projected to reach $991.8 billion by 2034, growing at a CAGR of 9.5% from 2024 to 2034.
Market Introduction and Definition
Sports equipment and apparel refer to the tools, gear, and clothing specifically designed and used for various sports and physical activities. Equipment includes items such as balls, bats, rackets, goalposts, and protective gear such as helmets and pads. Such equipment tends to be essential for engaging in specific sports, aiding performance, safety, and adherence to rules. Apparel consists of clothing tailored for sports, ranging from jerseys and shorts to specialized footwear and accessories such as gloves or caps. The design and materials used in sports apparel prioritize comfort, breathability, flexibility, and moisture-wicking properties to enhance athletes' performance and endurance while providing protection from environmental elements. Thus, sports equipment and apparel contribute significantly to the ability of athletes to compete effectively, stay safe, and enjoy their chosen sports or activities.
Key Takeaways
The sports equipment and apparel market study covers 20 countries. The research includes a segment analysis of each country in terms of value ($Million) for the projected period 2024-2034.
More than 1, 500 product literatures, industry releases, annual reports, and other such documents of major sports equipment and apparel industry participants along with authentic industry journals, trade associations' releases, and government websites have been reviewed for generating high-value industry insights.
The study integrated high-quality data, professional opinions and analysis, and critical independent perspectives. The research approach is intended to provide a balanced view of global markets and to assist stakeholders in making educated decisions in order to achieve their most ambitious growth objectives.
Key Market Dynamics
The increase in health and fitness awareness has significantly surged the global sports equipment and apparel market demand. As more people prioritize physical well-being, there is a growth in demand for specialized gear and clothing tailored to various sports and fitness activities. For instance, the popularity of activities such as yoga, running, and cycling has led to increased sales of related apparel such as moisture-wicking fabrics, compression wear, and specialized footwear designed for optimal performance and comfort. Moreover, the rise of fitness trends such as CrossFit and high-intensity interval training (HIIT) has driven the demand for durable and versatile equipment such as kettlebells, resistance bands, and functional training gear.
In addition, the awareness of the benefits of outdoor activities and sports participation has boosted sales of equipment such as hiking gear, camping essentials, and outdoor sports apparel. The trend toward a healthier lifestyle has expanded the consumer base and spurred innovation in sports technology and sustainable materials, further fueling the sports equipment and apparel market growth.
However, the high cost of advanced sports equipment acts as a significant restraint on the market demand for global sports equipment and apparel. Many technologically advanced products, such as high-performance carbon fiber bicycles, advanced GPS sports watches, or cutting-edge golf clubs, come with substantial price tags that may deter budget-conscious consumers. The pricing barrier limits accessibility to these products, particularly for amateur athletes or those new to a sport who may not be willing to invest heavily. Moreover, the cost of specialized gear and apparel for niche sports or activities is usually high-priced, which reduces the potential customer base. In addition, the high costs associated with maintaining and upgrading equipment, such as replacing worn-out gear or updating software in smart sports devices, further contribute to financial burdens on consumers. As a result, while advanced sports equipment offers enhanced performance and features, its high cost often restraints broader market penetration and adoption, impacting overall sports equipment and apparel market demand.
Furthermore, innovation in sustainable and eco-friendly products has created numerous opportunities in the global sports equipment and apparel market. Consumers increasingly prefer products that minimize their ecological footprint as there is a rise in environmental concerns. Companies are responding by developing sports equipment and apparel made from recycled materials, organic fabrics, and biodegradable components. For instance, there is a rise in demand for eco-friendly yoga mats made from natural rubber or recycled materials, as well as running shoes crafted from sustainable textiles such as bamboo or recycled plastics. Brands are also integrating sustainable practices into their manufacturing processes, such as using energy-efficient production methods and reducing water consumption, which led to increase in sports equipment and apparel market growth.
Moreover, the emphasis on sustainability appeals to environmentally conscious consumers and also enhances brand reputation and attracts a broader customer base. By aligning with global sustainability goals and consumer preferences, innovative eco-friendly products are expected to drive growth, foster innovation, and open new market opportunities in the sports equipment and apparel industry.
Value Chain of Global Sports Equipment and Apparel Market

The global sports equipment and apparel market value chain encompasses several critical stages which includes design, sourcing, manufacturing, distribution, and retail. Leading brands initiate the process by conceptualizing innovative products, often collaborating with athletes to ensure peak performance. Raw materials are sourced from around the world, with a growing emphasis on performance fabrics and sustainable options. Manufacturing, which can occur in-house or through contracted facilities mainly in Asia, demands rigorous quality control and compliance.
However, distribution networks are complex in nature, which involves logistics partners, warehouses, and sophisticated inventory management systems. Retail channels range from brand-owned stores and sporting goods chains to department stores and e-commerce platforms. Throughout the chain, marketing and branding are essential, which make use of sponsorships and digital strategies to engage consumers. Post-sale, robust customer service and warranty support ensure customer satisfaction. Sustainability initiatives and technological advancements, such as 3D printing and smart wearables, are increasingly shaping the value chain, which clearly reflects the evolving priorities of the industry.
Market Segmentation
The sports equipment and apparel market is segmented on the basis of product type, sports type, distribution channel, and region. By product type, the market is categorized into equipment and apparel & shoes. By sports type, it is classified into bike, outdoor, tennis, other racket sports, running, fitness, football/soccer, other team sports, winter sports, watersports, and others. On the basis of distribution channel, it is divided into online and offline. Region wise, the market is analyzed across North America, Europe, Asia-Pacific, and LAMEA.
Regional/Country Market Outlook
The demand for sports equipment and apparel in the U.S. market is robust and diverse, driven by a combination of factors including increase in participation in sports and fitness activities, growth in health and wellness trends, and the popularity of athleisure wear. Consumers in the U.S. are interested on staying active and often invest in high-quality gear and apparel to support their lifestyles. Major sports such as basketball, football, baseball, and soccer contribute significantly to equipment sales, while activities such as running, cycling, and fitness training boost the demand for specialized apparel and accessories. The market is also influenced by trends in fashion and technology, with innovations such as smart clothing and wearable fitness trackers gaining traction. Thus, the U.S. sports equipment and apparel market remains dynamic and competitive, catering to a diverse range of sports enthusiasts and athletes.
In the European market, there is a rise in demand for sports equipment and apparel driven by several factors unique to the region. Countries such as Germany, France, and the UK have a strong sporting culture with high participation rates in various sports and fitness activities. Urbanization and the increase in disposable incomes contribute to a growing consumer base willing to invest in quality sports equipment and apparel. Moreover, the trend toward healthier lifestyles and the popularity of outdoor activities such as hiking, cycling, and skiing further stimulate demand for sports equipment and apparel market share in the region. The European market also places a focus on innovation and sustainability, with consumers showing a preference for eco-friendly and technologically advanced products. E-commerce growth has made it easier for consumers to access a wide range of sports products, contributing to increased sports equipment and apparel market size.
Industry Trends:
One prominent trend in the sports equipment and apparel market is the rise in demand for personalized products and custom-fit gear, facilitated by advancements in manufacturing technologies such as 3D printing and AI-driven design. These innovations allow manufacturers to create products tailored to individual preferences and specific body measurements. For instance, companies have started to use 3D printing to produce customized running shoe midsoles that conform precisely to a runner's foot shape, providing optimal comfort and performance. Similarly, AI-driven design tools analyze data from athletes to create bespoke apparel that enhances flexibility, breathability, and aerodynamics based on their unique movement patterns. The trend enhances user experience by offering superior fit and performance, along with a shift toward consumer-centric manufacturing in the sports equipment and apparel industry, catering to individual needs and preferences.
In the sports equipment and apparel market, a significant trend is the expansion of online retail channels, digital marketing strategies, and virtual try-on experiences aimed at enhancing accessibility and engaging tech-savvy consumers. E-commerce platforms have grown exponentially, offering a wider array of products and competitive pricing, thus broadening market reach beyond physical stores. Leading brands such as Nike and Adidas utilize sophisticated digital marketing campaigns, leveraging social media and influencer partnerships to connect with a global audience effectively. Concurrently, virtual try-on technologies allow shoppers to visualize how apparel and gear will fit and look, improving the online shopping experience and reducing returns. These trends highlight a digital transformation in the industry, which emphasizes convenience, interactivity, and personalized consumer engagement as key drivers of market growth and customer satisfaction.
Competitive Landscape
The major players operating in the sports equipment and apparel market include Adidas AG, Asics Corporation, Decathlon S.A., Fila Holdings Corp., New Balance, Nike Inc., Puma Se, The Gap, Inc., Under Armour, Inc, and VF Corporation.
Other players in sports equipment and apparel market include Lululemon Athletica, Anta Sports Products Limited, Callaway Golf Company, Columbia Sportswear Company, Descente Ltd., Diamondback Fitness, Dick's Sporting Goods, Inc., Dunlop Sports, Easton-Bell Sports, Inc., Etonic, Inc., Head N.V., Jarden Corporation, K-Swiss Inc., Li Ning Company Limited, Mizuno Corporation, Polo Ralph Lauren Corporation, and so on.
Recent Key Strategies and Developments
In June 2023, JD Sports acquired an 80% stake in Deporvillage, an online retailer of outdoor sporting equipment, to strengthen its presence in the online sports equipment market?.
In March 2023, DICK'S Sporting Goods launched VRST, a new men's athletic apparel brand to target the demand of modern active men. The launch represents DICK'S expansion in the activewear market, focusing on versatile and stylish athletic wear?
In May 2022, Adidas and Foot Locker announced a partnership to focus on product innovation, advanced experiences, and deeper consumer connectivity. The partnership positions Foot Locker as the lead partner for Adidas in the basketball category and involves expanding key franchises across women's, kids', and apparel?.
In March 2022, Adidas announced the formal completion of its divestiture of Reebok to Authentic Brands Group (ABG) . Adidas was expected to continue to operate the business on behalf of ABG during the transition period before fully transferring to ABG's partners later in 2023.
Key Sources Referred
Euromonitor International
NPD Group
Sporting Goods Intelligence
Sports & Fitness Industry Association (SFIA)
United States International Trade Commission (USITC)
Office of Textiles and Apparel (OTEXA)
U.S. Department of Commerce's Bureau of Economic Analysis (BEA) SGB Media
SGI Europe
Sporting Goods Business
SGB Media
Key Benefits For Stakeholders
- This report provides a quantitative analysis of the market segments, current trends, estimations, and dynamics of the sports equipment and apparel market analysis from 2024 to 2034 to identify the prevailing sports equipment and apparel market opportunities.
- The market research is offered along with information related to key drivers, restraints, and opportunities.
- Porter's five forces analysis highlights the potency of buyers and suppliers to enable stakeholders make profit-oriented business decisions and strengthen their supplier-buyer network.
- In-depth analysis of the sports equipment and apparel market segmentation assists to determine the prevailing market opportunities.
- Major countries in each region are mapped according to their revenue contribution to the global market.
- Market player positioning facilitates benchmarking and provides a clear understanding of the present position of the market players.
- The report includes the analysis of the regional as well as global sports equipment and apparel market trends, key players, market segments, application areas, and market growth strategies.
Sports Equipment and Apparel Market Report Highlights
| Aspects | Details |
| Market Size By 2034 | USD 991.8 Billion |
| Growth Rate | CAGR of 9.5% |
| Forecast period | 2024 - 2034 |
| Report Pages | 306 |
| By Product Type |
|
| By Sports Type |
|
| By Distribution Channel |
|
| By Region |
|
| Key Market Players | The Gap, Inc., Decathlon S.A., Fila Holdings Corp., Adidas AG, Under Armour, Inc., VF Corporation, New Balance, Nike Inc., Puma SE, ASICS Corporation |
Analyst Review
Sports equipment are essential sporting goods required for engaging in sports activity. To maintain the fair game and competition, these equipment are essential to be used while performing sports activities. On the other hand, sports apparel is used for optimum performance supported with comfort in sports activities. In addition, the use of sport equipment and sports clothing is helpful in preventing injuries or to reduce the impact of injuries. Sports equipment and sports apparel are widely accepted by fitness enthusiasts and adventure sports enthusiasts due to its sports concerned functioning.
Improved living standards and customer consciousness towards health & fitness are expected to propel the demand for sports equipment and apparel during the forecast period. Furthermore, increase disposable income and increase in trend of fashionable sports apparel among youth fuel the growth of the industry. However, high cost of equipment and increase in terrorism & political influence on sports industry are expected to restrain the market growth.
Upcoming trends in the global sports equipment and apparel market include the incorporation of smart technology and wearables for performance tracking, increased focus on sustainability with eco-friendly materials, growth in e-commerce and direct-to-consumer sales, personalized and customizable products, and a rise in athleisure as a fashion trend. Moreover, there is a growing emphasis on inclusive and adaptive sportswear to cater to diverse consumer needs.
The leading application of the sports equipment and apparel market is in athletic and recreational activities, where products are used to enhance performance, safety, and comfort. It includes equipment and apparel for sports such as running, fitness training, team sports, and outdoor activities.
Based on region, Asia-Pacific held the highest market share in terms of revenue in 2023.
The global sports equipment and apparel market was valued at $374.2 billion in 2023.
The major players operating in the sports equipment and apparel market include Adidas AG, Asics Corporation, Decathlon S.A., Fila Holdings Corp., New Balance, Nike Inc., Puma Se, The Gap, Inc., Under Armour, Inc, and VF Corporation.
Loading Table Of Content...

