0
2020
Stevia Market

Stevia Market

by Form (Powder, Liquid, and Others), End User (Food & Beverages Industry, Pharmaceutical Industry, Retail Industry, and Others), and Distribution Channel (Direct Channel and Indirect Channel): Global Opportunity Analysis and Industry Forecast, 2019-2026

Report Code: A06042
Feb 2020 | Pages: 252
Tables: 121
Charts: 59
  • Formats*:

  • pdf

    Single User License, Five User
    License & Enterprise User License

  • xls

    Data Pack Excel License

  • ppt

    It comes with the additional cost
    of $2500.00 contact sales.


COVID-19

Pandemic disrupted the entire world and affected many industries.

Get detailed COVID-19 impact analysis on the Stevia Market

Request Now !

The global stevia market was valued at $637.1 million in 2018, and is projected to reach $1,169.4 million by 2026, registering a CAGR of 8.0% from 2019 to 2026.

Stevia is a natural, zero calorie, non-cariogenic sweetener, which has a low glycemic Index (GI). It offers multiple potential benefits especially in managing diabetics & obesity, controlling blood pressure, and managing weight. Thus, it is used as a sugar substitute in many foods & beverages by consumers. Stevia is approximately 200 to 300 times sweeter as compared to the regular sugar. Thus, it is becoming one of the popular ingredients & food additives used in the foods and beverages industry. This is attributed to the fact that stevia possesses many beneficial properties such as it enhances flavor, prevents fermentation & discoloration, reduces stickiness in beverages, and has high heat resistance. 

Stevia Market

Alarming increase in the prevalence of diabetes and cardiovascular diseases and surge in obese population worldwide have fueled the demand for stevia-containing products, which are suitable for the consumption for obese and diabetic patients. Furthermore, expansion of distribution channels such as online stores, discount stores, supermarkets, and hypermarkets has made the stevia easily accessible to consumers, which, in turn, has driven the stevia market growth.

In the past few couple of years, an increase has been witnessed in the use of stevia powder across the food & beverages industries, pharmaceuticals industries, and other industries. This is attributed to the fact that the powder form of stevia is highly soluble in nature, sweetest over other forms, and has a prolonged shelf-life. Thus, stevia manufacturers are strategizing on extending the production of stevia in powder form. For instance, Van Wankum Ingredients, which is an ingredient provider for food & beverages, cosmetics, pharmaceutical, and health industries, is extensively providing stevia in powder form across various industries. Thus, this, in turn, has driven the growth of the stevia market. Moreover, stevia in powder form is widely available in a variety of convenient packages, including jars, sachets, and bottles. This is attributed to the fact that white powders can be sprinkled over food or can be added to drinks easily, making it convenient for consumers. Moreover, apart from enhancing taste, stevia improves the flavor & nutritional value of food & drink, thereby increasing its demand in the market. Furthermore, the increase in adoption of stevia as a tabletop sweetener across the food service industry has boosted the demand for stevia in powder form.

The global stevia market is segmented into form, end user, distribution channel, and region. Depending on form, the market is classified into liquid, powder, and others. By end user, it is divided into food & beverages industry, pharmaceutical industry, retail industry, and others. On the basis of distribution channel, it is segregated into direct channel and indirect channel. Region wise, it is analyzed across North America (the U.S., Canada, and Mexico), Europe (Germany, France, the UK, Italy, Spain, and rest of Europe), Asia-Pacific (China, India, Australia, Japan, and rest of Asia-Pacific), and LAMEA (Latin America, Middle East, and Africa).

Stevia Market
By Form

Your browser does not support the canvas element.

The liquid segment would exhibit the highest CAGR of 8.6% during 2019-2026.

Get more information on this report : Request Sample Pages

By form, the powder segment accounted for the highest stevia market share in 2018. This is attributed to increase in use of stevia powder across the food & beverages industry and pharmaceuticals industry. In addition, the powder form of stevia is highly soluble in nature and has prolonged shelf life, thus making it more popular over the other forms of stevia available in the market. 

Stevia Market
By End User

Your browser does not support the canvas element.

The Retail segment would exhibit the highest CAGR of 9.5% during 2019-2026.

Get more information on this report : Request Sample Pages

Depending on end user, the food & beverages was the leading segment in the global stevia market in 2018, as stevia is one of the popular ingredients & food additives used in the food & beverages industry. Furthermore, it is used to enhance flavor, prevent fermentation & discoloration, and reduce stickiness in beverages. Moreover, it acts as an antioxidant and has high heat tolerance, which fuel its demand in the food & beverages industry.  In addition, it finds its major application as a natural stabilizer in a various dairy products, confectioneries, beverages, and other food products. Thus, all these factors augment the demand for stevia in the food & beverages industry.

Stevia Market
By Distribution Channel

Your browser does not support the canvas element.

Indirect Channel segment would exhibit the highest CAGR of 9.1% during 2019-2026.

Get more information on this report : Request Sample Pages

On the basis of distribution channel, in 2018, the direct channel led the global stevia market, due to rise in use of stevia in various industries, including food & beverages, pharmaceutical, animal feed, and cosmetic & personal care. This has increased the sale through the direct distribution channel, which offers stevia in bulk quantity on discounted rate. 

Stevia Market
By Region

2026
Asia-pacific 
North America
Europe
LAMEA

Europe would exhibit the highest CAGR of 9.5% during 2019-2026.

Get more information on this report : Request Sample Pages

Region wise, Asia-Pacific accounted for the highest market share in 2018. In Asian countries, such as Japan, where, stevia has been traditionally used as a key ingredients for years in food & beverages and dietary supplements sectors. Moreover, rise in health concerns among consumers related the artificial sweeteners in this region has encouraged manufacturers to use natural sweeteners in their products. This has propelled Asian sweetener makers, such as Morita Kagaku Kogyo, to use stevia in their product offerings. Moreover, food & beverage companies in Japan have adopted stevia as an additive, as it has zero calories, helps in lowering blood pressure, and manages diabetes, thereby providing effective solution to consumers for maintaining their health. All these factors together have led to higher demand for stevia in this region.

The key players operating in the global stevia market analysis focus on prominent strategies, such as new product launch, to overcome competition and to maintain as well as improve their share worldwide. Some of the major players in the global stevia industry analyzed in this report include Archer Daniels Midland Company, BENEO (SUDZUCKER Group), Cargill, Incorporated., Foodchem International Corporation, FRAKEN BIOCHEM CO. LTD, Haihang Industry Co., Ltd, Ingredion Incorporated, PureCircle, Tate & Lyle PLC., and Van Wankum Ingredients.

Key Benefits for Stakeholders:

  • The stevia market report provides a quantitative analysis of the current stevia market trend, estimations, and dynamics of the global stevia market size from 2019 to 2026 to identify the prevailing opportunity.
  • The key countries in all the major regions are mapped on the basis of market share.
  • Porter’s five forces analysis highlights the potency of buyers and suppliers to enable stakeholders to make profit-oriented business decisions and strengthen their supplier–buyer network.
  • A comprehensive analysis of factors that drive and restrict the market growth is provided.
  •  In-depth market share analysis of the industry segment and size helps to determine the prevailing market opportunities.
  • Industry player positioning segment facilitates benchmarking and provides a clear understanding of the present position of players along with the stevia market forecast.

Stevia Market Report Highlights

Aspects Details
By Form
  • Powder
  • Liquid
  • Others
By End User
  • Food & Beverages Industry
  • Pharmaceutical Industry
  • Retail Industry
  • Others
By Distribution Channel
  • Direct Channel
  • Indirect Channel
By Region
  • North America  (U.S., Canada, Mexico)
  • Europe  (UK, Germany, France, Italy, Spain, Rest of Europe)
  • Asia-Pacific  (China, Japan, India, Australia, Rest of Asia-Pacific)
  • LAMEA  (Latin America, Middle East, Africa)
Key Market Players PureCircle, BENEO GmbH, Archer-Daniels-Midland Company (ADM), Foodchem International Corporation, Haihang Industry Co., Ltd, CARGILL INC., Van Wankum Ingredients, Ingredion Incorporated, TATE & LYLE PLC. (TATE & LYLE), FRAKEN BIOCHEM CO. LTD
 

CHAPTER 1: INTRODUCTION

1.1. Report Description
1.2. Key Benefits for Stakeholders
1.3. Key Market Segments
1.4. Research Methodology

1.4.1. Primary Research
1.4.2. Secondary Research
1.4.3. Analyst Tools and Models

CHAPTER 2: EXECUTIVE SUMMARY

2.1. Key findings of the study
2.2. CXO perspective

CHAPTER 3: MARKET OVERVIEW

3.1. Market definition and scope
3.2. Key findings

3.2.1. Top investment pocket

3.3. Porter's five forces analysis

3.3.1. Bargaining power of suppliers
3.3.2. Bargaining power of buyers
3.3.3. Threat of substitution
3.3.4. Threat of new entrants
3.3.5. Intensity of competitive rivalry

3.4. Market dynamics

3.4.1. Drivers

3.4.1.1. Various application of stevia in food and beverages industry
3.4.1.2. Increasing  demand by diabetics and obese consumers
3.4.1.3. Increasing number of product launched using stevia

3.4.2. Restraint

3.4.2.1. Potential threat of substitution

3.4.3. Opportunities

3.4.3.1. Increasing demand for natural sweeteners
3.4.3.2. Increasing adoption of stevia for animal feed

3.5. Value chain Analysis
3.6. Parent Market Analysis

CHAPTER 4: STEVIA MARKET, BY FORM

4.1. Overview

4.1.1. Market size and forecast

4.2. POWDER

4.2.1. Overview
4.2.2. Key market trends, growth factors, and opportunities
4.2.3. Market size and forecast
4.2.4. Market analysis by country

4.3. LIQUID

4.3.1. Overview
4.3.2. Key market trends, growth factors, and opportunities
4.3.3. Market size and forecast
4.3.4. Market analysis by country

4.4. Others

4.4.1. Overview
4.4.2. Key market trends, growth factors, and opportunities
4.4.3. Market size and forecast
4.4.4. Market analysis by country

CHAPTER 5: STEVIA MARKET, BY END - USER

5.1. Overview

5.1.1. Market size and forecast

5.2. Food & Beverages Industry

5.2.1. Overview
5.2.2. Key market trends, growth factors, and opportunities
5.2.3. Market size and forecast
5.2.4. Market analysis by country

5.3. Pharmaceutical  Industry

5.3.1. Overview
5.3.2. Key market trends, growth factors, and opportunities
5.3.3. Market size and forecast
5.3.4. Market analysis by country

5.4. Retail Industry

5.4.1. Overview
5.4.2. Key market trends, growth factors, and opportunities
5.4.3. Market size and forecast
5.4.4. Market analysis by country

5.5. Others

5.5.1. Overview
5.5.2. Key market trends, growth factors, and opportunities
5.5.3. Market size and forecast
5.5.4. Market analysis by country

CHAPTER 6: STEVIA MARKET, BY DISTRIBUTON CHANNELS

6.1. Overview

6.1.1. Market size and forecast

6.2. Direct channel

6.2.1. Overview
6.2.2. Key market trends, growth factors, and opportunities
6.2.3. Market size and forecast
6.2.4. Market analysis by country

6.3. Indirect channel

6.3.1. Overview
6.3.2. Key market trends, growth factors, and opportunities
6.3.3. Market size and forecast
6.3.4. Market analysis by country

CHAPTER 7: STEVIA MARKET, BY REGION

7.1. Overview

7.1.1. Market size and forecast

7.2. North America

7.2.1. Overview
7.2.2. Key market trends, growth factors and opportunities
7.2.3. Market size and forecast by form
7.2.4. Market size and forecast by end - user
7.2.5. Market size and forecast by distribution channel
7.2.6. Market size and forecast by country
7.2.7. U.S.

7.2.7.1. Market size and forecast, by Form
7.2.7.2. Market size and forecast, by End – user
7.2.7.3. Market size and forecast, by distribution channel

7.2.8. Canada

7.2.8.1. Market size and forecast, by form
7.2.8.2. Market size and forecast, by End - user
7.2.8.3. Market size and forecast, by distribution channel

7.2.9. Mexico

7.2.9.1. Market size and forecast, by form
7.2.9.2. Market size and forecast, by End - user
7.2.9.3. Market size and forecast, by distribution channel

7.3. Europe

7.3.1. Overview
7.3.2. Key market trends, growth factors and opportunities
7.3.3. Market size and forecast by form
7.3.4. Market size and forecast by End - user
7.3.5. Market size and forecast by distribution channel
7.3.6. Market size and forecast by country
7.3.7. UK

7.3.7.1. Market size and forecast, by form
7.3.7.2. Market size and forecast, by End - user
7.3.7.3. Market size and forecast, by distribution channel

7.3.8. Germany

7.3.8.1. Market size and forecast, by form
7.3.8.2. Market size and forecast, by End - user
7.3.8.3. Market size and forecast, by distribution channel

7.3.9. France

7.3.9.1. Market size and forecast, by form
7.3.9.2. Market size and forecast, by End - user
7.3.9.3. Market size and forecast, by distribution channel

7.3.10. Italy

7.3.10.1. Market size and forecast, by form
7.3.10.2. Market size and forecast, by End - user
7.3.10.3. Market size and forecast, by distribution channel

7.3.11. Spain

7.3.11.1. Market size and forecast, by form
7.3.11.2. Market size and forecast, by End - user
7.3.11.3. Market size and forecast, by distribution channel

7.3.12. Rest of Europe

7.3.12.1. Market size and forecast, by form
7.3.12.2. Market size and forecast, by End - user
7.3.12.3. Market size and forecast, by distribution channel

7.4. Asia-Pacific

7.4.1. Overview
7.4.2. Key market trends, growth factors and opportunities
7.4.3. Market size and forecast by form
7.4.4. Market size and forecast by End - user
7.4.5. Market size and forecast by distribution channel
7.4.6. Market size and forecast by country
7.4.7. China

7.4.7.1. Market size and forecast, by form
7.4.7.2. Market size and forecast, by End - user
7.4.7.3. Market size and forecast, by distribution channel

7.4.8. Japan

7.4.8.1. Market size and forecast, by form
7.4.8.2. Market size and forecast, by End - user
7.4.8.3. Market size and forecast, by distribution channel

7.4.9. India

7.4.9.1. Market size and forecast, by form
7.4.9.2. Market size and forecast, by End - user
7.4.9.3. Market size and forecast, by distribution channel

7.4.10. Australia

7.4.10.1. Market size and forecast, by form
7.4.10.2. Market size and forecast, by End - user
7.4.10.3. Market size and forecast, by distribution channel

7.4.11. Rest of Asia-Pacific

7.4.11.1. Market size and forecast, by form
7.4.11.2. Market size and forecast, by End - user
7.4.11.3. Market size and forecast, by distribution channel

7.5. LAMEA

7.5.1. Overview
7.5.2. Key market trends, growth factors and opportunities
7.5.3. Market size and forecast by form
7.5.4. Market size and forecast by End - user
7.5.5. Market size and forecast by distribution channel
7.5.6. Market size and forecast by country
7.5.7. Latin America

7.5.7.1. Market size and forecast, by form
7.5.7.2. Market size and forecast, by End - user
7.5.7.3. Market size and forecast, by distribution channel

7.5.8. Middle East

7.5.8.1. Market size and forecast, by form
7.5.8.2. Market size and forecast, by End - user
7.5.8.3. Market size and forecast, by distribution channel

7.5.9. Africa

7.5.9.1. Market size and forecast, by form
7.5.9.2. Market size and forecast, by End - user
7.5.9.3. Market size and forecast, by distribution channel

CHAPTER 8: COMPETITIVE LANDSCAPE

8.1. Competitive Dashboard
8.2. Heat Map Overview
8.3. Top Winning Strategies

CHAPTER 9: COMPANY PROFILES

9.1. Archer-Daniels-Midland Company (ADM)

9.1.1. Company overview
9.1.2. Key Executives
9.1.3. Company snapshot
9.1.4. Operating business segments
9.1.5. Product portfolio
9.1.6. Business performance
9.1.7. Key strategic moves and developments

9.2. BENEO GmbH

9.2.1. Company overview
9.2.2. Key Executive
9.2.3. Company snapshot
9.2.4. Operating business segments
9.2.5. Product portfolio
9.2.6. R&D Expenditure
9.2.7. Business performance

9.3. CARGILL INC.

9.3.1. Company overview
9.3.2. Key Executive
9.3.3. Company snapshot
9.3.4. Operating business segments
9.3.5. Product portfolio
9.3.6. Business performance
9.3.7. Key strategic moves and developments

9.4. Foodchem International Corporation

9.4.1. Company overview
9.4.2. Company snapshot
9.4.3. Operating business segments
9.4.4. Product portfolio

9.5. FRAKEN BIOCHEM CO. LTD

9.5.1. Company overview
9.5.2. Company snapshot
9.5.3. Operating business segments
9.5.4. Product portfolio

9.6. Haihang Industry Co., Ltd

9.6.1. Company overview
9.6.2. Company snapshot
9.6.3. Operating business segments
9.6.4. Product portfolio

9.7. Ingredion Incorporated

9.7.1. Company overview
9.7.2. Key Executives
9.7.3. Company snapshot
9.7.4. Operating business segments
9.7.5. Product portfolio
9.7.6. Business performance
9.7.7. Key strategic moves and developments

9.8. PureCircle

9.8.1. Company overview
9.8.2. Key Executive
9.8.3. Company snapshot
9.8.4. Product portfolio
9.8.5. Business performance
9.8.6. Key strategic moves and developments

9.9. TATE & LYLE PLC. (TATE & LYLE)

9.9.1. Company overview
9.9.2. Key Executives
9.9.3. Company snapshot
9.9.4. Operating business segments
9.9.5. Product portfolio
9.9.6. Business performance
9.9.7. Key strategic moves and developments

9.10. Van Wankum Ingredients

9.10.1. Company overview
9.10.2. Key Executives
9.10.3. Company snapshot
9.10.4. Product portfolio

LIST OF TABLES

TABLE 01. GLOBAL STEVIA MARKET, BY FORM, 2018–2026 ($MILLION)
TABLE 02. POWDER STEVIA MARKET, BY REGION, 2018–2026 ($MILLION)
TABLE 03. LIQUID STEVIA MARKET, BY REGION, 2018–2026 ($MILLION)
TABLE 04. OTHERS STEVIA MARKET, BY REGION, 2018–2026 ($MILLION)
TABLE 05. GLOBAL STEVIA MARKET, BY END - USER 2018–2026 ($MILLION)
TABLE 06. STEVIA MARKET FOR FOOD & BEVERAGES INDUSTRY, BY REGION, 2018–2026 ($MILLION)
TABLE 07. STEVIA MARKET FOR PHARMACEUTICAL  INDUSTRY, BY REGION, 2018–2026 ($MILLION)
TABLE 08. STEVIA MARKET FOR RETAIL  INDUSTRY, BY REGION, 2018–2026 ($MILLION)
TABLE 09. STEVIA MARKET FOR  OTHERS, BY REGION, 2018–2026 ($MILLION)
TABLE 10. GLOBAL STEVIA MARKET, BY END - USER 2018–2026 ($MILLION)
TABLE 11. STEVIA MARKET FOR THROUGH DIRECT CHANNEL, BY REGION, 2018–2026 ($MILLION)
TABLE 12. STEVIA MARKET REVENUE THROUGH INDIRECT CHANNEL, BY REGION, 2018–2026 ($MILLION)
TABLE 13. GLOBAL STEVIA MARKET, BY REGION, 2018–2026 ($MILLION)
TABLE 14. NORTH AMERICA STEVIA MARKET, BY FORM , 2018–2026($MILLION)
TABLE 15. NORTH AMERICA STEVIA MARKET, BY END - USER, 2018–2026 ($MILLION)
TABLE 16. NORTH AMERICA STEVIA MARKET, BY DISTRIBUTION CHANNEL, 2018–2026 ($MILLION)
TABLE 17. NORTH AMERICA STEVIA MARKET, BY COUNTRY, 2018–2026 ($MILLION)
TABLE 18. U.S. STEVIA MARKET, BY FORM , 2018–2026 ($MILLION)
TABLE 19. U.S.  STEVIA MARKET, BY END - USER, 2018–2026 ($MILLION)
TABLE 20. U.S.  STEVIA MARKET, BY DISTRIBUTION CHANNEL, 2018–2026 ($MILLION)
TABLE 21. CANADA STEVIA MARKET, BY FORM , 2018–2026 ($MILLION)
TABLE 22. CANADA  STEVIA MARKET, BY END - USER, 2018–2026 ($MILLION)
TABLE 23. CANADA STEVIA MARKET, BY DISTRIBUTION CHANNEL, 2018–2026 ($MILLION)
TABLE 24. MEXICO STEVIA MARKET, BY FORM, 2018–2026 ($MILLION)
TABLE 25. MEXICO STEVIA MARKET, BY END - USER, 2018–2026 ($MILLION)
TABLE 26. U.S.  STEVIA MARKET, BY DISTRIBUTION CHANNEL, 2018–2026 ($MILLION)
TABLE 27. EUROPE STEVIA MARKET, BY FORM , 2018–2026($MILLION)
TABLE 28. EUROPE STEVIA MARKET, BY END - USER, 2018–2026 ($MILLION)
TABLE 29. EUROPE STEVIA MARKET, BY DISTRIBUTION CHANNEL, 2018–2026 ($MILLION)
TABLE 30. EUROPE STEVIA MARKET, BY COUNTRY, 2018–2026 ($MILLION)
TABLE 31. UK STEVIA MARKET, BY FORM , 2018–2026 ($MILLION)
TABLE 32. UK STEVIA MARKET, BY END - USER, 2018–2026 ($MILLION)
TABLE 33. UK  STEVIA MARKET, BY DISTRIBUTION CHANNEL, 2018–2026 ($MILLION)
TABLE 34. GERMANY STEVIA MARKET, BY FORM , 2018–2026 ($MILLION)
TABLE 35. GERMANY STEVIA  MARKET, BY END - USER, 2018–2026 ($MILLION)
TABLE 36. GERMANY  STEVIA MARKET, BY DISTRIBUTION CHANNEL, 2018–2026 ($MILLION)
TABLE 37. FRANCE STEVIA MARKET, BY FORM, 2018–2026 ($MILLION)
TABLE 38. FRANCE STEVIA MARKET, BY END - USER, 2018–2026 ($MILLION)
TABLE 39. FRANCE  STEVIA MARKET, BY DISTRIBUTION CHANNEL, 2018–2026 ($MILLION)
TABLE 40. ITALY STEVIA MARKET, BY FORM , 2018–2026 ($MILLION)
TABLE 41. ITALY STEVIA MARKET, BY END - USER, 2018–2026 ($MILLION)
TABLE 42. ITALY  STEVIA MARKET, BY DISTRIBUTION CHANNEL, 2018–2026 ($MILLION)
TABLE 43. SPAIN STEVIA MARKET, BY FORM , 2018–2026 ($MILLION)
TABLE 44. SPAIN STEVIA MARKET, BY END - USER, 2018–2026 ($MILLION)
TABLE 45. U.S.  STEVIA MARKET, BY DISTRIBUTION CHANNEL, 2018–2026 ($MILLION)
TABLE 46. REST OF EUROPE STEVIA MARKET, BY FORM, 2018–2026 ($MILLION)
TABLE 47. REST OF EUROPE STEVIA MARKET, BY END - USER, 2018–2026 ($MILLION)
TABLE 48. U.S.  STEVIA MARKET, BY DISTRIBUTION CHANNEL, 2018–2026 ($MILLION)
TABLE 49. ASIA-PACIFIC STEVIA MARKET, BY FORM , 2018–2026($MILLION)
TABLE 50. ASIA-PACIFIC STEVIA MARKET, BY END - USER, 2018–2026 ($MILLION)
TABLE 51. ASIA-PACIFIC STEVIA MARKET, BY DISTRIBUTION CHANNEL, 2018–2026 ($MILLION)
TABLE 52. ASIA-PACIFIC STEVIA MARKET, BY COUNTRY, 2018–2026 ($MILLION)
TABLE 53. CHINA STEVIA MARKET, BY FORM , 2018–2026 ($MILLION)
TABLE 54. CHINA  STEVIA MARKET, BY END - USER, 2018–2026 ($MILLION)
TABLE 55. CHINA  STEVIA MARKET, BY DISTRIBUTION CHANNEL, 2018–2026 ($MILLION)
TABLE 56. JAPAN STEVIA MARKET, BY FORM , 2018–2026 ($MILLION)
TABLE 57. JAPAN STEVIA MARKET, BY END - USER, 2018–2026 ($MILLION)
TABLE 58. JAPAN STEVIA MARKET, BY DISTRIBUTION CHANNEL, 2018–2026 ($MILLION)
TABLE 59. INDIA STEVIA MARKET, BY FORM, 2018–2026 ($MILLION)
TABLE 60. INDIA STEVIA MARKET, BY END - USER, 2018–2026 ($MILLION)
TABLE 61. INDIA STEVIA MARKET, BY DISTRIBUTION CHANNEL, 2018–2026 ($MILLION)
TABLE 62. AUSTRALIA STEVIA MARKET, BY FORM , 2018–2026 ($MILLION)
TABLE 63. AUSTRALIA STEVIA MARKET, BY END - USER, 2018–2026 ($MILLION)
TABLE 64. AUSTRALIA STEVIA MARKET, BY DISTRIBUTION CHANNEL, 2018–2026 ($MILLION)
TABLE 65. REST OF ASIA-PACIFIC STEVIA MARKET, BY FORM, 2018–2026 ($MILLION)
TABLE 66. REST OF ASIA-PACIFIC STEVIA MARKET, BY END - USER, 2018–2026 ($MILLION)
TABLE 67. AUSTRALIA STEVIA MARKET, BY DISTRIBUTION CHANNEL, 2018–2026 ($MILLION)
TABLE 68. LAMEA STEVIA MARKET, BY FORM , 2018–2026($MILLION)
TABLE 69. LAMEA STEVIA MARKET, BY END - USER, 2018–2026 ($MILLION)
TABLE 70. LAMEA STEVIA MARKET, BY DISTRIBUTION CHANNEL, 2018–2026 ($MILLION)
TABLE 71. LAMEA STEVIA MARKET, BY COUNTRY, 2018–2026 ($MILLION)
TABLE 72. LATIN AMERICA STEVIA MARKET, BY FORM , 2018–2026 ($MILLION)
TABLE 73. LATIN AMERICA STEVIA MARKET, BY END - USER, 2018–2026 ($MILLION)
TABLE 74. U.S.  STEVIA MARKET, BY DISTRIBUTION CHANNEL, 2018–2026 ($MILLION)
TABLE 75. MIDDLE EAST STEVIA MARKET, BY FORM , 2018–2026 ($MILLION)
TABLE 76. MIDDLE EAST STEVIA MARKET, BY END - USER, 2018–2026 ($MILLION)
TABLE 77. MIDDLE EAST STEVIA MARKET, BY DISTRIBUTION CHANNEL, 2018–2026 ($MILLION)
TABLE 78. AFRICA STEVIA MARKET, BY FORM, 2018–2026 ($MILLION)
TABLE 79. AFRICA STEVIA MARKET, BY END - USER, 2018–2026 ($MILLION)
TABLE 80. AFRICA  STEVIA MARKET, BY DISTRIBUTION CHANNEL, 2018–2026 ($MILLION)
TABLE 81. ADM: KEY EXECUTIVES
TABLE 82. ADM: COMPANY SNAPSHOT
TABLE 83. ADM: OPERATING SEGMENTS
TABLE 84. ADM PRODUCTS, INC. : PRODUCT PORTFOLIO
TABLE 85. ADM: NET SALES: ($MILLION)
TABLE 86. SUDZUCKER GROUP: KEY EXECUTIVES
TABLE 87. BENEO GMBH: COMPANY SNAPSHOT
TABLE 88. SÜDZUCKER GROUP: OPERATING SEGMENTS
TABLE 89. BENEO GMBH: PRODUCT PORTFOLIO
TABLE 90. SÜDZUCKER GROUP: R&D EXPENDITURE, 2016–2018 ($MILLION)
TABLE 91. SÜDZUCKER GROUP: NET SALES, 2016–2018 ($MILLION)
TABLE 92. SÜDZUCKER GROUP: REVENUE SHARE BY SEGMENT, 2018 (%)
TABLE 93. CARGILL INC.: KEY EXECUTIVES
TABLE 94. CARGILL INC.: COMPANY SNAPSHOT
TABLE 95. CARGILL, INCORPORATED: OPERATING SEGMENTS
TABLE 96. CARGILL, INC.,: PRODUCT PORTFOLIO
TABLE 97. CARGILL INC.: NET SALES: ($MILLION)
TABLE 98. FOODCHEM INTERNATIONAL CORPORATION: COMPANY SNAPSHOT
TABLE 99. FOODCHEM INTERNATIONAL CORPORATION: OPERATING SEGMENTS
TABLE 100. FOODCHEM INTERNATIONAL CORPORATION: PRODUCT PORTFOLIO
TABLE 101. FRAKEN BIOCHEM CO. LTD  : COMPANY SNAPSHOT
TABLE 102. FRAKEN BIOCHEM CO. LTD  : OPERATING SEGMENTS
TABLE 103. FRAKEN BIOCHEM CO. LTD  : PRODUCT PORTFOLIO
TABLE 104. HAIHANG INDUSTRY CO.,LTD,: COMPANY SNAPSHOT
TABLE 105. HAIHANG INDUSTRY CO.,LTD,: OPERATING SEGMENTS
TABLE 106. HAIHANG INDUSTRY CO.,LTD,: PRODUCT PORTFOLIO
TABLE 107. INGREDION INCORPORATED: COMPANY SNAPSHOT
TABLE 108. INGREDION INCORPORATED: OPERATING SEGMENTS
TABLE 109. INGREDION INCORPORATED.,: PRODUCT PORTFOLIO
TABLE 110. INGREDION INCORPORATED: NET SALES: ($MILLION)
TABLE 111. PURECIRCLE: KEY EXECUTIVES
TABLE 112. PURECIRCLE: COMPANY SNAPSHOT
TABLE 113. PURECIRCLE: PRODUCT PORTFOLIO
TABLE 114. PURECIRCLE: NET SALES: ($MILLION)
TABLE 115. TATE & LYLE: COMPANY SNAPSHOT
TABLE 116. TATE & LYLE: OPERATING SEGMENTS
TABLE 117. TATE & LYLE: PRODUCT PORTFOLIO
TABLE 118. TATE & LYLE: NET SALES: ($MILLION)
TABLE 119. VAN WANKUM INGREDIENTS.: KEY EXECUTIVES
TABLE 120. VAN WANKUM INGREDIENTS: COMPANY SNAPSHOT
TABLE 121. VAN WANKUM INGREDIENTS.: PRODUCT PORTFOLIO

LIST OF FIGURES

FIGURE 01. KEY MARKET SEGMENTS
FIGURE 02. GLOBAL STEVIA MARKET SNAPSHOT
FIGURE 03. TOP INVESTFOOD & BEVERAGES INDUSTRYT POCKETS
FIGURE 04. HIGH BARGAINING POWER OF SUPPLIERS
FIGURE 05. LOW BARGAINING POWER OF BUYERS
FIGURE 06. LOW THREAT OF SUBSTITUTION
FIGURE 07. LOW THREAT OF NEW ENTRANTS
FIGURE 08. HIGH INTENSITY OF COMPETITIVE RIVALRY
FIGURE 09. GLOBAL STEVIA MARKET SHARE, BY FORM, 2018(%)
FIGURE 10. COMPARATIVE SHARE ANALYSIS OF POWDER MARKET, BY COUNTRY, 2018 & 2026 (%)
FIGURE 11. COMPARATIVE SHARE ANALYSIS OF LIQUID MARKET, BY COUNTRY, 2018 & 2026 (%)
FIGURE 12. COMPARATIVE SHARE ANALYSIS OF OTHERS MARKET, BY COUNTRY, 2018 & 2026 (%)
FIGURE 13. GLOBAL STEVIA MARKET SHARE, BY END - USER, 2018(%)
FIGURE 14. COMPARATIVE SHARE ANALYSIS OF STEVIA MARKET FOR FOOD & BEVERAGES INDUSTRY, BY COUNTRY, 2018 & 2026 (%)
FIGURE 15. COMPARATIVE SHARE ANALYSIS OF STEVIA MARKET FOR PHARMACEUTICAL INDUSTRY, BY COUNTRY, 2018 & 2026 (%)
FIGURE 16. COMPARATIVE SHARE ANALYSIS OF STEVIA MARKET FOR RETAIL INDUSTRY, BY COUNTRY, 2018 & 2026 (%)
FIGURE 17. COMPARATIVE SHARE ANALYSIS OF STEVIA MARKET FOR OTHERS, BY COUNTRY, 2018 & 2026 (%)
FIGURE 18. GLOBAL STEVIA MARKET SHARE, BY END - USER, 2018(%)
FIGURE 19. COMPARATIVE SHARE ANALYSIS OF STEVIA MARKET FOR FOOD & BEVERAGES INDUSTRY, BY COUNTRY, 2018 & 2026 (%)
FIGURE 20. COMPARATIVE SHARE ANALYSIS OF STEVIA MARKET FOR PHARMACEUTICAL INDUSTRY, BY COUNTRY, 2018 & 2026 (%)
FIGURE 21. GLOBAL STEVIA MARKET SHARE BY REGION, 2018(%)
FIGURE 22. U.S. STEVIA MARKET, 2018–2026 ($MILLION)
FIGURE 23. CANADA STEVIA MARKET, 2018–2026 ($MILLION)
FIGURE 24. MEXICO  STEVIA MARKET, 2018–2026 ($MILLION)
FIGURE 25. UK STEVIA MARKET, 2018–2026 ($MILLION)
FIGURE 26. GERMANY STEVIA MARKET, 2018–2026 ($MILLION)
FIGURE 27. FRANCE  STEVIA MARKET, 2018–2026 ($MILLION)
FIGURE 28. ITALY STEVIA MARKET, 2018–2026 ($MILLION)
FIGURE 29. SPAIN STEVIA MARKET, 2018–2026 ($MILLION)
FIGURE 30. REST OF EUROPE  STEVIA MARKET, 2018–2026 ($MILLION)
FIGURE 31. CHINA STEVIA MARKET, 2018–2026 ($MILLION)
FIGURE 32. JAPAN STEVIA MARKET, 2018–2026 ($MILLION)
FIGURE 33. INDIA STEVIA MARKET, 2018–2026 ($MILLION)
FIGURE 34. AUSTRALIA STEVIA MARKET, 2018–2026 ($MILLION)
FIGURE 35. REST OF ASIA-PACIFIC  STEVIA MARKET, 2018–2026 ($MILLION)
FIGURE 36. LATIN AMERICA STEVIA MARKET, 2018–2026 ($MILLION)
FIGURE 37. MIDDLE EAST STEVIA MARKET, 2018–2026 ($MILLION)
FIGURE 38. AFRICA  STEVIA MARKET, 2018–2026 ($MILLION)
FIGURE 39. TOP WINNING STRATEGIES, BY YEAR, 2016–2019*
FIGURE 40. TOP WINNING STRATEGIES, BY DEVELOPMENT, 2016–2019* (%)
FIGURE 41. TOP WINNING STRATEGIES, BY COMPANY, 2016–2019*
FIGURE 42. ADM: NET SALES, 2016–2018 ($MILLION)
FIGURE 43. ADM: REVENUE SHARE BY SEGMENT, 2018 (%)
FIGURE 44. ADM: REVENUE SHARE BY REGION, 2018 (%)
FIGURE 45. SÜDZUCKER GROUP: R&D EXPENDITURE, 2016–2018 ($MILLION)
FIGURE 46. SÜDZUCKER GROUP: NET SALES, 2016–2018 ($MILLION)
FIGURE 47. SÜDZUCKER GROUP: REVENUE SHARE BY REGION, 2018 (%)
FIGURE 48. CARGILL INC.: NET SALES, 2016–2018 ($MILLION)
FIGURE 49. CARGILL INC.: REVENUE SHARE BY REGION, 2018 (%)
FIGURE 50. INGREDION INCORPORATED: KEY EXECUTIVES:
FIGURE 51. INGREDION INCORPORATED: NET SALES, 2016–2018 ($MILLION)
FIGURE 52. INGREDION INCORPORATED: REVENUE SHARE BY SEGMENT, 2018 (%)
FIGURE 53. INGREDION INCORPORATED: REVENUE SHARE BY REGION, 2018 (%)
FIGURE 54. PURECIRCLE: NET SALES, 2016–2018 ($MILLION)
FIGURE 55. PURECIRCLE: REVENUE SHARE BY REGION, 2018 (%)
FIGURE 56. TATE & LYLE: KEY EXECUTIVES:
FIGURE 57. TATE & LYLE: NET SALES, 2016–2018 ($MILLION)
FIGURE 58. TATE & LYLE: REVENUE SHARE BY SEGMENT, 2018 (%)
FIGURE 59. TATE & LYLE: REVENUE SHARE BY REGION, 2018 (%)


Key players operating in the global stevia market have adopted developmental strategies such as new product launch to strengthen their foothold in the market, in terms of value sales. They emphasize on continuous innovation in formulate product to gain a competitive edge in the global market and to boost the demand for stevia.  

According to the key market players, changes in lifestyle and rise in consumer awareness regarding the negative health effects associated with artificial sweeteners are encouraging consumers to seek for natural sweeteners and products containing natural sweeteners without comprising on taste. Therefore, they are investing in R&D activities and making continuous effort in launching improved stevia that can be used as sweetener in food & beverages products, thus assisting food & beverages manufacturers to meet the rising global demand.

According to some of the key stevia companies, rise in trend of reduced sugar consumption among consumers is expected to fuel the demand for stevia across the food & beverages manufactures as well as in the retail industry. Thus, this factor is anticipated to offer lucrative opportunity for the growth of the stevia market. Moreover, stevia manufacturers are providing stevia in different flavors such as chocolate, vanilla, hazelnut, and lemon to enhance the flavor of food and drinks. Thus, stevia is gaining increasing popularity among consumers as well as food & beverages manufacturers.

However, increase in threat of the availability of substitutes for stevia faced by the manufacturers is expected to restrain the market growth.


PURCHASE OPTIONS

Call or Email us

U.S.-Canada Toll-free: +1-800-792-5285
Int'l : +1-503-894-6022
Europe : +44-845-528-1300
Email : help@alliedmarketresearch.com
 
FREQUENTLY ASKED QUESTIONS?

A. The global stevia market was valued at $637.1 million in the year 2018.

A. The global stevia market is projected to reach $1,169.4 million by 2026, registering a CAGR of 8.0% from 2019 to 2026.

A. The global stevia market is projected to grow at a CAGR of 8.0% from 2019 to 2026.

A. The stevia market segments are categorized into form, end users, distribution channel and region.

A. The active players in the Stevia Market includes A DM Company, BENEO, Cargill, Inc., Foodchem International Corporation, FRAKEN BIOCHEM CO. LTD, Haihang Industry Co., Ltd, Ingredion Inc., PureCircle, Tate & Lyle PLC. and Van Wankum Ingredients.

A. The trend of adopting a healthy lifestyle has stimulated the adoption of free form product. This has also triggered a trend of reducing the consumption of sugar in diet among the consumers.

A. Europe is expected to provide more business opportunities for Stevia Market in coming years. The need for stevia supplies in Europe is growing strongly among the food & beverages manufacturers. This is due to the resourceful & versatile properties of stevia along with the rising consumer demands for products containing natural zero calorie sweetener like stevia.

A. The retail segment is expected to be the leading segment in the stevia market during the forecast period.

A. The indirect channel is expected to be the leading segment in the Stevia Market. This is attributable to the easy accessibility of products, heavy discounts and offers on products are through this channel.

A. 
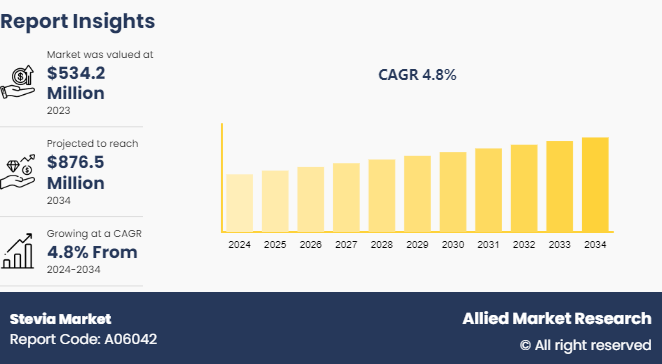
The global stevia market size was valued at $637.1 million in the year 2018.

Looking for Customization?

 Customization Request

Have a Question?

 Speak with Analyst

Any Confusion?

 Inquire Before Buying

Have a glance of the Report

  Request Sample
RELATED TAGS

Purchase Full Report of
Stevia Market

Start reading instantly.
This Report and over 66,905+ more Reports, Available with Avenue Library. T&C*.

  • Online Only
  • $3,456
  • Online cloud access only
  • Restricted print, copy, paste & download
  • Read only
  • Free industry update
    (Within 180 days)
  • Free report update in next update cycle
    (Feb 2021 - Feb 2022)
  • Data Pack
  • $3,840
  • Restricted to one authorized user
  • One print only
  • Available in
    Excel
  • Free industry update
    (Within 180 days)
  •   Free report update in next update cycle
    (Feb 2021 - Feb 2022)
  • Single User
  • $5,769
  • Restricted to one authorized user
  • One print only
  • Available in
    PDF
  • Free industry update
    (Within 180 days)
  •   Free report update in next update cycle
    (Feb 2021 - Feb 2022)
  • Five Users
  • $6,450
  • Limited to five authorized users
  • Print upto five copies
  • Available in
    PDF
  • Free industry update
    (Within 180 days)
  •   Free report update in next update cycle
    (Feb 2021 - Feb 2022)
  • Enterprise
    License/PDF

  • $10,995
  • Unlimited
    within
    company/enterprise
  • Available in Excel & PDF
  • Free industry update
    (Within 180 days)
  •   Free report update in next update cycle
    (Feb 2021 - Feb 2022)
  • Library
    Membership

  • $999 $ 1,175
    Per User/ Per month/ Billed annually
  • Published Content
    E-access
  • Company Profiles
    E-access
  • Newly Added Content Access
  • 10 PDF
    Downloads
  • 5 Excel Data
    Pack Downloads
  • 250 Company Profiles PDF Downloads
  • Buy Now

*Taxes/Fees, if applicable will be added during checkout. All prices in USD

RELATED REPORTS
 

Why Allied Market Research?


Infallible Methodology

To ensure high-level data integrity, accurate analysis, and impeccable forecasts

Analyst Support

For complete satisfaction

Customization

On-demand customization of scope of the report to exactly meet your needs

TARGETED MARKET VIEW

Targeted market view to provide pertinent information and save time of readers

Get fresh content delivered

Get insights on topics that are crucial for your business. Stay abreast of your interest areas.

Get Industry Data Alerts

Why Allied Market Research?

Infallible Methodology

To ensure high-level data integrity, accurate analysis, and impeccable forecasts

Analyst Support

For complete satisfaction

Customization

On-demand customization of scope of the report to exactly meet your needs

TARGETED MARKET VIEW

Targeted market view to provide pertinent information and save time of readers