
Submarine Cables Market Overview, 2032
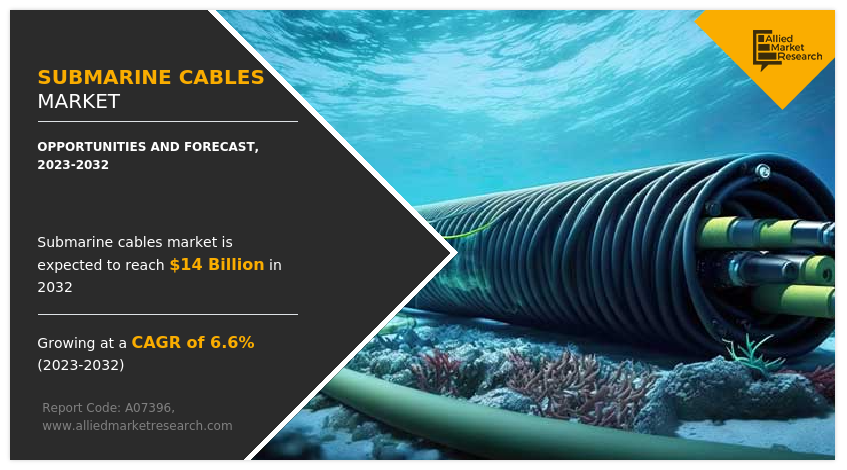
The Global Submarine Cables Market was valued at $7.4 billion in 2022, and is projected to reach $14 billion by 2032, growing at a CAGR of 6.6% from 2023 to 2032. This is driven by rising global connectivity needs, government support, and increased investment in offshore energy projects. Additionally, the expansion of submarine cable networks in developing countries is expected to create lucrative growth opportunities throughout the forecast period.
Market Dynamics & Insights
- The submarine cables industry in Asia-Pacific held a significant share of over 43% in 2022.
- The submarine cables industry in Germany is expected to grow significantly at a CAGR of 5.6% from 2023 to 2032.
- By voltage, medium voltage segment is one of the dominating segments in the market and accounted for the revenue share of over 54.7% in 2022.
- By application, the communication cables segment is the fastest growing segment in the market.
Market Size & Future Outlook
- 2023 Market Size: $7.4 Billion
- 2032 Projected Market Size: $14 Billion
- CAGR (2023-2032): 6.6%
- Asia-Pacific: Largest market in 2023
- Asia-Pacific: Fastest growing market
Submarine cables are primarily utilized for distant data and communication transportation. They operate as backbone of the internet, permitting rapid transfer of data globally. Submarine cables carry huge volumes of internet traffic, allowing seamless global access and supporting a variety of online services such as email, web browsing, social media, cloud computing, and streaming media. Individuals, corporations, governments, and organizations globally use submarine fiber optic cable.
Submarine cables connect Internet service providers (ISPs) networks to the global Internet, enabling customers to take advantage of online services as well as data. These cables are used by multinational organizations to provide reliable and secure communication links among their global offices and data centers. Submarine cables are used by governments for global communication, defense, and intelligence purposes. Moreover, they are used by research organizations and academic networks to allow collaboration and data sharing across countries and continents.
The submarine cables market is expected to witness notable growth during the forecast period owing to an increase in global connectivity demand, government initiatives and investments, and a surge in investment for offshore energy projects globally. Moreover, the expansion of submarine cables in developing countries is anticipated to provide lucrative opportunities for the growth of the submarine cables market during the forecast period. On the contrary, geopolitical and security concerns, and external threats and damages are the restraints for submarine cables market growth during the forecast period.
Key Takeaways
The global market study covers 20 countries. The research includes a segment analysis of each country in terms of value for the projected period.
More than 1,500 product literatures, industry releases, annual reports, and other such documents of major market industry participants along with authentic industry journals, trade associations' releases, and government websites have been reviewed for generating high-value industry insights.
The study integrated high-quality data, professional opinions and analysis, and critical independent perspectives. The research approach is intended to provide a balanced view of global markets and to assist stakeholders in making educated decisions to achieve their most ambitious growth objectives.
Key Market Dynamics
The submarine cables market is experiencing robust growth, driven by increasing internet connectivity demand, cloud services expansion, and growing intercontinental data traffic. The proliferation of 5G networks and digital transformation initiatives also boost demand for these cables.
However, challenges like high installation costs, complex regulatory approvals, and environmental concerns regarding underwater ecosystems could restrain market growth. Geopolitical tensions and security risks around undersea infrastructure also present challenges.
Further opportunities lie in the development of renewable energy projects like offshore wind farms, which require high-capacity submarine cables. Technological advancements in cable durability and transmission capacity will further propel market expansion, while emerging markets, especially in Asia-Pacific and Africa, offer untapped potential for submarine cable installations.
Segment Overview
The submarine cables market is segmented into voltage, offering and application.

On the basis of voltage, the submarine cables market forecast is bifurcated into medium voltage and high voltage. The medium voltage segment acquired the largest share in 2022 and high voltage is expected to grow at a significant CAGR from 2023 to 2032.

On the basis of offering, the market is categorized into installation and commissioning, maintenance, and upgrades. In 2022, the installation and commissioning segment dominated the market, in terms of revenue, and it is expected to acquire a major market share by 2032.

On the basis of application, the submarine cables market size is bifurcated into power cables and communication cables. The power cables segment acquired the largest share in 2022 and communication cables are expected to grow at a significant CAGR from 2023 to 2032.

On the basis of region, the submarine cables market trends are analyzed across North America (the U.S., Canada, and Mexico), Europe (the UK, Germany, France, and Rest of Europe), Asia-Pacific (China, Japan, India, South Korea, and Rest of Asia-Pacific), and LAMEA (Latin America, Middle East, and Africa).
Regional/Country Market Outlook
The global submarine cables market share is experiencing substantial growth, with Asia Pacific playing a pivotal role in this expansion. Asia Pacific leads the market, propelled by rapid digitalization, rising internet usage, and significant investments in 5G infrastructure. Countries like China, Japan, and South Korea are driving demand with large-scale data centers and cloud services. Additionally, the region’s growing offshore wind energy projects further boost the need for submarine cables. Further, the North America market is rising due to increasing demand for high-speed internet, the expansion of cloud services, and the deployment of 5G networks. Major investments in data centers and cross-border communication systems, along with initiatives to enhance connectivity to remote regions, are also driving market growth.
Competitive Analysis
Competitive analysis and profiles of the major global submarine cables market players that have been provided in the report include Alcatel Submarine Networks (ASN), Fujitsu, HENGTONG GROUP CO.,LTD., HMN Tech, JDR Cable Systems Ltd., NEC Corporation, Nexans, Prysmian Group, SubCom, LLC, and Sumitomo Electric Industries, Ltd. The key strategies adopted by the major players of the submarine cables market are expansion, branding, collaboration, and contract.
Region Analysis
On the basis of region, the U.S. acquired a major share in the submarine cables market in the North America region and Mexico is expected to grow at a significant CAGR during the forecast period of 2023-2032.
In Europe, France, dominated the submarine cables market share, in 2022 and is expected to follow the same trend during the forecast period. However, the Rest of Europe is expected to emerge as the fastest-growing country in the submarine cables market of Europe with a CAGR of 6.57%.
In Asia-Pacific, China, Japan, and India are expected to emerge as a significant market for the submarine cables market industry, owing to a significant rise in investment by prime players due to the rise in investment in the use of the Internet of Things (IoT) and connectivity for small, medium and large manufacturers in rural and urban in the region.
On the basis of region, Latin America is expected to garner significant market share in 2022. The LAMEA submarine cables market has been witnessing improvement, owing to the growth in the inclination of companies towards connecting the region with developed companies to provide better internet connectivity across this region. Moreover, the Africa region is expected to grow at a high CAGR of 7.6% from 2023 to 2032.
Report Coverage & Deliverables
This report delivers in-depth insights into the submarine cables market covering voltage, offering and application employed by major players. It offers detailed market forecasts and emerging trends.
Voltage Insights
Medium voltage cables are used for shorter distances, typically connecting offshore platforms to nearby locations. High voltage cables, however, are essential for long-distance data transmission and large-scale projects, like intercontinental connections and offshore wind farms, requiring higher power capacity and efficiency.
Offering Insights
Installation and commissioning services are crucial for laying new cables and ensuring proper functioning. Maintenance offerings focus on regular inspection and repairs to avoid costly downtimes, while upgrades involve enhancing existing systems with advanced technologies, improving data capacity, efficiency, and lifespan of the cables.
Application Insights
Power cables are used primarily for transmitting electricity, supporting renewable energy projects like offshore wind farms. Communication cables are essential for transmitting data, forming the backbone of global internet connectivity, linking continents, and facilitating data transfer between countries, data centers, and cloud infrastructures.
Regional Insights
The submarine cables market is led by Asia-Pacific, driven by rapid digitalization, 5G expansion, and offshore wind projects. North America is growing due to rising data center investments and demand for high-speed internet. Europe focuses on renewable energy and cross-border connectivity, while Latin America and Africa present emerging opportunities, driven by improving telecommunications infrastructure and connectivity to global networks.
Historical Data & Information
The global submarine cables market overview is highly competitive, owing to the strong presence of existing vendors. Vendors of the submarine cables market with extensive technical and financial resources are expected to gain a competitive advantage over their competitors because they may cater to market demand. The competitive environment in this market is expected to worsen as technological innovations, product extensions, and different strategies adopted by key vendors increase.
Key Developments/ Strategies
Alcatel Submarine Networks (ASN), Fujitsu, HENGTONG GROUP CO.,LTD., HMN Tech, JDR Cable Systems Ltd., NEC Corporation, Nexans, Prysmian Group, SubCom, LLC, and Sumitomo Electric Industries, Ltd. are the top companies holding a prime share in the submarine cables industry. Top market players have adopted various strategies, such as expansion, branding, collaboration and contract to expand their foothold in the submarine cables market opportunity.
- In June 2023, Advantech, announced the launch of the AIW-300 series — the AIW-343. This 4G LTE Cat 4 wireless module from Advantech Industrial Wireless (AIW) is designed for AIoT applications requiring ubiquitous connectivity, dynamic mobility, and extreme security.
- In July 2022, NEC Corporation signed a contract with Seren Juno Network Co., Ltd., a company established by NTT Ltd Japan Corporation, PC Landing Corp. Mitsui & Co., Ltd. and JA Mitsui Leasing, Ltd. to build a trans-Pacific subsea fiber-optic cable, JUNO Cable System, connecting California in the US with Chiba prefecture and Mie prefecture in Japan.
- In October 2021, NEC Corporation and Sumitomo Electric Industries, Ltd. announced the completion of the first trial of uncoupled 4-core submarine fiber cable and verified its transmission performance to meet the exacting demands of global telecommunications networks.
- In August 2021, Fujitsu Network Communications, Inc. signed a contract for the Connected Coast project to bring high-speed connectivity to rural and remote communities along the coast of British Columbia and around Vancouver Island.
- In February 2023, Hengtong received a contract, for the construction of the 69KV transmission line in central Luzon of the Philippines. Filipino users receive a stable power supply and reliable services due to this.
- In May 2022, HMN Technologies received a contract, for SEA-H2X Project to build the cable for intra Asian connectivity. Later it enhanced intra-Asian connectivity.
- In January 2022, HMN Tech received a contract for the marine deployment of the Senegal Horn of Africa Regional Express (SHARE) submarine cable system, with landfalls in both Snegal and Cape Verde.
Key Benefits For Stakeholders
- This report provides a quantitative analysis of the market segments, current trends, estimations, and dynamics of the submarine cables market analysis from 2022 to 2032 to identify the prevailing submarine cables market opportunities.
- The market research is offered along with information related to key drivers, restraints, and opportunities.
- Porter's five forces analysis highlights the potency of buyers and suppliers to enable stakeholders make profit-oriented business decisions and strengthen their supplier-buyer network.
- In-depth analysis of the submarine cables market segmentation assists to determine the prevailing market opportunities.
- Major countries in each region are mapped according to their revenue contribution to the global market.
- Market player positioning facilitates benchmarking and provides a clear understanding of the present position of the market players.
- The report includes the analysis of the regional as well as global submarine cables market trends, key players, market segments, application areas, and market growth strategies.
Submarine Cables Market Report Highlights
| Aspects | Details |
| Market Size By 2032 | USD 14 billion |
| Growth Rate | CAGR of 6.6% |
| Forecast period | 2022 - 2032 |
| Report Pages | 239 |
| By Voltage |
|
| By Offering |
|
| By Application |
|
| By Region |
|
| Key Market Players | Fujitsu, JDR Cable Systems Ltd., Alcatel Submarine Networks, Sumitomo Electric Industries, Ltd., HMN Tech, SubCom, LLC, Nexans S.A., HENGTONG GROUP CO.,LTD., Prysmian Group, NEC CORPORATION |
Analyst Review
According to the perspectives of CXOs, the leading companies in submarine cables market are expected to experience significant growth in the market during the forecast period. This is driven by several key factors that indicate a favorable outlook for the submarine cables industry. The increase in demand for high-speed internet and data connectivity drives the growth of the market. There is a growth in need for reliable and high-capacity infrastructure to support the transmission of data across continents. Submarine cables are a critical component of this infrastructure, providing the backbone for international data transfer and enabling seamless connectivity between regions.
The proliferation of emerging technologies such as cloud computing, Internet of Things (IoT), and 5G networks is expected to drive the demand for submarine cables. These technologies rely on fast and secure data transmission, and submarine cables offer a reliable and efficient means of achieving this. The demand for submarine cables is expected to increase correspondingly as these technologies continue to evolve and expand.
The ongoing digital transformation across industries and the increase in reliance on online services fuel the demand for submarine cables. E-commerce, digital media, financial transactions, and telecommunication services all require robust and efficient connectivity, which submarine cables are projected to provide.
The need for expanded submarine cable networks is anticipated to grow as more businesses and individuals rely on digital services. The geographical expansion of internet access and connectivity has created new opportunities for submarine cable deployment. Developing regions and countries with previously limited access to the internet now invest in infrastructure development to bridge the digital divide.
This includes the installation of submarine cables to connect these regions to the global network, opening up new markets and potential revenue streams for submarine cable providers. Thus, the perspectives of CXOs highlight the positive growth expectations for the submarine cables market.
The increase in demand for high-speed connectivity, emerging technologies, digital transformation, and geographical expansion of internet access all contribute to the optimistic outlook. Submarine cables are poised to play a pivotal role in supporting global connectivity and driving the growth of the telecommunications industry in the coming years as the world becomes more interconnected and reliant on data transmission
The Global Submarine Cables Market was valued at $7.4 billion in 2022, and is projected to reach $14 billion by 2032
The global Submarine Cables market is projected to grow at a compound annual growth rate of 6.6% from 2023 to 2032, $14 billion by 2032
Asia-Pacific is the largest regional market for Submarine Cables
Alcatel Submarine Networks (ASN), Fujitsu, HENGTONG GROUP CO.,LTD., HMN Tech, JDR Cable Systems Ltd., NEC Corporation, Nexans, Prysmian Group, SubCom, LLC, and Sumitomo Electric Industries, Ltd.
The submarine cables market is experiencing robust growth, driven by increasing internet connectivity demand, cloud services expansion, and growing intercontinental data traffic.
Loading Table Of Content...
Loading Research Methodology...

