0
2022
Sustainable Packaging Market

Sustainable Packaging Market

by Material Type (Paper and Paperboard, Plastics, Aluminum, Others), by Packaging Type (Rigid Packaging, Flexible Packaging), by End Use (Food and Beverage, Personal Care, Healthcare and Pharmaceuticals, Others): Global Opportunity Analysis and Industry Forecast, 2021-2031

Report Code: A17195
Sep 2022 | Pages: 347
Tables: 207
Charts: 85
  • Formats*:

  • pdf

    Single User License, Five User
    License & Enterprise User License

  • xls

    Data Pack Excel License

  • ppt

    It comes with the additional cost
    of $2500.00 contact sales.


Sustainable Packaging Market Research, 2031

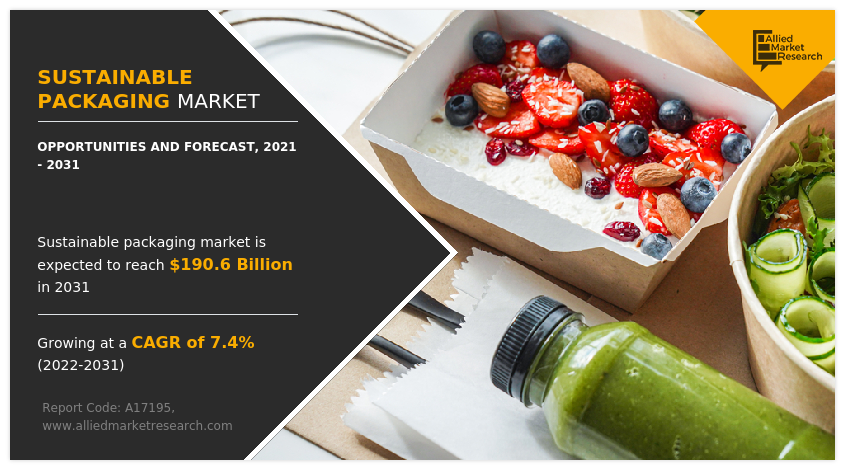
The global sustainable packaging market size was valued at $93.6 billion in 2021, and sustainable packaging industry is projected to reach $190.6 billion by 2031, growing at a CAGR of 7.4% from 2022 to 2031.

Post covid-19, there is an increase in flexible, rigid plastics, and corrugated packaging. The food packaging industry continued to robust the demand of the sustainable packaging products owing to the increase in awareness regarding the hygiene. Moreover, there was high growth for rigid packaging for e-commerce and grocery deliveries. There was an incline towards the growth of sustainable packaging products in healthcare sector, including flexible blister foils, pumps, closures and rigid plastics. Also, the packaging used in dietary supplements such as vitamins and for essential supplies, such as allergy medication has boosted the market.

Sustainable packaging is crucial for preserving the product's shelf life and minimizing negative environmental effects, which are magnified by the use of non-biodegradable plastics in packaging. The five R’s involved in sustainable packaging include Removing, Reducing, Recycling, Renewing, and Reusing. Sustainable packaging also has a smaller environmental impact. This therefore creates a foundation for ecofriendly, healthful, and sensible packaging methodology. Sustainable packaging is used in practically every sector vertical, although it has mostly found a significant stake in the food & beverage, FMCG, retail trade, wholesale, and healthcare industries, to name a few. This new concept of packaging has also brought in a new dimension for innovations giving a whole lot of opportunities for the entrepreneurs to explore various untapped dimensions in this field.

Sustainable Packaging Market

Consumers' growing environmental concern is one of this industry's main drivers. The health of the environment has been harmed by non-biodegradable plastic, which has a number of negative effects including soil pollution, landfills, and a loss of soil fertility. This has had an effect on the current social environment. Most countries have strict regulations in place regarding the usage of plastic carriers and bags. South Africa, Uganda, Somalia, Rwanda, Botswana, Kenya, and Ethiopia are just a few of the nations that have outright banned the use of plastic bags. Another major force in the industry is the rise in consumer demand for the use of eco-friendly packaging for organic foods.

Many businesses throughout the world, including Hovis, have introduced bread that is packaged with renewable polyethylene. Gillette Razor, Dixie Egg Company, Wolfgang Puck Coffee and others have come up with some amazing packaging formats. This packaging style is not only environmentally friendly, but also attracts customers' attention. A major constraint in this industry is overcapacity. Due to their low prices, non-biodegradable plastic bags are still considered the best and most popular packaging material around the world. As a result, packaging companies cannot balance sales volume and production capacity.

Plastic bags and pouches are expected to remain the standard form of packaging during the forecast period due to their ability to preserve food freshness and extend product shelf life. Additionally, petroleum-based plastic bags and pouches offer great visual aesthetics and are sustainable, which adds to the marketing advantages of their products. Companies are focusing on developing bio-based PVC. In October 2021, Cargill announced the addition of its biobased plasticizer, Biovero®, to its bioindustry solutions portfolio. It is used in a variety of product manufacturing applications such as flooring, clothing, wire, cable, plastic films and sheets to serve industrial customers. Throughout North America, there are plans to expand the product worldwide. Such cases are expected to drive the adoption of sustainable PVC in the coming years.

Also, Companies are offering new technologies to integrate sustainable plastic packaging. In May 2020, his YPACK for EU project developed an innovative sustainable plastic food packaging that extends the shelf life of food. YPACK's compostable packaging contains sustainable biopolymers, poly(3-hydroxybutyrate-co-3-hydroxyvalerate) (PHBV), produced by-products, cheese whey, and microcellulose from almond shells. The U.S. Food and Drug Administration recognizes PLA plastic as safe for all food packaging applications and is widely used in many single-use packaging applications. Other uses of PLA are automotive, textiles, foams and foils.

Providers such as his WeforYou, a developer and producer of biopolymers and sustainable packaging solutions, offer pure PLA bags, PLA compounds, and laboratory and compounding services. PLA plastic is expensive compared to traditional petroleum-based plastics. On the other hand, they have less mechanical and physical properties. The sustainable packaging market forecast is classified on the basis of material type, packaging type, end-use industry and region. On the basis of material type, the market is bifurcated into paper & paperboard, plastics, aluminum and others. On the basis of packaging type, the market is divided into rigid packaging and flexible packaging. On the basis of end-use industry, the market is bifurcated into food & beverage, personal care, healthcare and pharmaceuticals and others. Region wise, the market is analyzed across North America, Europe, Asia-Pacific and LAMEA.
Sustainable Packaging Market

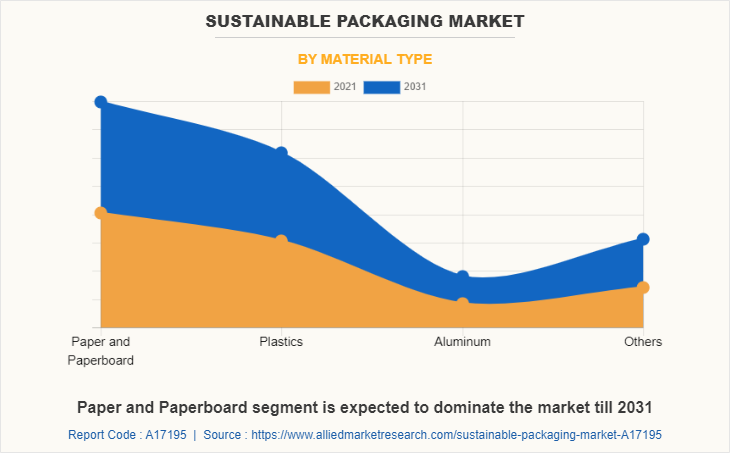
As per sustainable packaging market analysis, by material type, the paper and paperboard segment dominated the global sustainable packaging market share in 2021. This is due to increased government campaigns to educate consumers about the benefits of paper packaging and eco-friendly products, which is expected to benefit sustainable packaging market growth. Paper is used in many flexible packaging applications such as confectionery, pet food and dry food. After years of declining demand, paper-based flexible packaging is gaining popularity among the general public as end-users seek more sustainable packaging solutions.
Sustainable Packaging Market

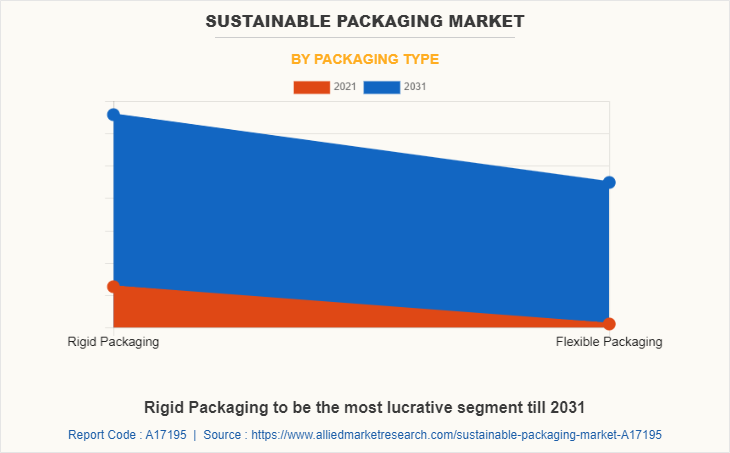
By packaging type, the rigid packaging segment accounted for the highest market share of around 56.2% in 2021 and is projected to maintain the same during the forecast period. Increase in awareness for environment protection activities has made the customer become more linear toward using bioplastics-based flexible packaging films in various end use sectors including food & beverage, agriculture, and other end use sectors. This is projected to further boost the growth of the bioplastics market for rigid packaging applications.
Sustainable Packaging Market

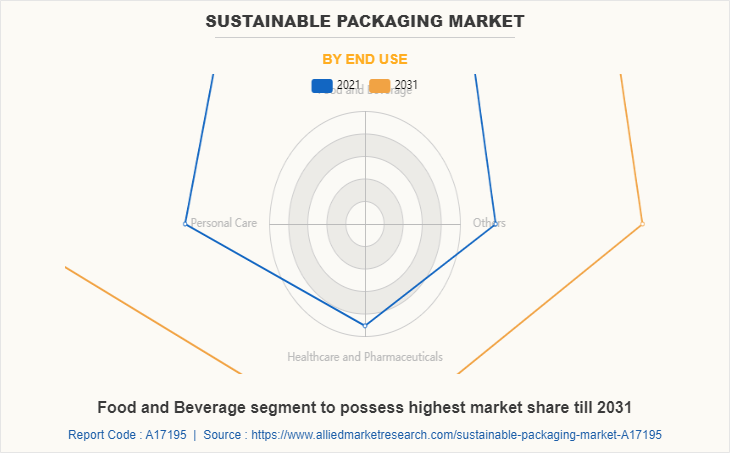
By end use, the food & beverage segment held the largest share of the market in 2021 and is expected to remain dominant during the forecast period owing to huge demand for packaged and branded products. Sustainable packaging has become a necessity in the food and drink industries. To remain competitive in today's market and thrive in the future, food and beverage companies' packaging must be sustainable. Consumer wants and demands are driving R&D budgets for food and beverage manufacturers around the world. As countries like India and China continue to increase their gross domestic product, the food and beverage market expands and their packaging comes under fire. Another motivation for food and beverage manufacturers is consumer health. Therefore, demand for sustainable packaging is expected to grow, with increase in demand for food and beverages during the forecast period.
Sustainable Packaging Market

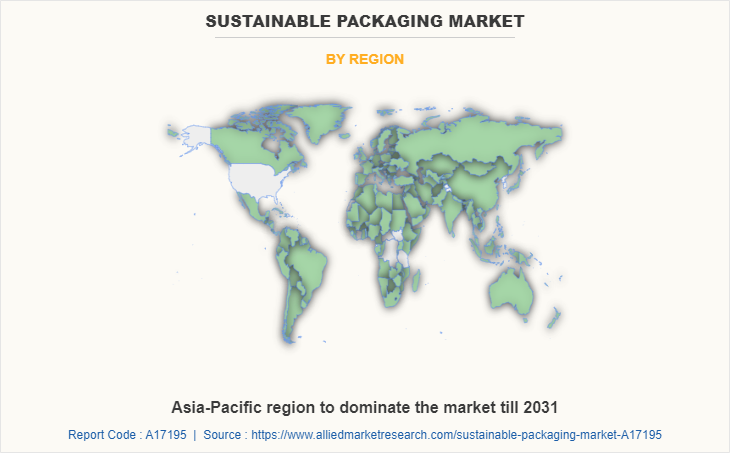
By region, Asia-Pacific accounted for the largest share in the global sustainable packaging market in 2021. China's major courier companies and e-commerce platforms are taking proactive measures to reduce packaging consumption. For example, SF Express used recyclable packaging that can be reused about 10 times on average. The developments in India's middle class, rapid expansion of organized retail, growth in exports, and India's burgeoning e-commerce sector should enable further growth. This has created a need for sustainable packaging that can reduce environmental impact while maintaining the highest quality.

Impact of Covid-19 on Global Sustainable Packaging Market

The COVID-19 pandemic has had a moderate impact on the sustainable packaging market. Due to the strict lockdown, the production of sustainable packaging products were halted. However, the market showed a significant growth after relaxation of lockdown.

The growth of market was mainly due to the consumption of sustainable packaging products in different end-use industries including food & beverage industry, healthcare, cosmetics & personal care, and e-commerce. There is an increase in flexible, rigid plastics, and corrugated packaging. The food packaging industry continued to robust the demand of the sustainable packaging products owing to the increase in awareness regarding the hygiene. Moreover, there was high growth for rigid packaging for e-commerce and grocery deliveries. There was an incline towards the growth of sustainable packaging products in healthcare sector, including flexible blister foils, pumps, closures and rigid plastics. Also, the packaging used in dietary supplements such as vitamins and for essential supplies, such as allergy medication has boosted the market.

Consumers across the globe are going to be increasingly inclined to buy their products through different channels from those they used before the pandemic, leading to a strong acceleration of e-commerce shipments and other home-delivery services. There has been a shift towards online grocery stores in different regions.

For instance, in China, the online sales of fresh food by a large online retailer grew more than 200% during a ten-day period in late January 2020 compared with the same period in 2019. Moreover, UK government and World Health Organization guidelines recommended not touching loose foods unless one intend to buy them. So, DS Smith has innovative mid-term solutions to meet some of these challenges, including corrugated boxes, punnets, trays and latest innovation ECO Bowl which all reduce plastic significantly but still protect the product from damage, food waste or hygiene-related concerns. In this way, there has been a continuous rise in the demand for sustainable packaging products.

Competitive Landscape

The key players operating in the global sustainable packaging market are Amcor plc, Ardagh Group S.A., Ball Corporation, BASF SE, Crown Holdings, Inc., DS Smith, Elopak AS, Emerald Packaging, Mondi, Nampak Ltd., Plastipak Holdings, Inc., Sealed Air, Sgf packaging Co. Ltd, Smurfit Kappa Group PLC, Sonoco Products Company, Tetra Pak and WestRock Company. These players have adopted product launch, acquisition, and business expansion as their key strategies to increase their market shares.

Key Benefits For Stakeholders

  • This report provides a quantitative analysis of the market segments, current trends, estimations, and dynamics of the sustainable packaging market analysis from 2021 to 2031 to identify the prevailing sustainable packaging market opportunities.
  • The market research is offered along with information related to key drivers, restraints, and opportunities.
  • Porter's five forces analysis highlights the potency of buyers and suppliers to enable stakeholders make profit-oriented business decisions and strengthen their supplier-buyer network.
  • In-depth analysis of the sustainable packaging market segmentation assists to determine the prevailing market opportunities.
  • Major countries in each region are mapped according to their revenue contribution to the global market.
  • Market player positioning facilitates benchmarking and provides a clear understanding of the present position of the market players.
  • The report includes the analysis of the regional as well as global sustainable packaging market trends, key players, market segments, application areas, and market growth strategies.

Sustainable Packaging Market Report Highlights

Aspects Details
Market Size By 2031 USD 190.6 billion
Growth Rate CAGR of 7.4%
Forecast period 2021 - 2031
Report Pages 347
By Material Type
  • Paper and Paperboard
  • Plastics
    • Type
      • Biodegradable
      • Bio-based
  • Aluminum
  • Others
By Packaging Type
  • Rigid Packaging
  • Flexible Packaging
By End Use
  • Food and Beverage
  • Personal Care
  • Healthcare and Pharmaceuticals
  • Others
By Region
  • North America  (U.S., Canada, Mexico)
  • Europe  (Germany, France, Italy, Spain, UK, Rest Of Europe)
  • Asia-Pacific  (China, Japan, India, South Korea, Rest Of Asia-Pacific)
  • LAMEA  (Brazil, Argentina, Saudi Arabia, Rest Of LAMEA)
Key Market Players WestRock Company, Sealed Air Corporation, Mondi plc, Sonoco Products Company, Ball Corporation, Tetra Pak, Elopak AS, DS Smith plc, SGF Packaging Co., Ltd., Ardagh Group S.A., Smurfit Kappa Group PLC, Crown Holdings, Inc., Amcor plc, Nampak Ltd., Emerald Packaging, BASF SE, Plastipak Holdings, Inc.
 
  • CHAPTER 1:INTRODUCTION

    • 1.1.Report description

    • 1.2.Key market segments

    • 1.3.Key benefits to the stakeholders

    • 1.4.Research Methodology

      • 1.4.1.Secondary research

      • 1.4.2.Primary research

      • 1.4.3.Analyst tools and models

  • CHAPTER 2:EXECUTIVE SUMMARY

    • 2.1.Key findings of the study

    • 2.2.CXO Perspective

  • CHAPTER 3:MARKET OVERVIEW

    • 3.1.Market definition and scope

    • 3.2.Key findings

      • 3.2.1.Top investment pockets

    • 3.3.Porter’s five forces analysis

    • 3.4.Top player positioning

    • 3.5.Market dynamics

      • 3.5.1.Drivers

      • 3.5.2.Restraints

      • 3.5.3.Opportunities

    • 3.6.COVID-19 Impact Analysis on the market

    • 3.7.Value Chain Analysis

    • 3.8.Key Regulation Analysis

  • CHAPTER 4: SUSTAINABLE PACKAGING MARKET, BY MATERIAL TYPE

    • 4.1 Overview

      • 4.1.1 Market size and forecast

    • 4.2 Paper and Paperboard

      • 4.2.1 Key market trends, growth factors and opportunities

      • 4.2.2 Market size and forecast, by region

      • 4.2.3 Market analysis by country

    • 4.3 Plastics

      • 4.3.1 Key market trends, growth factors and opportunities

      • 4.3.2 Market size and forecast, by region

      • 4.3.3 Market analysis by country

      • 4.3.4 Plastics Sustainable Packaging Market by Type

        • 4.3.4.1 Biodegradable Market size and forecast, by region
        • 4.3.4.2 Biodegradable Market size and forecast, by country
        • 4.3.4.3 Bio-based Market size and forecast, by region
        • 4.3.4.4 Bio-based Market size and forecast, by country
    • 4.4 Aluminum

      • 4.4.1 Key market trends, growth factors and opportunities

      • 4.4.2 Market size and forecast, by region

      • 4.4.3 Market analysis by country

    • 4.5 Others

      • 4.5.1 Key market trends, growth factors and opportunities

      • 4.5.2 Market size and forecast, by region

      • 4.5.3 Market analysis by country

  • CHAPTER 5: SUSTAINABLE PACKAGING MARKET, BY PACKAGING TYPE

    • 5.1 Overview

      • 5.1.1 Market size and forecast

    • 5.2 Rigid Packaging

      • 5.2.1 Key market trends, growth factors and opportunities

      • 5.2.2 Market size and forecast, by region

      • 5.2.3 Market analysis by country

    • 5.3 Flexible Packaging

      • 5.3.1 Key market trends, growth factors and opportunities

      • 5.3.2 Market size and forecast, by region

      • 5.3.3 Market analysis by country

  • CHAPTER 6: SUSTAINABLE PACKAGING MARKET, BY END USE

    • 6.1 Overview

      • 6.1.1 Market size and forecast

    • 6.2 Food and Beverage

      • 6.2.1 Key market trends, growth factors and opportunities

      • 6.2.2 Market size and forecast, by region

      • 6.2.3 Market analysis by country

    • 6.3 Personal Care

      • 6.3.1 Key market trends, growth factors and opportunities

      • 6.3.2 Market size and forecast, by region

      • 6.3.3 Market analysis by country

    • 6.4 Healthcare and Pharmaceuticals

      • 6.4.1 Key market trends, growth factors and opportunities

      • 6.4.2 Market size and forecast, by region

      • 6.4.3 Market analysis by country

    • 6.5 Others

      • 6.5.1 Key market trends, growth factors and opportunities

      • 6.5.2 Market size and forecast, by region

      • 6.5.3 Market analysis by country

  • CHAPTER 7: SUSTAINABLE PACKAGING MARKET, BY REGION

    • 7.1 Overview

      • 7.1.1 Market size and forecast

    • 7.2 North America

      • 7.2.1 Key trends and opportunities

      • 7.2.2 North America Market size and forecast, by Material Type

        • 7.2.2.1 North America Plastics Sustainable Packaging Market by Type
      • 7.2.3 North America Market size and forecast, by Packaging Type

      • 7.2.4 North America Market size and forecast, by End Use

      • 7.2.5 North America Market size and forecast, by country

        • 7.2.5.1 U.S.
          • 7.2.5.1.1 Market size and forecast, by Material Type
            • 7.2.5.1.1.1 U.S. Plastics Sustainable Packaging Market by Type
          • 7.2.5.1.2 Market size and forecast, by Packaging Type
          • 7.2.5.1.3 Market size and forecast, by End Use
        • 7.2.5.2 Canada
          • 7.2.5.2.1 Market size and forecast, by Material Type
            • 7.2.5.2.1.1 Canada Plastics Sustainable Packaging Market by Type
          • 7.2.5.2.2 Market size and forecast, by Packaging Type
          • 7.2.5.2.3 Market size and forecast, by End Use
        • 7.2.5.3 Mexico
          • 7.2.5.3.1 Market size and forecast, by Material Type
            • 7.2.5.3.1.1 Mexico Plastics Sustainable Packaging Market by Type
          • 7.2.5.3.2 Market size and forecast, by Packaging Type
          • 7.2.5.3.3 Market size and forecast, by End Use
    • 7.3 Europe

      • 7.3.1 Key trends and opportunities

      • 7.3.2 Europe Market size and forecast, by Material Type

        • 7.3.2.1 Europe Plastics Sustainable Packaging Market by Type
      • 7.3.3 Europe Market size and forecast, by Packaging Type

      • 7.3.4 Europe Market size and forecast, by End Use

      • 7.3.5 Europe Market size and forecast, by country

        • 7.3.5.1 Germany
          • 7.3.5.1.1 Market size and forecast, by Material Type
            • 7.3.5.1.1.1 Germany Plastics Sustainable Packaging Market by Type
          • 7.3.5.1.2 Market size and forecast, by Packaging Type
          • 7.3.5.1.3 Market size and forecast, by End Use
        • 7.3.5.2 France
          • 7.3.5.2.1 Market size and forecast, by Material Type
            • 7.3.5.2.1.1 France Plastics Sustainable Packaging Market by Type
          • 7.3.5.2.2 Market size and forecast, by Packaging Type
          • 7.3.5.2.3 Market size and forecast, by End Use
        • 7.3.5.3 Italy
          • 7.3.5.3.1 Market size and forecast, by Material Type
            • 7.3.5.3.1.1 Italy Plastics Sustainable Packaging Market by Type
          • 7.3.5.3.2 Market size and forecast, by Packaging Type
          • 7.3.5.3.3 Market size and forecast, by End Use
        • 7.3.5.4 Spain
          • 7.3.5.4.1 Market size and forecast, by Material Type
            • 7.3.5.4.1.1 Spain Plastics Sustainable Packaging Market by Type
          • 7.3.5.4.2 Market size and forecast, by Packaging Type
          • 7.3.5.4.3 Market size and forecast, by End Use
        • 7.3.5.5 UK
          • 7.3.5.5.1 Market size and forecast, by Material Type
            • 7.3.5.5.1.1 UK Plastics Sustainable Packaging Market by Type
          • 7.3.5.5.2 Market size and forecast, by Packaging Type
          • 7.3.5.5.3 Market size and forecast, by End Use
        • 7.3.5.6 Rest of Europe
          • 7.3.5.6.1 Market size and forecast, by Material Type
            • 7.3.5.6.1.1 Rest of Europe Plastics Sustainable Packaging Market by Type
          • 7.3.5.6.2 Market size and forecast, by Packaging Type
          • 7.3.5.6.3 Market size and forecast, by End Use
    • 7.4 Asia-Pacific

      • 7.4.1 Key trends and opportunities

      • 7.4.2 Asia-Pacific Market size and forecast, by Material Type

        • 7.4.2.1 Asia-Pacific Plastics Sustainable Packaging Market by Type
      • 7.4.3 Asia-Pacific Market size and forecast, by Packaging Type

      • 7.4.4 Asia-Pacific Market size and forecast, by End Use

      • 7.4.5 Asia-Pacific Market size and forecast, by country

        • 7.4.5.1 China
          • 7.4.5.1.1 Market size and forecast, by Material Type
            • 7.4.5.1.1.1 China Plastics Sustainable Packaging Market by Type
          • 7.4.5.1.2 Market size and forecast, by Packaging Type
          • 7.4.5.1.3 Market size and forecast, by End Use
        • 7.4.5.2 Japan
          • 7.4.5.2.1 Market size and forecast, by Material Type
            • 7.4.5.2.1.1 Japan Plastics Sustainable Packaging Market by Type
          • 7.4.5.2.2 Market size and forecast, by Packaging Type
          • 7.4.5.2.3 Market size and forecast, by End Use
        • 7.4.5.3 India
          • 7.4.5.3.1 Market size and forecast, by Material Type
            • 7.4.5.3.1.1 India Plastics Sustainable Packaging Market by Type
          • 7.4.5.3.2 Market size and forecast, by Packaging Type
          • 7.4.5.3.3 Market size and forecast, by End Use
        • 7.4.5.4 South Korea
          • 7.4.5.4.1 Market size and forecast, by Material Type
            • 7.4.5.4.1.1 South Korea Plastics Sustainable Packaging Market by Type
          • 7.4.5.4.2 Market size and forecast, by Packaging Type
          • 7.4.5.4.3 Market size and forecast, by End Use
        • 7.4.5.5 Rest of Asia-Pacific
          • 7.4.5.5.1 Market size and forecast, by Material Type
            • 7.4.5.5.1.1 Rest of Asia-Pacific Plastics Sustainable Packaging Market by Type
          • 7.4.5.5.2 Market size and forecast, by Packaging Type
          • 7.4.5.5.3 Market size and forecast, by End Use
    • 7.5 LAMEA

      • 7.5.1 Key trends and opportunities

      • 7.5.2 LAMEA Market size and forecast, by Material Type

        • 7.5.2.1 LAMEA Plastics Sustainable Packaging Market by Type
      • 7.5.3 LAMEA Market size and forecast, by Packaging Type

      • 7.5.4 LAMEA Market size and forecast, by End Use

      • 7.5.5 LAMEA Market size and forecast, by country

        • 7.5.5.1 Brazil
          • 7.5.5.1.1 Market size and forecast, by Material Type
            • 7.5.5.1.1.1 Brazil Plastics Sustainable Packaging Market by Type
          • 7.5.5.1.2 Market size and forecast, by Packaging Type
          • 7.5.5.1.3 Market size and forecast, by End Use
        • 7.5.5.2 Argentina
          • 7.5.5.2.1 Market size and forecast, by Material Type
            • 7.5.5.2.1.1 Argentina Plastics Sustainable Packaging Market by Type
          • 7.5.5.2.2 Market size and forecast, by Packaging Type
          • 7.5.5.2.3 Market size and forecast, by End Use
        • 7.5.5.3 Saudi Arabia
          • 7.5.5.3.1 Market size and forecast, by Material Type
            • 7.5.5.3.1.1 Saudi Arabia Plastics Sustainable Packaging Market by Type
          • 7.5.5.3.2 Market size and forecast, by Packaging Type
          • 7.5.5.3.3 Market size and forecast, by End Use
        • 7.5.5.4 Rest of LAMEA
          • 7.5.5.4.1 Market size and forecast, by Material Type
            • 7.5.5.4.1.1 Rest of LAMEA Plastics Sustainable Packaging Market by Type
          • 7.5.5.4.2 Market size and forecast, by Packaging Type
          • 7.5.5.4.3 Market size and forecast, by End Use
  • CHAPTER 8: COMPANY LANDSCAPE

    • 8.1. Introduction

    • 8.2. Top winning strategies

    • 8.3. Product Mapping of Top 10 Player

    • 8.4. Competitive Dashboard

    • 8.5. Competitive Heatmap

    • 8.6. Key developments

  • CHAPTER 9: COMPANY PROFILES

    • 9.1 Amcor plc

      • 9.1.1 Company overview

      • 9.1.2 Company snapshot

      • 9.1.3 Operating business segments

      • 9.1.4 Product portfolio

      • 9.1.5 Business performance

      • 9.1.6 Key strategic moves and developments

    • 9.2 Ardagh Group S.A.

      • 9.2.1 Company overview

      • 9.2.2 Company snapshot

      • 9.2.3 Operating business segments

      • 9.2.4 Product portfolio

      • 9.2.5 Business performance

      • 9.2.6 Key strategic moves and developments

    • 9.3 Ball Corporation

      • 9.3.1 Company overview

      • 9.3.2 Company snapshot

      • 9.3.3 Operating business segments

      • 9.3.4 Product portfolio

      • 9.3.5 Business performance

      • 9.3.6 Key strategic moves and developments

    • 9.4 BASF SE

      • 9.4.1 Company overview

      • 9.4.2 Company snapshot

      • 9.4.3 Operating business segments

      • 9.4.4 Product portfolio

      • 9.4.5 Business performance

      • 9.4.6 Key strategic moves and developments

    • 9.5 Crown Holdings, Inc.

      • 9.5.1 Company overview

      • 9.5.2 Company snapshot

      • 9.5.3 Operating business segments

      • 9.5.4 Product portfolio

      • 9.5.5 Business performance

      • 9.5.6 Key strategic moves and developments

    • 9.6 DS Smith plc

      • 9.6.1 Company overview

      • 9.6.2 Company snapshot

      • 9.6.3 Operating business segments

      • 9.6.4 Product portfolio

      • 9.6.5 Business performance

      • 9.6.6 Key strategic moves and developments

    • 9.7 Elopak AS

      • 9.7.1 Company overview

      • 9.7.2 Company snapshot

      • 9.7.3 Operating business segments

      • 9.7.4 Product portfolio

      • 9.7.5 Business performance

      • 9.7.6 Key strategic moves and developments

    • 9.8 Emerald Packaging

      • 9.8.1 Company overview

      • 9.8.2 Company snapshot

      • 9.8.3 Operating business segments

      • 9.8.4 Product portfolio

      • 9.8.5 Business performance

      • 9.8.6 Key strategic moves and developments

    • 9.9 Mondi plc

      • 9.9.1 Company overview

      • 9.9.2 Company snapshot

      • 9.9.3 Operating business segments

      • 9.9.4 Product portfolio

      • 9.9.5 Business performance

      • 9.9.6 Key strategic moves and developments

    • 9.10 Nampak Ltd.

      • 9.10.1 Company overview

      • 9.10.2 Company snapshot

      • 9.10.3 Operating business segments

      • 9.10.4 Product portfolio

      • 9.10.5 Business performance

      • 9.10.6 Key strategic moves and developments

    • 9.11 Plastipak Holdings, Inc.

      • 9.11.1 Company overview

      • 9.11.2 Company snapshot

      • 9.11.3 Operating business segments

      • 9.11.4 Product portfolio

      • 9.11.5 Business performance

      • 9.11.6 Key strategic moves and developments

    • 9.12 Sealed Air Corporation

      • 9.12.1 Company overview

      • 9.12.2 Company snapshot

      • 9.12.3 Operating business segments

      • 9.12.4 Product portfolio

      • 9.12.5 Business performance

      • 9.12.6 Key strategic moves and developments

    • 9.13 SGF Packaging Co., Ltd.

      • 9.13.1 Company overview

      • 9.13.2 Company snapshot

      • 9.13.3 Operating business segments

      • 9.13.4 Product portfolio

      • 9.13.5 Business performance

      • 9.13.6 Key strategic moves and developments

    • 9.14 Smurfit Kappa Group PLC

      • 9.14.1 Company overview

      • 9.14.2 Company snapshot

      • 9.14.3 Operating business segments

      • 9.14.4 Product portfolio

      • 9.14.5 Business performance

      • 9.14.6 Key strategic moves and developments

    • 9.15 Sonoco Products Company

      • 9.15.1 Company overview

      • 9.15.2 Company snapshot

      • 9.15.3 Operating business segments

      • 9.15.4 Product portfolio

      • 9.15.5 Business performance

      • 9.15.6 Key strategic moves and developments

    • 9.16 Tetra Pak

      • 9.16.1 Company overview

      • 9.16.2 Company snapshot

      • 9.16.3 Operating business segments

      • 9.16.4 Product portfolio

      • 9.16.5 Business performance

      • 9.16.6 Key strategic moves and developments

    • 9.17 WestRock Company

      • 9.17.1 Company overview

      • 9.17.2 Company snapshot

      • 9.17.3 Operating business segments

      • 9.17.4 Product portfolio

      • 9.17.5 Business performance

      • 9.17.6 Key strategic moves and developments

  • LIST OF TABLES

  • TABLE 01. SUSTAINABLE PACKAGING MARKET, BY MATERIAL TYPE, 2021-2031 ($MILLION)
    TABLE 02. SUSTAINABLE PACKAGING MARKET, FOR PAPER AND PAPERBOARD, BY REGION, 2021-2031 ($MILLION)
    TABLE 03. SUSTAINABLE PACKAGING MARKET, FOR PLASTICS, BY REGION, 2021-2031 ($MILLION)
    TABLE 04. PLASTICS SUSTAINABLE PACKAGING MARKET, BY TYPE, 2021-2031 ($MILLION)
    TABLE 05. PLASTICS SUSTAINABLE PACKAGING MARKET FOR BIODEGRADABLE, BY REGION, 2021-2031 ($MILLION)
    TABLE 06. PLASTICS SUSTAINABLE PACKAGING MARKET FOR BIODEGRADABLE, BY TYPE, 2021–2031 ($MILLION)
    TABLE 07. PLASTICS SUSTAINABLE PACKAGING MARKET FOR BIODEGRADABLE, BY PLA, 2021–2031 ($MILLION)
    TABLE 08. PLASTICS SUSTAINABLE PACKAGING MARKET FOR BIODEGRADABLE, BY PBAT, 2021–2031 ($MILLION)
    TABLE 09. PLASTICS SUSTAINABLE PACKAGING MARKET FOR BIODEGRADABLE, BY PBS, 2021–2031 ($MILLION)
    TABLE 10. PLASTICS SUSTAINABLE PACKAGING MARKET FOR BIODEGRADABLE, BY PHA, 2021–2031 ($MILLION)
    TABLE 11. PLASTICS SUSTAINABLE PACKAGING MARKET FOR BIODEGRADABLE, BY STARCH BLEND, 2021–2031 ($MILLION)
    TABLE 12. PLASTICS SUSTAINABLE PACKAGING MARKET FOR BIODEGRADABLE, BY OTHERS, 2021–2031 ($MILLION)
    TABLE 13. PLASTICS SUSTAINABLE PACKAGING MARKET FOR BIO-BASED, BY REGION, 2021-2031 ($MILLION)
    TABLE 14. PLASTICS SUSTAINABLE PACKAGING MARKET FOR BIO-BASED, BY TYPE, 2021–2031 ($MILLION)
    TABLE 15. PLASTICS SUSTAINABLE PACKAGING MARKET FOR BIO-BASED, BY POLYETHYLENE (PE), 2021–2031 ($MILLION)
    TABLE 16. PLASTICS SUSTAINABLE PACKAGING MARKET FOR BIO-BASED, BY POLYETHYLENE TEREPHTHALATE (PET), 2021–2031 ($MILLION)
    TABLE 17. PLASTICS SUSTAINABLE PACKAGING MARKET FOR BIO-BASED, BY POLYAMIDE (PA), 2021–2031 ($MILLION)
    TABLE 18. PLASTICS SUSTAINABLE PACKAGING MARKET FOR BIO-BASED, BY OTHERS, 2021–2031 ($MILLION)
    TABLE 19. SUSTAINABLE PACKAGING MARKET, FOR ALUMINUM, BY REGION, 2021-2031 ($MILLION)
    TABLE 20. SUSTAINABLE PACKAGING MARKET, FOR OTHERS, BY REGION, 2021-2031 ($MILLION)
    TABLE 21. SUSTAINABLE PACKAGING MARKET, BY PACKAGING TYPE, 2021-2031 ($MILLION)
    TABLE 22. SUSTAINABLE PACKAGING MARKET, FOR RIGID PACKAGING, BY REGION, 2021-2031 ($MILLION)
    TABLE 23. SUSTAINABLE PACKAGING MARKET, FOR FLEXIBLE PACKAGING, BY REGION, 2021-2031 ($MILLION)
    TABLE 24. SUSTAINABLE PACKAGING MARKET, BY END USE, 2021-2031 ($MILLION)
    TABLE 25. SUSTAINABLE PACKAGING MARKET, FOR FOOD AND BEVERAGE, BY REGION, 2021-2031 ($MILLION)
    TABLE 26. SUSTAINABLE PACKAGING MARKET, FOR PERSONAL CARE, BY REGION, 2021-2031 ($MILLION)
    TABLE 27. SUSTAINABLE PACKAGING MARKET, FOR HEALTHCARE AND PHARMACEUTICALS, BY REGION, 2021-2031 ($MILLION)
    TABLE 28. SUSTAINABLE PACKAGING MARKET, FOR OTHERS, BY REGION, 2021-2031 ($MILLION)
    TABLE 29. SUSTAINABLE PACKAGING MARKET, BY REGION, 2021-2031 ($MILLION)
    TABLE 30. NORTH AMERICA SUSTAINABLE PACKAGING MARKET, BY MATERIAL TYPE, 2021-2031 ($MILLION)
    TABLE 31. NORTH AMERICA PLASTICS SUSTAINABLE PACKAGING MARKET, BY TYPE, 2021-2031 ($MILLION)
    TABLE 32. NORTH AMERICA PLASTICS SUSTAINABLE PACKAGING MARKET FOR BIODEGRADABLE, BY TYPE, 2021–2031 ($MILLION)
    TABLE 33. NORTH AMERICA PLASTICS SUSTAINABLE PACKAGING MARKET FOR BIO-BASED, BY TYPE, 2021–2031 ($MILLION)
    TABLE 34. NORTH AMERICA SUSTAINABLE PACKAGING MARKET, BY PACKAGING TYPE, 2021-2031 ($MILLION)
    TABLE 35. NORTH AMERICA SUSTAINABLE PACKAGING MARKET, BY END USE, 2021-2031 ($MILLION)
    TABLE 36. NORTH AMERICA SUSTAINABLE PACKAGING MARKET, BY COUNTRY, 2021-2031 ($MILLION)
    TABLE 37. U.S. SUSTAINABLE PACKAGING MARKET, BY MATERIAL TYPE, 2021-2031 ($MILLION)
    TABLE 38. U.S. PLASTICS SUSTAINABLE PACKAGING MARKET, BY TYPE, 2021-2031 ($MILLION)
    TABLE 39. U.S. PLASTICS SUSTAINABLE PACKAGING MARKET FOR BIODEGRADABLE, BY TYPE, 2021–2031 ($MILLION)
    TABLE 40. U.S. PLASTICS SUSTAINABLE PACKAGING MARKET FOR BIO-BASED, BY TYPE, 2021–2031 ($MILLION)
    TABLE 41. U.S. SUSTAINABLE PACKAGING MARKET, BY PACKAGING TYPE, 2021-2031 ($MILLION)
    TABLE 42. U.S. SUSTAINABLE PACKAGING MARKET, BY END USE, 2021-2031 ($MILLION)
    TABLE 43. CANADA SUSTAINABLE PACKAGING MARKET, BY MATERIAL TYPE, 2021-2031 ($MILLION)
    TABLE 44. CANADA PLASTICS SUSTAINABLE PACKAGING MARKET, BY TYPE, 2021-2031 ($MILLION)
    TABLE 45. CANADA PLASTICS SUSTAINABLE PACKAGING MARKET FOR BIODEGRADABLE, BY TYPE, 2021–2031 ($MILLION)
    TABLE 46. CANADA PLASTICS SUSTAINABLE PACKAGING MARKET FOR BIO-BASED, BY TYPE, 2021–2031 ($MILLION)
    TABLE 47. CANADA SUSTAINABLE PACKAGING MARKET, BY PACKAGING TYPE, 2021-2031 ($MILLION)
    TABLE 48. CANADA SUSTAINABLE PACKAGING MARKET, BY END USE, 2021-2031 ($MILLION)
    TABLE 49. MEXICO SUSTAINABLE PACKAGING MARKET, BY MATERIAL TYPE, 2021-2031 ($MILLION)
    TABLE 50. MEXICO PLASTICS SUSTAINABLE PACKAGING MARKET, BY TYPE, 2021-2031 ($MILLION)
    TABLE 51. MEXICO PLASTICS SUSTAINABLE PACKAGING MARKET FOR BIODEGRADABLE, BY TYPE, 2021–2031 ($MILLION)
    TABLE 52. MEXICO PLASTICS SUSTAINABLE PACKAGING MARKET FOR BIO-BASED, BY TYPE, 2021–2031 ($MILLION)
    TABLE 53. MEXICO SUSTAINABLE PACKAGING MARKET, BY PACKAGING TYPE, 2021-2031 ($MILLION)
    TABLE 54. MEXICO SUSTAINABLE PACKAGING MARKET, BY END USE, 2021-2031 ($MILLION)
    TABLE 55. EUROPE SUSTAINABLE PACKAGING MARKET, BY MATERIAL TYPE, 2021-2031 ($MILLION)
    TABLE 56. EUROPE PLASTICS SUSTAINABLE PACKAGING MARKET, BY TYPE, 2021-2031 ($MILLION)
    TABLE 57. EUROPE PLASTICS SUSTAINABLE PACKAGING MARKET FOR BIODEGRADABLE, BY TYPE, 2021–2031 ($MILLION)
    TABLE 58. EUROPE PLASTICS SUSTAINABLE PACKAGING MARKET FOR BIO-BASED, BY TYPE, 2021–2031 ($MILLION)
    TABLE 59. EUROPE SUSTAINABLE PACKAGING MARKET, BY PACKAGING TYPE, 2021-2031 ($MILLION)
    TABLE 60. EUROPE SUSTAINABLE PACKAGING MARKET, BY END USE, 2021-2031 ($MILLION)
    TABLE 61. EUROPE SUSTAINABLE PACKAGING MARKET, BY COUNTRY, 2021-2031 ($MILLION)
    TABLE 62. GERMANY SUSTAINABLE PACKAGING MARKET, BY MATERIAL TYPE, 2021-2031 ($MILLION)
    TABLE 63. GERMANY PLASTICS SUSTAINABLE PACKAGING MARKET, BY TYPE, 2021-2031 ($MILLION)
    TABLE 64. GERMANY PLASTICS SUSTAINABLE PACKAGING MARKET FOR BIODEGRADABLE, BY TYPE, 2021–2031 ($MILLION)
    TABLE 65. GERMANY PLASTICS SUSTAINABLE PACKAGING MARKET FOR BIO-BASED, BY TYPE, 2021–2031 ($MILLION)
    TABLE 66. GERMANY SUSTAINABLE PACKAGING MARKET, BY PACKAGING TYPE, 2021-2031 ($MILLION)
    TABLE 67. GERMANY SUSTAINABLE PACKAGING MARKET, BY END USE, 2021-2031 ($MILLION)
    TABLE 68. FRANCE SUSTAINABLE PACKAGING MARKET, BY MATERIAL TYPE, 2021-2031 ($MILLION)
    TABLE 69. FRANCE PLASTICS SUSTAINABLE PACKAGING MARKET, BY TYPE, 2021-2031 ($MILLION)
    TABLE 70. FRANCE PLASTICS SUSTAINABLE PACKAGING MARKET FOR BIODEGRADABLE, BY TYPE, 2021–2031 ($MILLION)
    TABLE 71. FRANCE PLASTICS SUSTAINABLE PACKAGING MARKET FOR BIO-BASED, BY TYPE, 2021–2031 ($MILLION)
    TABLE 72. FRANCE SUSTAINABLE PACKAGING MARKET, BY PACKAGING TYPE, 2021-2031 ($MILLION)
    TABLE 73. FRANCE SUSTAINABLE PACKAGING MARKET, BY END USE, 2021-2031 ($MILLION)
    TABLE 74. ITALY SUSTAINABLE PACKAGING MARKET, BY MATERIAL TYPE, 2021-2031 ($MILLION)
    TABLE 75. ITALY PLASTICS SUSTAINABLE PACKAGING MARKET, BY TYPE, 2021-2031 ($MILLION)
    TABLE 76. ITALY PLASTICS SUSTAINABLE PACKAGING MARKET FOR BIODEGRADABLE, BY TYPE, 2021–2031 ($MILLION)
    TABLE 77. ITALY PLASTICS SUSTAINABLE PACKAGING MARKET FOR BIO-BASED, BY TYPE, 2021–2031 ($MILLION)
    TABLE 78. ITALY SUSTAINABLE PACKAGING MARKET, BY PACKAGING TYPE, 2021-2031 ($MILLION)
    TABLE 79. ITALY SUSTAINABLE PACKAGING MARKET, BY END USE, 2021-2031 ($MILLION)
    TABLE 80. SPAIN SUSTAINABLE PACKAGING MARKET, BY MATERIAL TYPE, 2021-2031 ($MILLION)
    TABLE 81. SPAIN PLASTICS SUSTAINABLE PACKAGING MARKET, BY TYPE, 2021-2031 ($MILLION)
    TABLE 82. SPAIN PLASTICS SUSTAINABLE PACKAGING MARKET FOR BIODEGRADABLE, BY TYPE, 2021–2031 ($MILLION)
    TABLE 83. SPAIN PLASTICS SUSTAINABLE PACKAGING MARKET FOR BIO-BASED, BY TYPE, 2021–2031 ($MILLION)
    TABLE 84. SPAIN SUSTAINABLE PACKAGING MARKET, BY PACKAGING TYPE, 2021-2031 ($MILLION)
    TABLE 85. SPAIN SUSTAINABLE PACKAGING MARKET, BY END USE, 2021-2031 ($MILLION)
    TABLE 86. UK SUSTAINABLE PACKAGING MARKET, BY MATERIAL TYPE, 2021-2031 ($MILLION)
    TABLE 87. UK PLASTICS SUSTAINABLE PACKAGING MARKET, BY TYPE, 2021-2031 ($MILLION)
    TABLE 88. UK PLASTICS SUSTAINABLE PACKAGING MARKET FOR BIODEGRADABLE, BY TYPE, 2021–2031 ($MILLION)
    TABLE 89. UK PLASTICS SUSTAINABLE PACKAGING MARKET FOR BIO-BASED, BY TYPE, 2021–2031 ($MILLION)
    TABLE 90. UK SUSTAINABLE PACKAGING MARKET, BY PACKAGING TYPE, 2021-2031 ($MILLION)
    TABLE 91. UK SUSTAINABLE PACKAGING MARKET, BY END USE, 2021-2031 ($MILLION)
    TABLE 92. REST OF EUROPE SUSTAINABLE PACKAGING MARKET, BY MATERIAL TYPE, 2021-2031 ($MILLION)
    TABLE 93. REST OF EUROPE PLASTICS SUSTAINABLE PACKAGING MARKET, BY TYPE, 2021-2031 ($MILLION)
    TABLE 94. REST OF EUROPE PLASTICS SUSTAINABLE PACKAGING MARKET FOR BIODEGRADABLE, BY TYPE, 2021–2031 ($MILLION)
    TABLE 95. REST OF EUROPE PLASTICS SUSTAINABLE PACKAGING MARKET FOR BIO-BASED, BY TYPE, 2021–2031 ($MILLION)
    TABLE 96. REST OF EUROPE SUSTAINABLE PACKAGING MARKET, BY PACKAGING TYPE, 2021-2031 ($MILLION)
    TABLE 97. REST OF EUROPE SUSTAINABLE PACKAGING MARKET, BY END USE, 2021-2031 ($MILLION)
    TABLE 98. ASIA-PACIFIC SUSTAINABLE PACKAGING MARKET, BY MATERIAL TYPE, 2021-2031 ($MILLION)
    TABLE 99. ASIA-PACIFIC PLASTICS SUSTAINABLE PACKAGING MARKET, BY TYPE, 2021-2031 ($MILLION)
    TABLE 100. ASIA-PACIFIC PLASTICS SUSTAINABLE PACKAGING MARKET FOR BIODEGRADABLE, BY TYPE, 2021–2031 ($MILLION)
    TABLE 101. ASIA-PACIFIC PLASTICS SUSTAINABLE PACKAGING MARKET FOR BIO-BASED, BY TYPE, 2021–2031 ($MILLION)
    TABLE 102. ASIA-PACIFIC SUSTAINABLE PACKAGING MARKET, BY PACKAGING TYPE, 2021-2031 ($MILLION)
    TABLE 103. ASIA-PACIFIC SUSTAINABLE PACKAGING MARKET, BY END USE, 2021-2031 ($MILLION)
    TABLE 104. ASIA-PACIFIC SUSTAINABLE PACKAGING MARKET, BY COUNTRY, 2021-2031 ($MILLION)
    TABLE 105. CHINA SUSTAINABLE PACKAGING MARKET, BY MATERIAL TYPE, 2021-2031 ($MILLION)
    TABLE 106. CHINA PLASTICS SUSTAINABLE PACKAGING MARKET, BY TYPE, 2021-2031 ($MILLION)
    TABLE 107. CHINA PLASTICS SUSTAINABLE PACKAGING MARKET FOR BIODEGRADABLE, BY TYPE, 2021–2031 ($MILLION)
    TABLE 108. CHINA PLASTICS SUSTAINABLE PACKAGING MARKET FOR BIO-BASED, BY TYPE, 2021–2031 ($MILLION)
    TABLE 109. CHINA SUSTAINABLE PACKAGING MARKET, BY PACKAGING TYPE, 2021-2031 ($MILLION)
    TABLE 110. CHINA SUSTAINABLE PACKAGING MARKET, BY END USE, 2021-2031 ($MILLION)
    TABLE 111. JAPAN SUSTAINABLE PACKAGING MARKET, BY MATERIAL TYPE, 2021-2031 ($MILLION)
    TABLE 112. JAPAN PLASTICS SUSTAINABLE PACKAGING MARKET, BY TYPE, 2021-2031 ($MILLION)
    TABLE 113. JAPAN PLASTICS SUSTAINABLE PACKAGING MARKET FOR BIODEGRADABLE, BY TYPE, 2021–2031 ($MILLION)
    TABLE 114. JAPAN PLASTICS SUSTAINABLE PACKAGING MARKET FOR BIO-BASED, BY TYPE, 2021–2031 ($MILLION)
    TABLE 115. JAPAN SUSTAINABLE PACKAGING MARKET, BY PACKAGING TYPE, 2021-2031 ($MILLION)
    TABLE 116. JAPAN SUSTAINABLE PACKAGING MARKET, BY END USE, 2021-2031 ($MILLION)
    TABLE 117. INDIA SUSTAINABLE PACKAGING MARKET, BY MATERIAL TYPE, 2021-2031 ($MILLION)
    TABLE 118. INDIA PLASTICS SUSTAINABLE PACKAGING MARKET, BY TYPE, 2021-2031 ($MILLION)
    TABLE 119. INDIA PLASTICS SUSTAINABLE PACKAGING MARKET FOR BIODEGRADABLE, BY TYPE, 2021–2031 ($MILLION)
    TABLE 120. INDIA PLASTICS SUSTAINABLE PACKAGING MARKET FOR BIO-BASED, BY TYPE, 2021–2031 ($MILLION)
    TABLE 121. INDIA SUSTAINABLE PACKAGING MARKET, BY PACKAGING TYPE, 2021-2031 ($MILLION)
    TABLE 122. INDIA SUSTAINABLE PACKAGING MARKET, BY END USE, 2021-2031 ($MILLION)
    TABLE 123. SOUTH KOREA SUSTAINABLE PACKAGING MARKET, BY MATERIAL TYPE, 2021-2031 ($MILLION)
    TABLE 124. SOUTH KOREA PLASTICS SUSTAINABLE PACKAGING MARKET, BY TYPE, 2021-2031 ($MILLION)
    TABLE 125. SOUTH KOREA PLASTICS SUSTAINABLE PACKAGING MARKET FOR BIODEGRADABLE, BY TYPE, 2021–2031 ($MILLION)
    TABLE 126. SOUTH KOREA PLASTICS SUSTAINABLE PACKAGING MARKET FOR BIO-BASED, BY TYPE, 2021–2031 ($MILLION)
    TABLE 127. SOUTH KOREA SUSTAINABLE PACKAGING MARKET, BY PACKAGING TYPE, 2021-2031 ($MILLION)
    TABLE 128. SOUTH KOREA SUSTAINABLE PACKAGING MARKET, BY END USE, 2021-2031 ($MILLION)
    TABLE 129. REST OF ASIA-PACIFIC SUSTAINABLE PACKAGING MARKET, BY MATERIAL TYPE, 2021-2031 ($MILLION)
    TABLE 130. REST OF ASIA-PACIFIC PLASTICS SUSTAINABLE PACKAGING MARKET, BY TYPE, 2021-2031 ($MILLION)
    TABLE 131. REST OF ASIA-PACIFIC PLASTICS SUSTAINABLE PACKAGING MARKET FOR BIODEGRADABLE, BY TYPE, 2021–2031 ($MILLION)
    TABLE 132. REST OF ASIA-PACIFIC PLASTICS SUSTAINABLE PACKAGING MARKET FOR BIO-BASED, BY TYPE, 2021–2031 ($MILLION)
    TABLE 133. REST OF ASIA-PACIFIC SUSTAINABLE PACKAGING MARKET, BY PACKAGING TYPE, 2021-2031 ($MILLION)
    TABLE 134. REST OF ASIA-PACIFIC SUSTAINABLE PACKAGING MARKET, BY END USE, 2021-2031 ($MILLION)
    TABLE 135. LAMEA SUSTAINABLE PACKAGING MARKET, BY MATERIAL TYPE, 2021-2031 ($MILLION)
    TABLE 136. LAMEA PLASTICS SUSTAINABLE PACKAGING MARKET, BY TYPE, 2021-2031 ($MILLION)
    TABLE 137. LAMEA PLASTICS SUSTAINABLE PACKAGING MARKET FOR BIODEGRADABLE, BY TYPE, 2021–2031 ($MILLION)
    TABLE 138. LAMEA PLASTICS SUSTAINABLE PACKAGING MARKET FOR BIO-BASED, BY TYPE, 2021–2031 ($MILLION)
    TABLE 139. LAMEA SUSTAINABLE PACKAGING MARKET, BY PACKAGING TYPE, 2021-2031 ($MILLION)
    TABLE 140. LAMEA SUSTAINABLE PACKAGING MARKET, BY END USE, 2021-2031 ($MILLION)
    TABLE 141. LAMEA SUSTAINABLE PACKAGING MARKET, BY COUNTRY, 2021-2031 ($MILLION)
    TABLE 142. BRAZIL SUSTAINABLE PACKAGING MARKET, BY MATERIAL TYPE, 2021-2031 ($MILLION)
    TABLE 143. BRAZIL PLASTICS SUSTAINABLE PACKAGING MARKET, BY TYPE, 2021-2031 ($MILLION)
    TABLE 144. BRAZIL PLASTICS SUSTAINABLE PACKAGING MARKET FOR BIODEGRADABLE, BY TYPE, 2021–2031 ($MILLION)
    TABLE 145. BRAZIL PLASTICS SUSTAINABLE PACKAGING MARKET FOR BIO-BASED, BY TYPE, 2021–2031 ($MILLION)
    TABLE 146. BRAZIL SUSTAINABLE PACKAGING MARKET, BY PACKAGING TYPE, 2021-2031 ($MILLION)
    TABLE 147. BRAZIL SUSTAINABLE PACKAGING MARKET, BY END USE, 2021-2031 ($MILLION)
    TABLE 148. ARGENTINA SUSTAINABLE PACKAGING MARKET, BY MATERIAL TYPE, 2021-2031 ($MILLION)
    TABLE 149. ARGENTINA PLASTICS SUSTAINABLE PACKAGING MARKET, BY TYPE, 2021-2031 ($MILLION)
    TABLE 150. ARGENTINA PLASTICS SUSTAINABLE PACKAGING MARKET FOR BIODEGRADABLE, BY TYPE, 2021–2031 ($MILLION)
    TABLE 151. ARGENTINA PLASTICS SUSTAINABLE PACKAGING MARKET FOR BIO-BASED, BY TYPE, 2021–2031 ($MILLION)
    TABLE 152. ARGENTINA SUSTAINABLE PACKAGING MARKET, BY PACKAGING TYPE, 2021-2031 ($MILLION)
    TABLE 153. ARGENTINA SUSTAINABLE PACKAGING MARKET, BY END USE, 2021-2031 ($MILLION)
    TABLE 154. SAUDI ARABIA SUSTAINABLE PACKAGING MARKET, BY MATERIAL TYPE, 2021-2031 ($MILLION)
    TABLE 155. SAUDI ARABIA PLASTICS SUSTAINABLE PACKAGING MARKET, BY TYPE, 2021-2031 ($MILLION)
    TABLE 156. SAUDI ARABIA PLASTICS SUSTAINABLE PACKAGING MARKET FOR BIODEGRADABLE, BY TYPE, 2021–2031 ($MILLION)
    TABLE 157. SAUDI ARABIA PLASTICS SUSTAINABLE PACKAGING MARKET FOR BIO-BASED, BY TYPE, 2021–2031 ($MILLION)
    TABLE 158. SAUDI ARABIA SUSTAINABLE PACKAGING MARKET, BY PACKAGING TYPE, 2021-2031 ($MILLION)
    TABLE 159. SAUDI ARABIA SUSTAINABLE PACKAGING MARKET, BY END USE, 2021-2031 ($MILLION)
    TABLE 160. REST OF LAMEA SUSTAINABLE PACKAGING MARKET, BY MATERIAL TYPE, 2021-2031 ($MILLION)
    TABLE 161. REST OF LAMEA PLASTICS SUSTAINABLE PACKAGING MARKET, BY TYPE, 2021-2031 ($MILLION)
    TABLE 162. REST OF LAMEA PLASTICS SUSTAINABLE PACKAGING MARKET FOR BIODEGRADABLE, BY TYPE, 2021–2031 ($MILLION)
    TABLE 163. REST OF LAMEA PLASTICS SUSTAINABLE PACKAGING MARKET FOR BIO-BASED, BY TYPE, 2021–2031 ($MILLION)
    TABLE 164. REST OF LAMEA SUSTAINABLE PACKAGING MARKET, BY PACKAGING TYPE, 2021-2031 ($MILLION)
    TABLE 165. REST OF LAMEA SUSTAINABLE PACKAGING MARKET, BY END USE, 2021-2031 ($MILLION)
    TABLE 166. KEY NEW PRODUCT LAUNCHES (2018-2022)
    TABLE 167. KEY EXPANSIONS (2018-2022)
    TABLE 168. KEY ACQUISITION (2018-2022)
    TABLE 169. KEY COLLABORATION (2018-2022)
    TABLE 170. KEY PARTNERSHIP (2018-2022)
    TABLE 171. AMCOR PLC: COMPANY SNAPSHOT
    TABLE 172. AMCOR PLC: OPERATING SEGMENTS
    TABLE 173. AMCOR PLC: PRODUCT PORTFOLIO
    TABLE 174. OVERALL FINANCIAL STATUS ($MILLION)
    TABLE 175. AMCOR PLC: KEY STRATEGIC MOVES AND DEVELOPMENTS
    TABLE 176. ARDAGH GROUP S.A.: COMPANY SNAPSHOT
    TABLE 177. ARDAGH GROUP S.A.: OPERATING SEGMENTS
    TABLE 178. ARDAGH GROUP S.A.: PRODUCT PORTFOLIO
    TABLE 179. OVERALL FINANCIAL STATUS ($MILLION)
    TABLE 180. ARDAGH GROUP S.A.: KEY STRATEGIC MOVES AND DEVELOPMENTS
    TABLE 181. BALL CORPORATION: COMPANY SNAPSHOT
    TABLE 182. BALL CORPORATION: OPERATING SEGMENTS
    TABLE 183. BALL CORPORATION: PRODUCT PORTFOLIO
    TABLE 184. OVERALL FINANCIAL STATUS ($MILLION)
    TABLE 185. BALL CORPORATION: KEY STRATEGIC MOVES AND DEVELOPMENTS
    TABLE 186. BASF: COMPANY SNAPSHOT
    TABLE 187. BASF: OPERATING SEGMENTS
    TABLE 188. BASF: PRODUCT PORTFOLIO
    TABLE 189. BASF:OVERALL FINANCIAL STATUS ($MILLION)
    TABLE 190. BASF: KEY STRATEGIC MOVES AND DEVELOPMENTS
    TABLE 191. CROWN HOLDINGS, INC.: COMPANY SNAPSHOT
    TABLE 192. CROWN HOLDINGS, INC.: OPERATING SEGMENTS
    TABLE 193. CROWN HOLDINGS, INC.: PRODUCT PORTFOLIO
    TABLE 194. OVERALL FINANCIAL STATUS ($MILLION)
    TABLE 195. CROWN HOLDINGS, INC.: KEY STRATEGIC MOVES AND DEVELOPMENTS
    TABLE 196. DS SMITH: COMPANY SNAPSHOT
    TABLE 197. DS SMITH: OPERATING SEGMENTS
    TABLE 198. DS SMITH:PRODUCT PORTFOLIO
    TABLE 199. OVERALL FINANCIAL STATUS ($MILLION)
    TABLE 200. DS SMITH: KEY STRATEGIC MOVES AND DEVELOPMENTS
    TABLE 201. ELOPAK AS: COMPANY SNAPSHOT
    TABLE 202. ELOPAK AS: OPERATING SEGMENTS
    TABLE 203. ELOPAK AS: PRODUCT PORTFOLIO
    TABLE 204. OVERALL FINANCIAL STATUS ($MILLION)
    TABLE 205. ELOPAK AS: KEY STRATEGIC MOVES AND DEVELOPMENTS
    TABLE 206. EMERALD PACKAGING: COMPANY SNAPSHOT
    TABLE 207. EMERALD PACKAGING: PRODUCT PORTFOLIO
    TABLE 208. MONDI: COMPANY SNAPSHOT
    TABLE 209. MONDI: OPERATING SEGMENTS
    TABLE 210. MONDI: PRODUCT PORTFOLIO
    TABLE 211. OVERALL FINANCIAL STATUS ($MILLION)
    TABLE 212. MONDI: KEY STRATEGIC MOVES AND DEVELOPMENTS
    TABLE 213. NAMPAK LTD.: COMPANY SNAPSHOT
    TABLE 214. NAMPAK LTD.: OPERATING SEGMENTS
    TABLE 215. NAMPAK LTD.: PRODUCT PORTFOLIO
    TABLE 216. OVERALL FINANCIAL STATUS ($MILLION)
    TABLE 217. PLASTIPAK HOLDINGS, INC.: COMPANY SNAPSHOT
    TABLE 218. PLASTIPAK HOLDINGS, INC.: PRODUCT PORTFOLIO
    TABLE 219. PLASTIPAK HOLDINGS, INC.: KEY STRATEGIC MOVES AND DEVELOPMENTS
    TABLE 220. SEALED AIR: COMPANY SNAPSHOT
    TABLE 221. SEALED AIR: OPERATING SEGMENTS
    TABLE 222. SEALED AIR: PRODUCT PORTFOLIO
    TABLE 223. SEALED AIR: OVERALL FINANCIAL STATUS ($MILLION)
    TABLE 224. SEALED AIR: KEY STRATEGIC MOVES AND DEVELOPMENTS
    TABLE 225. SGF: COMPANY SNAPSHOT
    TABLE 226. SGF: PRODUCT PORTFOLIO
    TABLE 227. SMURFIT: COMPANY SNAPSHOT
    TABLE 228. SMURFIT: PRODUCT PORTFOLIO
    TABLE 229. OVERALL FINANCIAL STATUS ($MILLION)
    TABLE 230. SONOCO: COMPANY SNAPSHOT
    TABLE 231. SONOCO: OPERATING SEGMENTS
    TABLE 232. SONOCO: PRODUCT PORTFOLIO
    TABLE 233. SONOCO OVERALL FINANCIAL STATUS ($MILLION)
    TABLE 234. SONOCO: KEY STRATEGIC MOVES AND DEVELOPMENTS
    TABLE 235. TETRA: COMPANY SNAPSHOT
    TABLE 236. TETRA: PRODUCT PORTFOLIO
    TABLE 237. WESTROCK: COMPANY SNAPSHOT
    TABLE 238. WESTROCK: OPERATING SEGMENTS
    TABLE 239. WESTROCK: PRODUCT PORTFOLIO
    TABLE 240. OVERALL FINANCIAL STATUS ($MILLION)
  • LIST OF FIGURES

  • FIGURE 01. SUSTAINABLE PACKAGING MARKET SEGMENTATION
    FIGURE 02. TOP INVESTMENT POCKETS
    FIGURE 03. MODERATE BARGAINING POWER OF SUPPLIERS
    FIGURE 04. MODERATE BARGAINING POWER OF BUYERS
    FIGURE 05. MODERATE THREAT OF NEW ENTRANTS
    FIGURE 06. MODERATE THREAT OF SUBSTITUTES
    FIGURE 07. MODERATE COMPETITIVE RIVALRY
    FIGURE 08. SUSTAINABLE PACKAGING MARKET DYNAMICS
    FIGURE 09. PACKAGED PRODUCT LIFE-CYCLE
    FIGURE 10. SUPPLY CHAIN ANALYSIS
    FIGURE 11. MATERIALS TO BE REMOVED TILL 2024
    FIGURE 12. SUSTAINABLE PACKAGING MARKET: PATENT ANALYSIS BY COUNTRY
    FIGURE 13. SUSTAINABLE PACKAGING MARKET: PATENT ANALYSIS BY APPLICANTS
    FIGURE 14. SUSTAINABLE PACKAGING MARKET: PATENT ANALYSIS BY INVENTORS
    FIGURE 15. SUSTAINABLE PACKAGING MARKET, BY MATERIAL TYPE, 2022–2031 ($MILLION)
    FIGURE 16. COMPARATIVE ANALYSIS OF SUSTAINABLE PACKAGING MARKET, FOR PAPER AND PAPERBOARD BY COUNTRY, 2022 & 2031 ($MILLION)
    FIGURE 17. COMPARATIVE ANALYSIS OF SUSTAINABLE PACKAGING MARKET, FOR PLASTICS BY COUNTRY, 2022 & 2031 ($MILLION)
    FIGURE 18. COMPARATIVE ANALYSIS OF SUSTAINABLE PACKAGING MARKET, FOR ALUMINUM BY COUNTRY, 2022 & 2031 ($MILLION)
    FIGURE 19. COMPARATIVE ANALYSIS OF SUSTAINABLE PACKAGING MARKET, FOR OTHERS BY COUNTRY, 2022 & 2031 ($MILLION)
    FIGURE 20. SUSTAINABLE PACKAGING MARKET, BY PACKAGING TYPE, 2022–2031 ($MILLION)
    FIGURE 21. COMPARATIVE ANALYSIS OF SUSTAINABLE PACKAGING MARKET, FOR RIGID PACKAGING BY COUNTRY, 2022 & 2031 ($MILLION)
    FIGURE 22. COMPARATIVE ANALYSIS OF SUSTAINABLE PACKAGING MARKET, FOR FLEXIBLE PACKAGING BY COUNTRY, 2022 & 2031 ($MILLION)
    FIGURE 23. SUSTAINABLE PACKAGING MARKET, BY END USE, 2022–2031 ($MILLION)
    FIGURE 24. COMPARATIVE ANALYSIS OF SUSTAINABLE PACKAGING MARKET FOR FOOD AND BEVERAGE, BY COUNTRY, 2022 & 2031 ($MILLION)
    FIGURE 25. COMPARATIVE ANALYSIS OF SUSTAINABLE PACKAGING MARKET FOR PERSONAL CARE, BY COUNTRY, 2022 & 2031 ($MILLION)
    FIGURE 26. COMPARATIVE ANALYSIS OF SUSTAINABLE PACKAGING MARKET FOR HEALTHCARE AND PHARMACEUTICALS, BY COUNTRY, 2022 & 2031 ($MILLION)
    FIGURE 27. COMPARATIVE ANALYSIS OF SUSTAINABLE PACKAGING MARKET FOR OTHERS, BY COUNTRY, 2022 & 2031 ($MILLION)
    FIGURE 28. U.S. SUSTAINABLE PACKAGING MARKET, 2021–2031 ($MILLION)
    FIGURE 29. CANADA SUSTAINABLE PACKAGING MARKET, 2021–2031 ($MILLION)
    FIGURE 30. MEXICO SUSTAINABLE PACKAGING MARKET, 2021–2031 ($MILLION)
    FIGURE 31. GERMANY SUSTAINABLE PACKAGING MARKET, 2021–2031 ($MILLION)
    FIGURE 32. FRANCE SUSTAINABLE PACKAGING MARKET, 2021–2031 ($MILLION)
    FIGURE 33. ITALY SUSTAINABLE PACKAGING MARKET, 2021–2031 ($MILLION)
    FIGURE 34. SPAIN SUSTAINABLE PACKAGING MARKET, 2021–2031 ($MILLION)
    FIGURE 35. UK SUSTAINABLE PACKAGING MARKET, 2021–2031 ($MILLION)
    FIGURE 36. REST OF EUROPE SUSTAINABLE PACKAGING MARKET, 2021–2031 ($MILLION)
    FIGURE 37. CHINA SUSTAINABLE PACKAGING MARKET, 2021–2031 ($MILLION)
    FIGURE 38. JAPAN SUSTAINABLE PACKAGING MARKET, 2021–2031 ($MILLION)
    FIGURE 39. INDIA SUSTAINABLE PACKAGING MARKET, 2021–2031 ($MILLION)
    FIGURE 40. SOUTH KOREA SUSTAINABLE PACKAGING MARKET, 2021–2031 ($MILLION)
    FIGURE 41. REST OF ASIA-PACIFIC SUSTAINABLE PACKAGING MARKET, 2021–2031 ($MILLION)
    FIGURE 42. BRAZIL SUSTAINABLE PACKAGING MARKET, 2021–2031 ($MILLION)
    FIGURE 43. ARGENTINA SUSTAINABLE PACKAGING MARKET, 2021–2031 ($MILLION)
    FIGURE 44. SAUDI ARABIA SUSTAINABLE PACKAGING MARKET, 2021–2031 ($MILLION)
    FIGURE 45. REST OF LAMEA SUSTAINABLE PACKAGING MARKET, 2021–2031 ($MILLION)
    FIGURE 46. MARKET PLAYER POSITIONING, 2021
    FIGURE 47. TOP WINNING STRATEGIES, BY YEAR, 2018–2022
    FIGURE 48. TOP WINNING STRATEGIES, BY DEVELOPMENT, 2018–2022 (%)
    FIGURE 49. TOP WINNING STRATEGIES, BY COMPANY, 2018–2022
    FIGURE 50. PRODUCT MAPPING OF TOP PLAYERS
    FIGURE 51. COMPETITIVE HEATMAP OF KEY PLAYERS
    FIGURE 52. AMCOR PLC: REVENUE, 2019-2021 ($MILLION)
    FIGURE 53. AMCOR PLC: REVENUE SHARE BY SEGMENT, 2021 (%)
    FIGURE 54. AMCOR PLC: REVENUE SHARE BY REGION, 2021 (%)
    FIGURE 55. ARDAGH GROUP S.A.: REVENUE, 2019-2021 ($MILLION)
    FIGURE 56. ARDAGH GROUP S.A.: REVENUE SHARE BY SEGMENT, 2021 (%)
    FIGURE 57. BALL CORPORATION: REVENUE, 2019-2021 ($MILLION)
    FIGURE 58. BASF: REVENUE, 2019–2021 ($MILLION)
    FIGURE 59. BASF: REVENUE SHARE BY SEGMENT, 2021(%)
    FIGURE 60. BASF: REVENUE SHARE BY REGION, 2021 (%)
    FIGURE 61. CROWN HOLDINGS, INC,: REVENUE, 2019-2021 ($MILLION)
    FIGURE 62. CROWN HOLDINGS, INC.: REVENUE SHARE BY SEGMENT, 2021 (%)
    FIGURE 63. CROWN HOLDINGS, INC.: REVENUE SHARE BY REGION, 2021 (%)
    FIGURE 64. DS SMITH: REVENUE, 2019-2021 ($MILLION)
    FIGURE 65. DS SMITH: REVENUE SHARE BY SEGMENT, 2021 (%)
    FIGURE 66. DS SMITH: REVENUE SHARE BY REGION, 2021 (%)
    FIGURE 67. ELOPAK AS: REVENUE, 2019-2021 ($MILLION)
    FIGURE 68. ELOPAK AS: REVENUE SHARE BY SEGMENT, 2021 (%)
    FIGURE 69. ELOPAK AS: REVENUE SHARE BY REGION, 2021 (%)
    FIGURE 70. MONDI: REVENUE, 2019–2021 ($MILLION)
    FIGURE 71. MONDI: REVENUE SHARE BY SEGMENT, 2021 (%)
    FIGURE 72. MONDI: REVENUE SHARE BY REGION, 2021 (%)
    FIGURE 73. NAMPAK LTD.: REVENUE, 2019-2021 ($MILLION)
    FIGURE 74. NAMPAK LTD.: REVENUE SHARE BY SEGMENT, 2021 (%)
    FIGURE 75. NAMPAK LTD.: REVENUE SHARE BY REGION, 2021 (%)
    FIGURE 76. SEALED AIR: REVENUE, 2019–2021 ($MILLION)
    FIGURE 77. SEALED AIR: REVENUE SHARE BY SEGMENT, 2021(%)
    FIGURE 78. SEALED AIR: REVENUE SHARE BY REGION, 2021 (%)
    FIGURE 79. SMURFIT: NET SALES, 2019–2021 ($MILLION)
    FIGURE 80. SMURFIT: REVENUE SHARE BY REGION, 2021 (%)
    FIGURE 81. SONOCO: REVENUE, 2019–2021 ($MILLION)
    FIGURE 82. SONOCO: REVENUE SHARE BY SEGMENT, 2021(%)
    FIGURE 83. SONOCO: REVENUE SHARE BY REGION, 2021 (%)
    FIGURE 84. WESTROCK: REVENUE, 2019–2021 ($MILLION)
    FIGURE 85. WESTROCK: REVENUE SHARE BY SEGMENT, 2021 (%)


According to CXO Perspective, Sustainable packaging refers to the development and use of packaging with improved sustainability. Growing environmental awareness has led to a shift to eco-friendly packaging. Consumer preference for low cost, lightweight and biodegradable packaging has increased the need for lightweight, recyclable and sustainable packaging. Therefore, the adoption of sustainable packaging in the packaging industry projects significant growth for the sustainable packaging market during the forecast period.

Growing public awareness of the concept of recycling and reusing products to protect the environment from harmful effects has led to the growth of the sustainable packaging market. In addition, the use of biodegradable packaging materials provides consumers with an eco-friendly and healthy option. This concept has played a key role in creating new dimensions of innovation. The sustainable packaging industry offers a wide range of opportunities for both suppliers and manufacturers. suppliers can provide raw materials to new entrants who have invested in the sustainable packaging industry, such as Dell. Dell has started shipping products in packages containing mushroom ingredients that combine mushrooms and straw.

PURCHASE OPTIONS

Call or Email us

U.S.-Canada Toll-free: +1-800-792-5285
Int'l : +1-503-894-6022
Europe : +44-845-528-1300
Email : help@alliedmarketresearch.com
 
FREQUENTLY ASKED QUESTIONS?

A. Rise in demand for sustainable food packaging and government regulations favoring sustainable packaging are the key factors boosting the Sustainable packaging market growth.

A. The market value of Sustainable packaging in 2031 is expected to be $190.6 billion

A. Amcor plc, Ardagh Group S.A., Ball Corporation, BASF SE, Crown Holdings, Inc., DS Smith, Elopak AS, Emerald Packaging, Mondi, Nampak Ltd., Plastipak Holdings, Inc., Sealed Air, Sgf packaging Co. Ltd, Smurfit Kappa Group PLC, Sonoco Products Company, Tetra Pak and WestRock Company

A. Packaging industry is projected to increase the demand for Sustainable packaging Market

A. The sustainable packaging market is segmented on the basis of material type, packaging type, end-use industry and region. On the basis of material type, the market is divided into paper & paperboard, plastics, aluminum and others. On the basis of packaging type, the market is classified into rigid packaging and flexible packaging. On the basis of end-use industry, the market is categorized into food & beverage, personal care, healthcare and pharmaceuticals and others. Region wise, the market is analyzed across North America, Europe, Asia-Pacific and LAMEA.

A. High demand from end-use industries is the Main Driver of Sustainable packaging Market.

A. Post covid-19, The growth of market was mainly due to the consumption of sustainable packaging products in different end-use industries including food & beverage industry, healthcare, cosmetics & personal care, and e-commerce. There is an increase in flexible, rigid plastics, and corrugated packaging. The food packaging industry continued to robust the demand of the sustainable packaging products owing to the increase in awareness regarding the hygiene. Moreover, there was high growth for rigid packaging for e-commerce and grocery deliveries. There was an incline towards the growth of sustainable packaging products in healthcare sector, including flexible blister foils, pumps, closures and rigid plastics. Also, the packaging used in dietary supplements such as vitamins and for essential supplies, such as allergy medication has boosted the market.

Looking for Customization?

 Customization Request

Have a Question?

 Speak with Analyst

Any Confusion?

 Inquire Before Buying

Have a glance of the Report

  Request Sample
RELATED TAGS

Purchase Full Report of
Sustainable Packaging Market

Start reading instantly.
This Report and over 67,404+ more Reports, Available with Avenue Library. T&C*.

  • Online Only
  • $3,570
  • Online cloud access only
  • Restricted print, copy, paste & download
  • Read only
  • Free industry update
    (Within 180 days)
  • Free report update in next update cycle
    (Sep 2023 - Sep 2024)
  • Data Pack
  • $3,840
  • Restricted to one authorized user
  • One print only
  • Available in
    Excel
  • Free industry update
    (Within 180 days)
  •   Free report update in next update cycle
    (Sep 2023 - Sep 2024)
  • Single User
  • $5,730
  • Restricted to one authorized user
  • One print only
  • Available in
    PDF
  • Free industry update
    (Within 180 days)
  •   Free report update in next update cycle
    (Sep 2023 - Sep 2024)
  • Five Users
  • $6,450
  • Limited to five authorized users
  • Print upto five copies
  • Available in
    PDF
  • Free industry update
    (Within 180 days)
  •   Free report update in next update cycle
    (Sep 2023 - Sep 2024)
  • Enterprise
    License/PDF

  • $9,600
  • Unlimited
    within
    company/enterprise
  • Available in Excel & PDF
  • Free industry update
    (Within 180 days)
  •   Free report update in next update cycle
    (Sep 2023 - Sep 2024)
  • Library
    Membership

  • $999 $ 1,175
    Per User/ Per month/ Billed annually
  • Published Content
    E-access
  • Company Profiles
    E-access
  • Newly Added Content Access
  • 10 PDF
    Downloads
  • 5 Excel Data
    Pack Downloads
  • 250 Company Profiles PDF Downloads
  • Buy Now

*Taxes/Fees, if applicable will be added during checkout. All prices in USD

RELATED REPORTS
 

Why Allied Market Research?


Infallible Methodology

To ensure high-level data integrity, accurate analysis, and impeccable forecasts

Analyst Support

For complete satisfaction

Customization

On-demand customization of scope of the report to exactly meet your needs

TARGETED MARKET VIEW

Targeted market view to provide pertinent information and save time of readers

Get fresh content delivered

Get insights on topics that are crucial for your business. Stay abreast of your interest areas.

Get Industry Data Alerts

Why Allied Market Research?

Infallible Methodology

To ensure high-level data integrity, accurate analysis, and impeccable forecasts

Analyst Support

For complete satisfaction

Customization

On-demand customization of scope of the report to exactly meet your needs

TARGETED MARKET VIEW

Targeted market view to provide pertinent information and save time of readers