Report Code: A06266 | Dec 2021 | Pages: 305 | ||
Tables: 167 | Charts: 75 |
|
Pandemic disrupted the entire world and affected many industries.
Get detailed COVID-19 impact analysis on the Tax Management Market
Request Now !
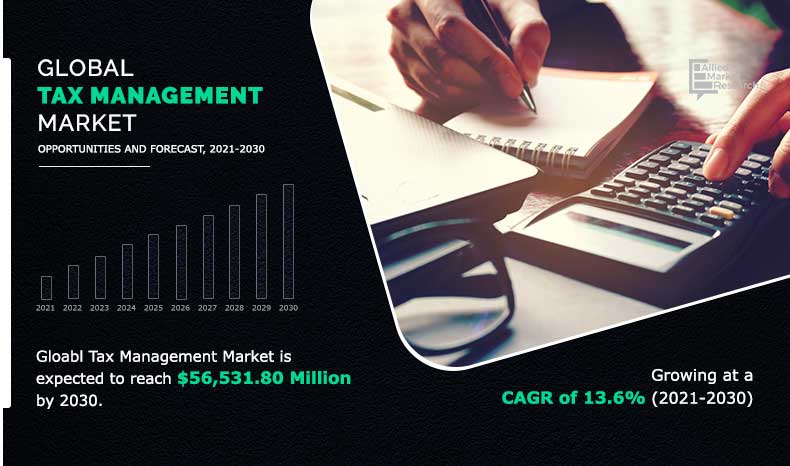
The global tax management market size was valued at $16,455.20 million in 2020, and is projected to reach $56,531.80 million by 2030, growing at a CAGR of 13.6% from 2021 to 2030.
The tax management market has witnessed significant growth in the year 2021 years owing to growing implementation of new tax policies by government authorities. Moreover, lifting of lockdown and restriction by governments in majority of the countries and the restarting of travels and tourism along with required caution across the world to boost the local economy which will help to drive the tax management market. The tax management industry is projected to grow rapidly in the upcoming years as most of countries are focusing on complete vaccination for rapid recovery from the COVID-19 pandemic. This factor accelerates the market growth globally.
The surge in demand among businesses for a single tax solution which can help them to solve business problems propels the growth of the tax management market. Organizations are increasingly using tax management software, which integrates variety of applications such as sales and billing software, purchases software, accounting and employee payroll system and other financial applications and can be customized for specific business needs and can be deployed across corporate networks on a variety of platforms. As firms grow, companies demand business-oriented tax management tax management that encode corporate policies, rules, and processes and are built in compliance with specific business requirements. With the growing number of employees in the office, and expanding business, these solutions can help accountants to perform better. This also aids in the improvement of gathering financial insights, increases corporate efficiency, and allows accounts manager to monitor and reduce excess tax which will result in increase in revenue.
On the basis of organizational size, the large-scale enterprise segment dominated the overall enterprise application industry in 2020, and is expected to continue this trend throughout the forecast period. This is due to an increase in the adoption of tax management software by enterprises to gain strategic and a competitive advantage over their competitors. Furthermore, it enables large-scale industry verticals to gain quick & easy-insights of financial condition and tax planning. Customers use tax management software to discover new tax and financial insights on large-scale diverse data, including historical and recent data. However, the small and medium scale enterprise segment is expected to grow the most, and this trend is expected to continue during the forecast period. The small and medium scale businesses are shifting their business to a digital platform, small scale businesses are using tax management solutions for a number of uses and it is helping them to become more productive, smarter, and efficient.
Depending on the deployment model, the on-premise segment captured the largest share in 2020 and is expected to continue this trend during the forecast period. This is due to the numerous advantages offered by this on-premise deployment such as a high level of data security and safety this will create tax management market growth in future. However, the cloud segment is expected to witness the highest growth in the upcoming years. As a cloud deployment requires no investment in IT infrastructure as all data is stored on cloud server, which increases the demand for tax management software in small and medium scale organizations.
The report focuses on the growth prospects, restraints, and opportunities of the tax management market analysis. The study provides Porter’s five forces analysis of tax management industry to understand the impact of various factors such as bargaining power of suppliers, competitive intensity of competitors, threat of new entrants, threat of substitutes, and bargaining power of buyers on the tax management market trends.
The tax management industry is segmented into component, tax type, deployment, organization size, industry vertical, and region. By component, it is divided into software and service. By tax type, it is bifurcated into direct tax and indirect tax. By deployment, it is segregated into on-premise and cloud. By organization size it is bifurcated into large enterprises and small and medium size enterprises. By industry vertical, it is segregated into manufacturing, BFSI, healthcare, retail and e commerce, telecom & IT, government and public sector, media & entertainment and others. Region wise, it is analyzed across North America, Europe, Asia-Pacific, and LAMEA
As per tax management market forecast the post COVID-19, the tax management market size was valued at $ 18,002.00 million in 2021 and is projected to reach $ 56,531.80 million by 2030, growing at a CAGR of 13.6% from 2020 to 2030.
The current estimation of 2030 is projected to be higher than pre-COVID-19 estimates. The market is expected to grow rapidly after the pandemic owing to rise in adoption of work-from-home culture across the
globe which can boost the use of tax management software in the market. The tax management software market has witnessed significant growth in the past few years owing to growing implementation of lockdown by governments in majority of the countries and the shutdown of travel across the world to prevent the transmission of virus. The tax management industry is projected to grow rapidly in the upcoming years after the recovery from the COVID-19 pandemic. This factor accelerates the market growth globally.
Top impacting factors such as continuous rise in digital financial transition volume and increase in complexity of tax laws drive the growth of the tax management market globally. Furthermore, surge in use of advanced technology for monitoring the tax payers and strict government policies related to collection of taxes will create lucrative opportunities for the market during the forecast period. However lack of skilled resources and increase in data security concerns hinder the growth of the market globally.
Technological advancement in finance sector and digital innovation has brought major improvements in connectivity of systems, in computing power and cost, and in newly created and usable data. These improvements have reduced the transaction costs and introduced new business models and new entrants in the tax management market. Technology has increased information exchange and reduced the transaction cost, which further increases the rate of transactions. It is possible for each and every person to make financial transaction very easily form their smart phone and tablets due to increase in use of mobile and tablets. Moreover, advent use of web based e-commerce and banking solutions increases the amount of online transaction globally. This increase in online digital transaction is projected to create demand for various tax management solutions for sales tax, gods and service tax which is anticipated to drive the growth of the market globally.
Key Benefits For Stakeholders
Tax Management Market Report Highlights
Aspects | Details |
---|---|
By Component |
|
By Tax Type |
|
By Deployment Mode |
|
By ORGANIZATION SIZE |
|
By Industry Vertical |
|
By Region |
|
By KEY MARKET PLAYERS PROFILED IN THE REPORT OF ENTERPRISE APPLICATION |
|
CHAPTER 1:INTRODUCTION
1.1.Report description
1.2.Key benefits for stakeholders
1.3.Key market segments
1.4.Research methodology
1.4.1.Secondary research
1.4.2.Primary research
1.4.3.Analyst tools & models
CHAPTER 2:EXECUTIVE SUMMARY
2.1.Key findings
2.1.1.Top impacting factors
2.1.2.Top investment pockets
2.2.CXO perspective
CHAPTER 3:MARKET OVERVIEW
3.1.Market definition and scope
3.2.Porter's five forces analysis
3.3.Case studies
3.3.1.Case Study 01
3.3.2.Case Study 02
3.4.Impact of government regulations on global Tax management market:
3.5.Market dynamics
3.5.1.Drivers
3.5.1.1.Increase in digital financial transitions volume
3.5.1.2.Rise in complexity and tax law
3.5.2.Restraints
3.5.2.1.Lack of skilled employee and high cost of implementation
3.5.2.2.Increase in security & privacy concerns of data
3.5.3.Opportunities
3.5.3.1.Use of block chain technology in monitoring of tax payers.
3.5.3.2.Strict government policies about collection of tax.
3.6.COVID-19 Impact Analysis
3.6.1.Impact on market size
3.6.2.Consumer trends, preferences, and budget impact
3.6.3.Economic impact
3.6.4.Key player strategies to tackle negative impact
3.6.5.Opportunity window
CHAPTER 4:GLOBAL TAX MANAGEMENT MARKET, BY COMPONENT
4.1.Overview
4.2.Software
4.2.1.Key market trends, growth factors, and opportunities
4.2.2.Market size and forecast, by region
4.2.3.Market analysis, by country
4.3.Services
4.3.1.Key market trends, growth factors, and opportunities
4.3.2.Market size and forecast, by region
4.3.3.Market analysis, by country
CHAPTER 5:GLOBAL TAX MANAGEMENT MARKET, BY TAX TYPE
5.1.Overview
5.2.Indirect Tax
5.2.1.Key market trends, growth factors, and opportunities
5.2.2.Market size and forecast, by region
5.2.3.Market analysis, by country
5.3.Direct Tax
5.3.1.Key market trends, growth factors, and opportunities
5.3.2.Market size and forecast, by region
5.3.3.Market analysis, by country
CHAPTER 6:GLOBAL TAX MANAGEMENT MARKET, BY DEPLOYMENT MODEL
6.1.Overview
6.2.On-premise
6.2.1.Key market trends, growth factors, and opportunities
6.2.2.Market size and forecast, by region
6.2.3.Market analysis, by country
6.3.Cloud
6.3.1.Key market trends, growth factors, and opportunities
6.3.2.Market size and forecast, by region
6.3.3.Market analysis, by country
CHAPTER 7:GLOBAL TAX MANAGEMENT MARKET, BY ORGANIZATION SIZE
7.1.Overview
7.2.Small & medium sized enterprises
7.2.1.Key market trends, growth factors, and opportunities
7.2.2.Market size and forecast, by region
7.2.3.Market analysis, by country
7.3.Large enterprises
7.3.1.Key market trends, growth factors, and opportunities
7.3.2.Market size and forecast, by region
7.3.3.Market analysis, by country
CHAPTER 8:TAX MANAGEMENT MARKET, BY INDUSTRY VERTICAL
8.1.Overview
8.2.Manufacturing
8.2.1.Key market trends, growth factors, and opportunities
8.2.2.Market size and forecast, by region
8.2.3.Market analysis, by country
8.3.BFSI
8.3.1.Key market trends, growth factors, and opportunities
8.3.2.Market size and forecast, by region
8.3.3.Market analysis, by country
8.4.Healthcare and life sciences
8.4.1.Key market trends, growth factors, and opportunities
8.4.2.Market size and forecast, by region
8.4.3.Market analysis, by country
8.5.Retail and E-commerce
8.5.1.Key market trends, growth factors, and opportunities
8.5.2.Market size and forecast, by region
8.5.3.Market analysis, by country
8.6.Energy and utility
8.6.1.Key market trends, growth factors, and opportunities
8.6.2.Market size and forecast, by region
8.6.3.Market analysis, by country
8.7.Media and entertainment
8.7.1.Key market trends, growth factors, and opportunities
8.7.2.Market size and forecast, by region
8.7.3.Market analysis, by country
8.8.IT and telecom
8.8.1.Key market trends, growth factors, and opportunities
8.8.2.Market size and forecast, by region
8.8.3.Market analysis, by country
8.9.Others
8.9.1.Key market trends, growth factors, and opportunities
8.9.2.Market size and forecast, by region
8.9.3.Market analysis, by country
CHAPTER 9:TAX MANAGEMENT MARKET, BY REGION
9.1.Overview
9.2.North America
9.2.1.Key market trends, growth factors and opportunities
9.2.2.Market size and forecast, by component
9.2.3.Market size and forecast, by tax type
9.2.4.Market size and forecast, by deployment mode
9.2.5.Market size and forecast, by organization size
9.2.6.Market size and forecast, by industry vertical
9.2.7.Market analysis, by country
9.2.7.1.U.S.
9.2.7.1.1.Market size and forecast, by component
9.2.7.1.2.Market size and forecast, by tax type
9.2.7.1.3.Market size and forecast, by deployment mode
9.2.7.1.4.Market size and forecast, by organization size
9.2.7.1.5.Market size and forecast, by industry vertical
9.2.7.2.Canada
9.2.7.2.1.Market size and forecast, by component
9.2.7.2.2.Market size and forecast, by tax type
9.2.7.2.3.Market size and forecast, by deployment mode
9.2.7.2.4.Market size and forecast, by organization size
9.2.7.2.5.Market size and forecast, by industry vertical
9.3.Europe
9.3.1.Key market trends, growth factors and opportunities
9.3.2.Market size and forecast, by component
9.3.3.Market size and forecast, by tax type
9.3.4.Market size and forecast, by deployment mode
9.3.5.Market size and forecast, by organization size
9.3.6.Market size and forecast, by industry vertical
9.3.7.Market analysis, by country
9.3.7.1.UK
9.3.7.1.1.Market size and forecast, by component
9.3.7.1.2.Market size and forecast, by Tax type
9.3.7.1.3.Market size and forecast, by deployment mode
9.3.7.1.4.Market size and forecast, by organization size
9.3.7.1.5.Market size and forecast, by industry vertical
9.3.7.2.Germany
9.3.7.2.1.Market size and forecast, by component
9.3.7.2.2.Market size and forecast, by tax type
9.3.7.2.3.Market size and forecast, by deployment mode
9.3.7.2.4.Market size and forecast, by organization size
9.3.7.2.5.Market size and forecast, by industry vertical
9.3.7.3.France
9.3.7.3.1.Market size and forecast, by component
9.3.7.3.2.Market size and forecast, by tax type
9.3.7.3.3.Market size and forecast, by deployment mode
9.3.7.3.4.Market size and forecast, by organization size
9.3.7.3.5.Market size and forecast, by industry vertical
9.3.7.4.Spain
9.3.7.4.1.Market size and forecast, by component
9.3.7.4.2.Market size and forecast, by tax type
9.3.7.4.3.Market size and forecast, by deployment mode
9.3.7.4.4.Market size and forecast, by organization size
9.3.7.4.5.Market size and forecast, by industry vertical
9.3.7.5.Italy
9.3.7.5.1.Market size and forecast, by component
9.3.7.5.2.Market size and forecast, by tax type
9.3.7.5.3.Market size and forecast, by deployment mode
9.3.7.5.4.Market size and forecast, by organization size
9.3.7.5.5.Market size and forecast, by industry vertical
9.3.7.6.Rest of Europe
9.3.7.6.1.Market size and forecast, by component
9.3.7.6.2.Market size and forecast, by tax type
9.3.7.6.3.Market size and forecast, by deployment mode
9.3.7.6.4.Market size and forecast, by organization size
9.3.7.6.5.Market size and forecast, by industry vertical
9.4.Asia-Pacific
9.4.1.Key market trends, growth factors and opportunities
9.4.2.Market size and forecast, by component
9.4.3.Market size and forecast, by tax type
9.4.4.Market size and forecast, by deployment mode
9.4.5.Market size and forecast, by organization size
9.4.6.Market size and forecast, by industry vertical
9.4.7.Market analysis, by country
9.4.7.1.China
9.4.7.1.1.Market size and forecast, by component
9.4.7.1.2.Market size and forecast, by tax type
9.4.7.1.3.Market size and forecast, by deployment mode
9.4.7.1.4.Market size and forecast, by organization size
9.4.7.1.5.Market size and forecast, by industry vertical
9.4.7.2.India
9.4.7.2.1.Market size and forecast, by component
9.4.7.2.2.Market size and forecast, by tax type
9.4.7.2.3.Market size and forecast, by deployment mode
9.4.7.2.4.Market size and forecast, by organization size
9.4.7.2.5.Market size and forecast, by industry vertical
9.4.7.3.Japan
9.4.7.3.1.Market size and forecast, by component
9.4.7.3.2.Market size and forecast, by tax type
9.4.7.3.3.Market size and forecast, by deployment mode
9.4.7.3.4.Market size and forecast, by organization size
9.4.7.3.5.Market size and forecast, by industry vertical
9.4.7.4.South Korea
9.4.7.4.1.Market size and forecast, by component
9.4.7.4.2.Market size and forecast, by tax type
9.4.7.4.3.Market size and forecast, by deployment mode
9.4.7.4.4.Market size and forecast, by organization size
9.4.7.4.5.Market size and forecast, by industry vertical
9.4.7.5.Australia
9.4.7.5.1.Market size and forecast, by component
9.4.7.5.2.Market size and forecast, by tax type
9.4.7.5.3.Market size and forecast, by deployment mode
9.4.7.5.4.Market size and forecast, by organization size
9.4.7.5.5.Market size and forecast, by industry vertical
9.4.7.6.Rest of Asia-Pacific
9.4.7.6.1.Market size and forecast, by component
9.4.7.6.2.Market size and forecast, by tax type
9.4.7.6.3.Market size and forecast, by deployment mode
9.4.7.6.4.Market size and forecast, by organization size
9.4.7.6.5.Market size and forecast, by industry vertical
9.5.LAMEA
9.5.1.Key market trends, growth factors and opportunities
9.5.2.Market size and forecast, by component
9.5.3.Market size and forecast, by tax type
9.5.4.Market size and forecast, by deployment mode
9.5.5.Market size and forecast, by organization size
9.5.6.Market size and forecast, by industry vertical
9.5.7.Market analysis, by country
9.5.7.1.Latin America
9.5.7.1.1.Market size and forecast, by component
9.5.7.1.2.Market size and forecast, by tax type
9.5.7.1.3.Market size and forecast, by deployment mode
9.5.7.1.4.Market size and forecast, by organization size
9.5.7.1.5.Market size and forecast, by industry vertical
9.5.7.2.Middle East
9.5.7.2.1.Market size and forecast, by component
9.5.7.2.2.Market size and forecast, by tax type
9.5.7.2.3.Market size and forecast, by deployment mode
9.5.7.2.4.Market size and forecast, by organization size
9.5.7.2.5.Market size and forecast, by industry vertical
9.5.7.3.Africa
9.5.7.3.1.Market size and forecast, by component
9.5.7.3.2.Market size and forecast, by tax type
9.5.7.3.3.Market size and forecast, by deployment mode
9.5.7.3.4.Market size and forecast, by organization size
9.5.7.3.5.Market size and forecast, by industry vertical
CHAPTER 10:COMPETITIVE LANDSCAPE
10.1.Key player positioning analysis, 2020
10.2.Top winning strategies
10.3.Competitive dashboard
CHAPTER 11:COMPANY PROFILES
11.1.AVALARA, INC.
11.1.1.Company snapshot
11.1.2.Product portfolio
11.1.3.R&D expenditure
11.1.4.Business performance
11.1.5.Key strategic moves and developments
11.2.BLUCORA, INC.
11.2.1.Company overview
11.2.2.Key executive
11.2.3.Company snapshot
11.2.4.Operating business segments
11.2.5.Product portfolio
11.2.6.Business performance
11.2.7.Key strategic moves and developments
11.3.HRB DIGITAL LLC.
11.3.1.Company overview
11.3.2.Key executives
11.3.3.Company snapshot
11.3.5.Product portfolio
11.3.6.Business performance
11.3.7.Key strategic moves and developments
11.4.INTUIT INC.
11.4.1.Company overview
11.4.2.Key executive
11.4.3.Company snapshot
11.4.5.Product portfolio
11.4.6.R&D expenditure
11.4.7.Business performance
11.4.8.Key strategic moves and developments
11.5.SAP SE
11.5.1.Company overview
11.5.2.Key executive
11.5.3.Company snapshot
11.5.4.Operating business segments
11.5.5.Product portfolio
11.5.6.R&D expenditure
11.5.7.Business performance
11.5.8.Key strategic moves and developments
11.6.SOVOS COMPLIANCE, LLC.
11.6.1.Company overview
11.6.2.Key executives
11.6.3.Company snapshot
11.6.4.Product portfolio
11.6.5.Key strategic moves and developments
11.7.Taxjar
11.7.1.Company overview
11.7.2.Key executives
11.7.3.Company snapshot
11.7.4.Product portfolio
11.7.5.Key strategic moves and developments
11.8.Taxslayer
11.8.1.Company overview
11.8.2.Key executive
11.8.3.Company snapshot
11.8.4.Product portfolio
11.8.5.Key strategic moves and developments
11.9.THOMSON REUTERS TAX & ACCOUNTING, INC.
11.9.1.Company overview
11.9.2.Key executives
11.9.3.Company snapshot
11.9.4.Operating business segments
11.9.5.Product portfolio
11.9.6.Business performance
11.9.7.Key strategic moves and developments
11.10.WOLTERS KLUWER N.V
11.10.1.Company overview
11.10.2.Key executives
11.10.3.Company snapshot
11.10.4.Operating business segments
11.10.5.Product portfolio
11.10.6.Business performance
11.10.7.Key strategic moves and developments
LIST OF TABLES
TABLE 01.GLOBAL TAX MANAGEMENT MARKET REVENUE, BY COMPONENT, 2020–2030 ($MILLION)
TABLE 02.TAX MANAGEMENT MARKET REVENUE FOR SOFTWARE, BY REGION, 2020–2030 ($MILLION)
TABLE 03.TAX MANAGEMENT MARKET REVENUE FOR SERVICES, BY REGION, 2020–2030 ($MILLION)
TABLE 04.GLOBAL TAX MANAGEMENT MARKET REVENUE, BY TAX TYPE, 2020-2030 ($MILLION)
TABLE 05.INDIRECT TAX MANAGEMENT MARKET REVENUE, BY REGION, 2020–2030 ($MILLION)
TABLE 06.DIRECT TAX MANAGEMENT MARKET REVENUE, BY REGION, 2020–2030 ($MILLION)
TABLE 07.GLOBAL TAX MANAGEMENT MARKET REVENUE, BY DEPLOYMENT MODEL, 2020-2030 ($MILLION)
TABLE 08.TAX MANAGEMENT MARKET REVENUE FOR ON-PREMISE, BY REGION, 2020–2030 ($MILLION)
TABLE 09.TAX MANAGEMENT MARKET REVENUE FOR CLOUD BASED DEPLOYMENT, BY REGION, 2020–2030 ($MILLION)
TABLE 10.GLOBAL TAX MANAGEMENT MARKET REVENUE, BY ORGANIZATION SIZE, 2020-2030 ($MILLION)
TABLE 11.TAX MANAGEMENT MARKET REVENUE FOR SMALL AND MEDIUM SIZED ENTERPRISES, BY REGION, 2020–2030 ($MILLION)
TABLE 12.TAX MANAGEMENT MARKET REVENUE FOR LARGE ENTERPRISES, BY REGION, 2020–2030 ($MILLION)
TABLE 13.GLOBAL TAX MANAGEMENT MARKET REVENUE, BY INDUSTRY VERTICAL, 2020-2030 ($MILLION)
TABLE 14.TAX MANAGEMENT MARKET REVENUE FOR MANUFACTURING, BY REGION 2020–2030 ($MILLION)
TABLE 15.TAX MANAGEMENT MARKET REVENUE FOR BFSI, BY REGION 2020–2030 ($MILLION)
TABLE 16.TAX MANAGEMENT MARKET REVENUE FOR HEALTHCARE AND LIFESCIENCE, BY REGION 2020–2030 ($MILLION)
TABLE 17.TAX MANAGEMENT MARKET REVENUE FOR RETAILS AND E-COMMERCE, BY REGION 2020–2030 ($MILLION)
TABLE 18.TAX MANAGEMENT MARKET REVENUE FOR ENERGY AND UTILITY, BY REGION 2020–2030 ($MILLION)
TABLE 19.TAX MANAGEMENT MARKET REVENUE FOR MEDIA AND ENTERTAINMENT, BY REGION 2020–2030 ($MILLION)
TABLE 20.TAX MANAGEMENT MARKET REVENUE FOR IT AND TELECOM, BY REGION 2020–2030 ($MILLION)
TABLE 21.TAX MANAGEMENT MARKET REVENUE FOR OTHERS, BY REGION 2020–2030 ($MILLION)
TABLE 22.TAX MANAGEMENT MARKET REVENUE, BY REGION, 2020–2030 ($MILLION)
TABLE 23.NORTH AMERICA TAX MANAGEMENT MARKET REVENUE, BY COMPONENT, 2020–2030 ($MILLION)
TABLE 24.NORTH AMERICA TAX MANAGEMENT MARKET REVENUE, BY TAX TYPE, 2020–2030 ($MILLION)
TABLE 25.NORTH AMERICA TAX MANAGEMENT MARKET REVENUE, BY DEPLOYMENT MODE, 2020–2030 ($MILLION)
TABLE 26.NORTH AMERICA TAX MANAGEMENT MARKET REVENUE, BY ORGANIZATION SIZE, 2020–2030 ($MILLION)
TABLE 27.NORTH AMERICA TAX MANAGEMENT MARKET REVENUE, BY INDUSTRY VERTICAL, 2020–2030 ($MILLION)
TABLE 28.NORTH AMERICA TAX MANAGEMENT MARKET REVENUE, BY COUNTRY, 2020–2030 ($MILLION)
TABLE 29.U.S. TAX MANAGEMENT MARKET REVENUE, BY COMPONENT, 2020–2030 ($MILLION)
TABLE 30.U.S. TAX MANAGEMENT MARKET REVENUE, BY TAX TYPE, 2020–2030 ($MILLION)
TABLE 31.U.S. TAX MANAGEMENT MARKET REVENUE, BY DEPLOYMENT MODE, 2020–2030 ($MILLION)
TABLE 32.U.S. TAX MANAGEMENT MARKET REVENUE, BY ORGANIZATION SIZE, 2020–2030 ($MILLION)
TABLE 33.U.S. TAX MANAGEMENT MARKET REVENUE, BY INDUSTRY VERTICAL, 2020–2030 ($MILLION)
TABLE 34.CANADA TAX MANAGEMENT MARKET REVENUE, BY COMPONENT, 2020–2030 ($MILLION)
TABLE 35.CANADA TAX MANAGEMENT MARKET REVENUE, BY TAX TYPE, 2020–2030 ($MILLION)
TABLE 36.CANADA TAX MANAGEMENT MARKET REVENUE, BY DEPLOYMENT MODE, 2020–2030 ($MILLION)
TABLE 37.CANADA TAX MANAGEMENT MARKET REVENUE, BY ORGANIZATION SIZE, 2020–2030 ($MILLION)
TABLE 38.CANADA TAX MANAGEMENT MARKET REVENUE, BY INDUSTRY VERTICAL, 2020–2030 ($MILLION)
TABLE 39.EUROPE TAX MANAGEMENT MARKET REVENUE, BY COMPONENT, 2020–2030 ($MILLION)
TABLE 40.EUROPE TAX MANAGEMENT MARKET REVENUE, BY TAX TYPE, 2020–2030 ($MILLION)
TABLE 41.EUROPE TAX MANAGEMENT MARKET REVENUE, BY DEPLOYMENT MODE, 2020–2030 ($MILLION)
TABLE 42.EUROPE TAX MANAGEMENT MARKET REVENUE, BY ORGANIZATION SIZE, 2020–2030 ($MILLION)
TABLE 43.EUROPE TAX MANAGEMENT MARKET REVENUE, BY INDUSTRY VERTICAL, 2020–2030 ($MILLION)
TABLE 44.EUROPE TAX MANAGEMENT MARKET REVENUE, BY COUNTRY, 2020–2030 ($MILLION)
TABLE 45.UK TAX MANAGEMENT MARKET REVENUE, BY COMPONENT, 2020–2030 ($MILLION)
TABLE 46.UK TAX MANAGEMENT MARKET REVENUE, BY TAX TYPE, 2020–2030 ($MILLION)
TABLE 47.UK TAX MANAGEMENT MARKET REVENUE, BY DEPLOYMENT MODE, 2020–2030 ($MILLION)
TABLE 48.UK TAX MANAGEMENT MARKET REVENUE, BY ORGANIZATION SIZE, 2020–2030 ($MILLION)
TABLE 49.UK TAX MANAGEMENT MARKET REVENUE, BY INDUSTRY VERTICAL, 2020–2030 ($MILLION)
TABLE 50.GERMANY TAX MANAGEMENT MARKET REVENUE, BY COMPONENT, 2020–2030 ($MILLION)
TABLE 51.GERMANY TAX MANAGEMENT MARKET REVENUE, BY TAX TYPE, 2020–2030 ($MILLION)
TABLE 52.GERMANY TAX MANAGEMENT MARKET REVENUE, BY DEPLOYMENT MODE, 2020–2030 ($MILLION)
TABLE 53.GERMANY TAX MANAGEMENT MARKET REVENUE, BY ORGANIZATION SIZE, 2020–2030 ($MILLION)
TABLE 54.GERMANY TAX MANAGEMENT MARKET REVENUE, BY INDUSTRY VERTICAL, 2020–2030 ($MILLION)
TABLE 55.FRANCE TAX MANAGEMENT MARKET REVENUE, BY COMPONENT, 2020–2030 ($MILLION)
TABLE 56.FRANCE TAX MANAGEMENT MARKET REVENUE, BY TAX TYPE, 2020–2030 ($MILLION)
TABLE 57.FRANCE TAX MANAGEMENT MARKET REVENUE, BY DEPLOYMENT MODE, 2020–2030 ($MILLION)
TABLE 58.FRANCE TAX MANAGEMENT MARKET REVENUE, BY ORGANIZATION SIZE, 2020–2030 ($MILLION)
TABLE 59.FRANCE TAX MANAGEMENT MARKET REVENUE, BY INDUSTRY VERTICAL, 2020–2030 ($MILLION)
TABLE 60.SPAIN TAX MANAGEMENT MARKET REVENUE, BY COMPONENT, 2020–2030 ($MILLION)
TABLE 61.SPAIN TAX MANAGEMENT MARKET REVENUE, BY TAX TYPE, 2020–2030 ($MILLION)
TABLE 62.SPAIN TAX MANAGEMENT MARKET REVENUE, BY DEPLOYMENT MODE, 2020–2030 ($MILLION)
TABLE 63.SPAIN TAX MANAGEMENT MARKET REVENUE, BY ORGANIZATION SIZE, 2020–2030 ($MILLION)
TABLE 64.SPAIN TAX MANAGEMENT MARKET REVENUE, BY INDUSTRY VERTICAL, 2020–2030 ($MILLION)
TABLE 65.ITALY TAX MANAGEMENT MARKET REVENUE, BY COMPONENT, 2020–2030 ($MILLION)
TABLE 66.ITALY TAX MANAGEMENT MARKET REVENUE, BY TAX TYPE, 2020–2030 ($MILLION)
TABLE 67.ITALY TAX MANAGEMENT MARKET REVENUE, BY DEPLOYMENT MODE, 2020–2030 ($MILLION)
TABLE 68.ITALY TAX MANAGEMENT MARKET REVENUE, BY ORGANIZATION SIZE, 2020–2030 ($MILLION)
TABLE 69.ITALY TAX MANAGEMENT MARKET REVENUE, BY INDUSTRY VERTICAL, 2020–2030 ($MILLION)
TABLE 70.REST OF EUROPE TAX MANAGEMENT MARKET REVENUE, BY COMPONENT, 2020–2030 ($MILLION)
TABLE 71.REST OF EUROPE TAX MANAGEMENT MARKET REVENUE, BY TAX TYPE, 2020–2030 ($MILLION)
TABLE 72.REST OF EUROPE TAX MANAGEMENT MARKET REVENUE, BY DEPLOYMENT MODE, 2020–2030 ($MILLION)
TABLE 73.REST OF EUROPE TAX MANAGEMENT MARKET REVENUE, BY ORGANIZATION SIZE, 2020–2030 ($MILLION)
TABLE 74.REST OF EUROPE TAX MANAGEMENT MARKET REVENUE, BY INDUSTRY VERTICAL, 2020–2030 ($MILLION)
TABLE 75.ASIA-PACIFIC TAX MANAGEMENT MARKET REVENUE, BY COMPONENT, 2020–2030 ($MILLION)
TABLE 76.ASIA-PACIFIC TAX MANAGEMENT MARKET REVENUE, BY TAX TYPE, 2020–2030 ($MILLION)
TABLE 77.ASIA-PACIFIC TAX MANAGEMENT MARKET REVENUE, BY DEPLOYMENT MODE, 2020–2030 ($MILLION)
TABLE 78.ASIA-PACIFIC TAX MANAGEMENT MARKET REVENUE, BY ORGANIZATION SIZE, 2020–2030 ($MILLION)
TABLE 79.ASIA-PACIFIC TAX MANAGEMENT MARKET REVENUE, BY INDUSTRY VERTICAL, 2020–2030 ($MILLION)
TABLE 80.ASIA-PACIFIC TAX MANAGEMENT MARKET REVENUE, BY COUNTRY, 2020–2030 ($MILLION)
TABLE 81.CHINA TAX MANAGEMENT MARKET REVENUE, BY COMPONENT, 2020–2030 ($MILLION)
TABLE 82.CHINA TAX MANAGEMENT MARKET REVENUE, BY TAX TYPE, 2020–2030 ($MILLION)
TABLE 83.CHINA TAX MANAGEMENT MARKET REVENUE, BY DEPLOYMENT MODE, 2020–2030 ($MILLION)
TABLE 84.CHINA TAX MANAGEMENT MARKET REVENUE, BY ORGANIZATION SIZE, 2020–2030 ($MILLION)
TABLE 85.CHINA TAX MANAGEMENT MARKET REVENUE, BY INDUSTRY VERTICAL, 2020–2030 ($MILLION)
TABLE 86.INDIA TAX MANAGEMENT MARKET REVENUE, BY COMPONENT, 2020–2030 ($MILLION)
TABLE 87.INDIA TAX MANAGEMENT MARKET REVENUE, BY TAX TYPE, 2020–2030 ($MILLION)
TABLE 88.INDIA TAX MANAGEMENT MARKET REVENUE, BY DEPLOYMENT MODE, 2020–2030 ($MILLION)
TABLE 89.INDIA TAX MANAGEMENT MARKET REVENUE, BY ORGANIZATION SIZE, 2020–2030 ($MILLION)
TABLE 90.INDIA TAX MANAGEMENT MARKET REVENUE, BY INDUSTRY VERTICAL, 2020–2030 ($MILLION)
TABLE 91.JAPAN TAX MANAGEMENT MARKET REVENUE, BY COMPONENT, 2020–2030 ($MILLION)
TABLE 92.JAPAN TAX MANAGEMENT MARKET REVENUE, BY TAX TYPE, 2020–2030 ($MILLION)
TABLE 93.JAPAN TAX MANAGEMENT MARKET REVENUE, BY DEPLOYMENT MODE, 2020–2030 ($MILLION)
TABLE 94.JAPAN TAX MANAGEMENT MARKET REVENUE, BY ORGANIZATION SIZE, 2020–2030 ($MILLION)
TABLE 95.JAPAN TAX MANAGEMENT MARKET REVENUE, BY INDUSTRY VERTICAL, 2020–2030 ($MILLION)
TABLE 96.SOUTH KOREA TAX MANAGEMENT MARKET REVENUE, BY COMPONENT, 2020–2030 ($MILLION)
TABLE 97.SOUTH KOREA TAX MANAGEMENT MARKET REVENUE, BY TAX TYPE, 2020–2030 ($MILLION)
TABLE 98.SOUTH KOREA TAX MANAGEMENT MARKET REVENUE, BY DEPLOYMENT MODE, 2020–2030 ($MILLION)
TABLE 99.SOUTH KOREA TAX MANAGEMENT MARKET REVENUE, BY ORGANIZATION SIZE, 2020–2030 ($MILLION)
TABLE 100.SOUTH KOREA TAX MANAGEMENT MARKET REVENUE, BY INDUSTRY VERTICAL, 2020–2030 ($MILLION)
TABLE 101.AUSTRALIA TAX MANAGEMENT MARKET REVENUE, BY COMPONENT, 2020–2030 ($MILLION)
TABLE 102.AUSTRALIA TAX MANAGEMENT MARKET REVENUE, BY TAX TYPE, 2020–2030 ($MILLION)
TABLE 103.AUSTRALIA TAX MANAGEMENT MARKET REVENUE, BY DEPLOYMENT MODE, 2020–2030 ($MILLION)
TABLE 104.AUSTRALIA TAX MANAGEMENT MARKET REVENUE, BY ORGANIZATION SIZE, 2020–2030 ($MILLION)
TABLE 105.AUSTRALIA TAX MANAGEMENT MARKET REVENUE, BY INDUSTRY VERTICAL, 2020–2030 ($MILLION)
TABLE 106.REST OF ASIA-PACIFIC TAX MANAGEMENT MARKET REVENUE, BY COMPONENT, 2020–2030 ($MILLION)
TABLE 107.REST OF ASIA-PACIFIC TAX MANAGEMENT MARKET REVENUE, BY TAX TYPE, 2020–2030 ($MILLION)
TABLE 108.REST OF ASIA-PACIFIC TAX MANAGEMENT MARKET REVENUE, BY DEPLOYMENT MODE, 2020–2030 ($MILLION)
TABLE 109.REST OF ASIA-PACIFIC TAX MANAGEMENT MARKET REVENUE, BY ORGANIZATION SIZE, 2020–2030 ($MILLION)
TABLE 110.REST OF ASIA-PACIFIC TAX MANAGEMENT MARKET REVENUE, BY INDUSTRY VERTICAL, 2020–2030 ($MILLION)
TABLE 111.LAMEA TAX MANAGEMENT MARKET REVENUE, BY COMPONENT, 2020–2030 ($MILLION)
TABLE 112.LAMEA TAX MANAGEMENT MARKET REVENUE, BY TAX TYPE, 2020–2030 ($MILLION)
TABLE 113.LAMEA TAX MANAGEMENT MARKET REVENUE, BY DEPLOYMENT MODE, 2020–2030 ($MILLION)
TABLE 114.LAMEA TAX MANAGEMENT MARKET REVENUE, BY ORGANIZATION SIZE, 2020–2030 ($MILLION)
TABLE 115.LAMEA TAX MANAGEMENT MARKET REVENUE, BY INDUSTRY VERTICAL, 2020–2030 ($MILLION)
TABLE 116.LAMEA TAX MANAGEMENT MARKET REVENUE, BY COUNTRY, 2020–2030 ($MILLION)
TABLE 117.LATIN AMERICA TAX MANAGEMENT MARKET REVENUE, BY COMPONENT, 2020–2030 ($MILLION)
TABLE 118.LATIN AMERICA TAX MANAGEMENT MARKET REVENUE, BY TAX TYPE, 2020–2030 ($MILLION)
TABLE 119.LATIN AMERICA TAX MANAGEMENT MARKET REVENUE, BY DEPLOYMENT MODE, 2020–2030 ($MILLION)
TABLE 120.LATIN AMERICA TAX MANAGEMENT MARKET REVENUE, BY ORGANIZATION SIZE, 2020–2030 ($MILLION)
TABLE 121.LATIN AMERICA TAX MANAGEMENT MARKET REVENUE, BY INDUSTRY VERTICAL, 2020–2030 ($MILLION)
TABLE 122.MIDDLE EAST TAX MANAGEMENT MARKET REVENUE, BY COMPONENT, 2020–2030 ($MILLION)
TABLE 123.MIDDLE EAST TAX MANAGEMENT MARKET REVENUE, BY TAX TYPE, 2020–2030 ($MILLION)
TABLE 124.MIDDLE EAST TAX MANAGEMENT MARKET REVENUE, BY DEPLOYMENT MODE, 2020–2030 ($MILLION)
TABLE 125.MIDDLE EAST TAX MANAGEMENT MARKET REVENUE, BY ORGANIZATION SIZE, 2020–2030 ($MILLION)
TABLE 126.MIDDLE EAST TAX MANAGEMENT MARKET REVENUE, BY INDUSTRY VERTICAL, 2020–2030 ($MILLION)
TABLE 127.AFRICA TAX MANAGEMENT MARKET REVENUE, BY COMPONENT, 2020–2030 ($MILLION)
TABLE 128.AFRICA TAX MANAGEMENT MARKET REVENUE, BY TAX TYPE, 2020–2030 ($MILLION)
TABLE 129.AFRICA TAX MANAGEMENT MARKET REVENUE, BY DEPLOYMENT MODE, 2020–2030 ($MILLION)
TABLE 130.AFRICA TAX MANAGEMENT MARKET REVENUE, BY ORGANIZATION SIZE, 2020–2030 ($MILLION)
TABLE 131.AFRICA TAX MANAGEMENT MARKET REVENUE, BY INDUSTRY VERTICAL, 2020–2030 ($MILLION)
TABLE 132.AVALARA INC.: KEY EXECUTIVES
TABLE 133.AVALARA INC.: COMPANY SNAPSHOT
TABLE 134.AVALARA INC.: PRODUCT PORTFOLIO
TABLE 135.BLUCORA, INC.: KEY EXECUTIVE
TABLE 136.BLUCORA, INC.: COMPANY SNAPSHOT
TABLE 137.BLUCORA, INC.: OPERATING SEGMENTS
TABLE 138.BLUCORA, INC.: PRODUCT PORTFOLIO
TABLE 139.H&R BLOCK, INC..: KEY EXECUTIVES
TABLE 140.H&R BLOCK, INC..: COMPANY SNAPSHOT
TABLE 142.H&R BLOCK, INC.: PRODUCT PORTFOLIO
TABLE 143.INTUIT INC.: KEY EXECUTIVE
TABLE 144.INTUIT INC.: COMPANY SNAPSHOT
TABLE 146.INTUIT INC.: PRODUCT PORTFOLIO
TABLE 147.SAP SE: KEY EXECUTIVE
TABLE 148.SAP SE: COMPANY SNAPSHOT
TABLE 149.SAP SE: OPERATING SEGMENTS
TABLE 150.SAP SE: PRODUCT PORTFOLIO
TABLE 151.SOVOS COMPLIANCE, LLC.: KEY EXECUTIVES
TABLE 152.SOVOS COMPLIANCE, LLC.: COMPANY SNAPSHOT
TABLE 153.SOVOS COMPLIANCE, LLC.: PRODUCT PORTFOLIO
TABLE 154.TAXJAR (STRIPE): KEY EXECUTIVES
TABLE 155.TAXJAR (STRIPE): COMPANY SNAPSHOT
TABLE 156.TAXJAR (STRIPE): PRODUCT PORTFOLIO
TABLE 157.TAXSLAYER: KEY EXECUTIVE
TABLE 158.TAXSLAYER: COMPANY SNAPSHOT
TABLE 159.TAXSLAYER: PRODUCT PORTFOLIO
TABLE 160.THOMSON REUTERS: KEY EXECUTIVES
TABLE 161.THOMSON REUTERS: COMPANY SNAPSHOT
TABLE 162.THOMSON REUTERS: OPERATING SEGMENTS
TABLE 163.THOMSON REUTERS: PRODUCT PORTFOLIO
TABLE 164.WOLTERS KLUWER N.V.: KEY EXECUTIVES
TABLE 165.WOLTERS KLUWER N.V.: COMPANY SNAPSHOT
TABLE 166.WOLTERS KLUWER N.V: OPERATING SEGMENTS
TABLE 167.WOLTERS KLUWER N.V.: PRODUCT PORTFOLIO
LIST OF FIGURES
FIGURE 01.KEY MARKET SEGMENTS
FIGURE 02.TAX MANAGEMENT MARKET, 2020–2030
FIGURE 03.TAX MANAGEMENT MARKET, 2020–2030
FIGURE 04.TOP IMPACTING FACTORS
FIGURE 05.TOP INVESTMENT POCKETS
FIGURE 06.MODERATE BARGAINING POWER OF SUPPLIERS
FIGURE 07.MODERATE-TO-HIGH BARGAINING POWER OF BUYERS
FIGURE 08.LOW-TO-MODERATE THREAT OF SUBSTITUTES
FIGURE 09.MODERATE-TO-HIGH THREAT OF NEW ENTRANTS
FIGURE 10.HIGH COMPETITIVE RIVALRY
FIGURE 11.MARKET DYNAMICS
FIGURE 12.GLOBAL TAX MANAGEMENT MARKET REVENUE, BY COMPONENT, 2020–2030($MILLION)
FIGURE 13.COMPARATIVE SHARE ANALYSIS OF TAX MANAGEMENT MARKET FOR SOFTWARE, BY COUNTRY, 2020 & 2030(%)
FIGURE 14.COMPARATIVE SHARE ANALYSIS OF TAX MANAGEMENT MARKET FOR SERVICES, BY COUNTRY, 2020 & 2030(%)
FIGURE 15.GLOBAL TAX MANAGEMENT MARKET REVENUE, BY TAX TYPE, 2020–2030 ($MILLION)
FIGURE 16.COMPARATIVE SHARE ANALYSIS OF INDIRECT TAX MANAGEMENT MARKET, BY COUNTRY, 2020 & 2030 (%)
FIGURE 17.COMPARATIVE SHARE ANALYSIS OF DIRECT TAX MANAGEMENT MARKET, BY COUNTRY, 2020 & 2030 (%)
FIGURE 18.GLOBAL TAX MANAGEMENT MARKET REVENUE, BY DEPLOYMENT MODEL, 2020–2030 ($MILLION)
FIGURE 19.COMPARATIVE SHARE ANALYSIS OF TAX MANAGEMENT MARKET FOR ON-PREMISE BY COUNTRY, 2020 & 2030 (%)
FIGURE 20.COMPARATIVE SHARE ANALYSIS OF TAX MANAGEMENT MARKET FOR CLOUD DEPLOYMENT, BY COUNTRY, 2020 & 2030 (%)
FIGURE 21.GLOBAL TAX MANAGEMENT MARKET REVENUE, BY ORGANIZATION SIZE, 2020–2030 ($MILLION)
FIGURE 22.COMPARATIVE SHARE ANALYSIS OF TAX MANAGEMENT MARKET FOR SMALL AND MEDIUM SIZED ENTERPRISES, BY COUNTRY, 2020 & 2030 (%)
FIGURE 23.COMPARATIVE SHARE ANALYSIS OF TAX MANAGEMENT MARKET FOR LARGE ENTERPRISES, BY COUNTRY, 2020 & 2030 (%)
FIGURE 24.GLOBAL TAX MANAGEMENT MARKET REVENUE, BY INDUSTRY VERTICAL, 2020–2030 ($MILLION)
FIGURE 25.COMPARATIVE SHARE ANALYSIS OF TAX MANAGEMENT MARKET FOR MANUFACTURING, BY COUNTRY, 2020 & 2030(%)
FIGURE 26.COMPARATIVE SHARE ANALYSIS OF TAX MANAGEMENT MARKET FOR BFSI, BY COUNTRY, 2020 & 2030(%)
FIGURE 27.COMPARATIVE SHARE ANALYSIS OF TAX MANAGEMENT MARKET FOR HEALTHCARE AND LIFE SCIENCE, BY COUNTRY, 2020 & 2030(%)
FIGURE 28.COMPARATIVE SHARE ANALYSIS OF TAX MANAGEMENT MARKET FOR RETAIL AND E-COMMERCE, BY COUNTRY, 2020 & 2030(%)
FIGURE 29.COMPARATIVE SHARE ANALYSIS OF TAX MANAGEMENT MARKET FOR ENERGY AND UTILITY, BY COUNTRY, 2020 & 2030(%)
FIGURE 30.COMPARATIVE SHARE ANALYSIS OF TAX MANAGEMENT MARKET FOR MEDIA AND ENTERTAINMENT, BY COUNTRY, 2020 & 2030(%)
FIGURE 31.COMPARATIVE SHARE ANALYSIS OF TAX MANAGEMENT MARKET FOR IT AND TELECOM, BY COUNTRY, 2020 & 2030(%)
FIGURE 32.COMPARATIVE SHARE ANALYSIS OF TAX MANAGEMENT MARKET FOR OTHERS, BY COUNTRY, 2020 & 2030(%)
FIGURE 33.U.S. TAX MANAGEMENT MARKET REVENUE, 2020–2030 ($MILLION)
FIGURE 34.CANADA TAX MANAGEMENT MARKET REVENUE, 2020–2030 ($MILLION)
FIGURE 35.UK TAX MANAGEMENT MARKET REVENUE, 2020–2030 ($MILLION)
FIGURE 36.GERMANY TAX MANAGEMENT MARKET REVENUE, 2020–2030 ($MILLION)
FIGURE 37.FRANCE TAX MANAGEMENT MARKET REVENUE, 2020–2030 ($MILLION)
FIGURE 38.SPAIN TAX MANAGEMENT MARKET REVENUE, 2020–2030 ($MILLION)
FIGURE 39.ITALY TAX MANAGEMENT MARKET REVENUE, 2020–2030 ($MILLION)
FIGURE 40.REST OF EUROPE TAX MANAGEMENT MARKET REVENUE, 2020–2030 ($MILLION)
FIGURE 41.CHINA TAX MANAGEMENT MARKET REVENUE, 2020–2030 ($MILLION)
FIGURE 42.INDIA TAX MANAGEMENT MARKET REVENUE, 2020–2030 ($MILLION)
FIGURE 43.JAPAN TAX MANAGEMENT MARKET REVENUE, 2020–2030 ($MILLION)
FIGURE 44.SOUTH KOREA TAX MANAGEMENT MARKET REVENUE, 2020–2030 ($MILLION)
FIGURE 45.AUSTRALIA TAX MANAGEMENT MARKET REVENUE, 2020–2030 ($MILLION)
FIGURE 46.REST OF ASIA-PACIFIC TAX MANAGEMENT MARKET REVENUE, 2020–2030 ($MILLION)
FIGURE 47.LATIN AMERICA TAX MANAGEMENT MARKET REVENUE, 2020–2030 ($MILLION)
FIGURE 48.MIDDLE EAST TAX MANAGEMENT MARKET REVENUE, 2020–2030 ($MILLION)
FIGURE 49.AFRICA TAX MANAGEMENT MARKET REVENUE, 2020–2030 ($MILLION)
FIGURE 50.KEY PLAYER POSITIONING ANALYSIS: GLOBAL TAX MANAGEMENT MARKET
FIGURE 51.TOP WINNING STRATEGIES, BY YEAR, 2018-2021
FIGURE 52.TOP WINNING STRATEGIES, BY DEVELOPMENT, 2018-2021
FIGURE 53.TOP WINNING STRATEGIES, BY COMPANY, 2018-2021
FIGURE 54.COMPETITIVE DASHBOARD
FIGURE 55.COMPETITIVE DASHBOARD
FIGURE 56.COMPETITIVE HEATMAP OF KEY PLAYERS
FIGURE 57.R&D EXPENDITURE, 2018–2020 ($MILLION)
FIGURE 58.AVALARA INC.: REVENUE, 2018–2020 ($MILLION)
FIGURE 59.BLUCORA, INC.: REVENUE, 2018–2020 ($MILLION)
FIGURE 60.BLUCORA, INC.: REVENUE SHARE BY SEGMENT, 2020 (%)
FIGURE 61.H&R BLOCK, INC.: REVENUE, 2018–2020 ($MILLION)
FIGURE 62.H&R BLOCK, INC.: REVENUE SHARE, BY SEGMENT, 2020 (%)
FIGURE 63.R&D EXPENDITURE, 2018–2020 ($MILLION)
FIGURE 64.INTUIT INC.: REVENUE, 2018-2020 ($MILLION)
FIGURE 65.INTUIT INC.: REVENUE SHARE, BY SEGMENT, 2020 (%)
FIGURE 66.R&D EXPENDITURE, 2018–2020 ($MILLION)
FIGURE 67.SAP SE: REVENUE, 2018–2020 ($MILLION)
FIGURE 68.SAP SE: REVENUE SHARE BY SEGMENT, 2020 (%)
FIGURE 69.SAP SE: REVENUE SHARE BY REGION, 2020 (%)
FIGURE 70.THOMSON REUTERS: REVENUE, 2018–2020 ($MILLION)
FIGURE 71.THOMSON REUTERS: REVENUE SHARE, BY SEGMENT, 2020 (%)
FIGURE 72.THOMSON REUTERS: REVENUE SHARE, BY REGION, 2020 (%)
FIGURE 73.WOLTERS KLUWER N.V.: REVENUE, 2018-2020 ($MILLION)
FIGURE 74.WOLTERS KLUWER N.V.: REVENUE SHARE BY SEGMENT, 2020 (%)
FIGURE 75.WOLTERS KLUWER N.V.: REVENUE SHARE BY REGION, 2020 (%)
According to CXO, tax management software is increasingly being implemented by businesses to boost their profitability and working capital. Enterprises must integrate their business functions, resources, and important business processes to the tax management software for monitoring probability to boost efficiency and productivity. The use of tax management software enable businesses to integrate their operations with sophisticated financial management services. However, the selection of an ideal tax management software varies depending on the company outfit and procedure. Further, cloud-based tax management (SaaS model) is gaining popularity over traditional on-premise tax management, which can provide the lucrative opportunities in the future. It has gained widespread popularity among the end users owing to numerous advantages connected with cloud-based technology. Tax management application is anticipated to witness increased adoption and usage in the future, as it allows the organization to improve its performance and productivity.
Furthermore, increase in use of technology and major shift toward digital transitions have altered the consumer technology environment. Mobile usage has exceeded desktop usage, and this trend will only increase in the future. Also the emerging economy such as India and Japan implementing new tax method such as goods and service tax which eliminate other hidden taxes such as tax on purchases, sales tax, octroy tax, and excise duty to simplify tax management is anticipated to increase the demand for tax management system.
Nevertheless, prominent market players are exploring new technologies and applications to meet the increasing customer demands. Ongoing product launches, collaborations, and acquisitions are expected to enable them to expand their product portfolios and expand their presence in different regions.
Start reading instantly.
This Report and over 66,804+ more Reports, Available with Avenue Library. T&C*.
Enterprise
License/PDF
Library
Membership
*Taxes/Fees, if applicable will be added during checkout. All prices in USD
To ensure high-level data integrity, accurate analysis, and impeccable forecasts
For complete satisfaction
On-demand customization of scope of the report to exactly meet your needs
Targeted market view to provide pertinent information and save time of readers
Get insights on topics that are crucial for your business. Stay abreast of your interest areas.
Get Industry Data AlertsTo ensure high-level data integrity, accurate analysis, and impeccable forecasts
For complete satisfaction
On-demand customization of scope of the report to exactly meet your needs
Targeted market view to provide pertinent information and save time of readers