0
2022
Transdermal Drug Delivery Systems Market

Transdermal Drug Delivery Systems Market

by Type Of Delivery System (Passive, Active), by Application (Analgesics, Hormone Replacement Therapies, Hypertension, Motion Sickness, Smoking Cessation, Others): Global Opportunity Analysis and Industry Forecast, 2020-2030

✷  Report Code: A00385
Mar 2022 | Pages: 175
Tables: 120
Charts: 56
  • Formats*:

  • pdf

    Single User License, Five User
    License & Enterprise User License

  • xls

    Data Pack Excel License

  • ppt

    It comes with the additional cost
    of $2500.00 contact sales.


Transdermal Drug Delivery Systems Market Statistics, 2030

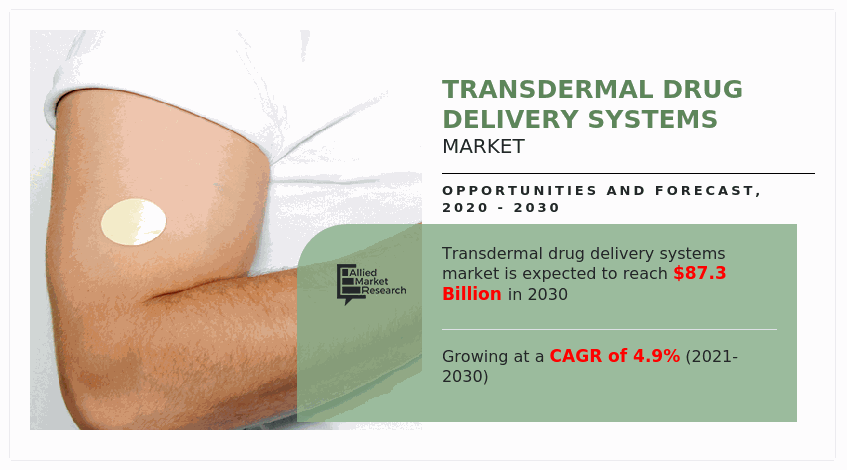
The global transdermal drug delivery systems market size was $52,476.50 million in 2020, and is projected to reach $87,322.40 million by 2030, growing at a CAGR of 4.9% from 2021 to 2030. Transdermal drug delivery systems are an alternative to oral intravascular, subcutaneous, and transmucosal routes, wherein the drugs are delivered through the skin for therapeutic use. Transdermal drug delivery systems offer a painless method of systematic drug delivery by application of drug onto an intact and healthy skin.
The transdermal drug delivery systems market has been negatively impacted by COVID-19, due to lockdown in several countries globally.

The rise in global population has significantly increased the demand for geriatric medicines. Transdermal drug delivery systems help deliver drugs in a controlled manner, thereby increasing the effectiveness of geriatric medicines. Furthermore, the number of patients suffering from chronic diseases, such as heart diseases, diabetes, and arthritis has significantly increased in the past few decades. Such chronic diseases are a leading cause of disability and deaths globally. These factors have increased R&D activities that are aimed to enhance the effectiveness of medicines. In addition, awareness amongst patients, regarding the use of various medicines has also increased. These factors have positively influenced the transdermal drug delivery systems market growth.

According to Department of Economic and Social Affairs, United Nations, the total number of people aged 60 years and above was 962 million in 2017, which is more than twice as large as it was in 1980 when there were around 382 million globally. Furthermore, the number of older persons is expected to double again by 2050, nearly reaching 2.1 billion. This s expected to propel the demand for geriatric diseases, thereby positively influencing the transdermal drug delivery systems market. According to Centers for Disease Control and Prevention, an entity of the U.S. Department of Health & Human Services, 6 in every 10 American adults have a chronic disease and 4 in every 10 American adults have two or more chronic diseases. This has significantly increased the spending on healthcare services. According to the U.S. Centers for Medicare & Medicaid Services, the U.S. healthcare spending reached $4.1 trillion or $12,530 per person, witnessing a rise of 9.7%, and accounting for 19.7% of GDP in the U.S. in 2020.
Transdermal Drug Delivery Systems Market

The novel coronavirus (COVID-19) has rapidly spread across various countries and regions, causing an enormous impact on the lives of people and the overall community. It began as a human health condition and has now become a significant threat to global trade, economy, and finance. The COVID-19 pandemic increased the importance of government healthcare facilities, thereby increasing healthcare spendings across the globe. Furthermore, the number of COVID-19 cases are expected to reduce in the near future as the vaccine for COVID-19 is introduced in the market. This has led to the reopening of transdermal drug delivery system research facilities at full-scale capacities. This is expected to help the market to recover by the start of 2022. After COVID-19 infection cases begin to decline, companies involved in manufacturing of transdermal drug delivery systems must focus on protecting their staff, operations, and supply networks to respond to urgent emergencies and establish new methods of working.

Furthermore, transdermal drug delivery systems offer additional advantages, such as maintaining an adequate concentration of drug in the blood for an extended period of time. It can be discontinued easily by peeling off the patch. In addition, transdermal drug delivery systems can be easily used in infants, elderly people, and patients suffering from dysphagia. Also, advancements in technology have enabled application of transdermal drug delivery systems for a wide range of medications.
Transdermal Drug Delivery Systems Market

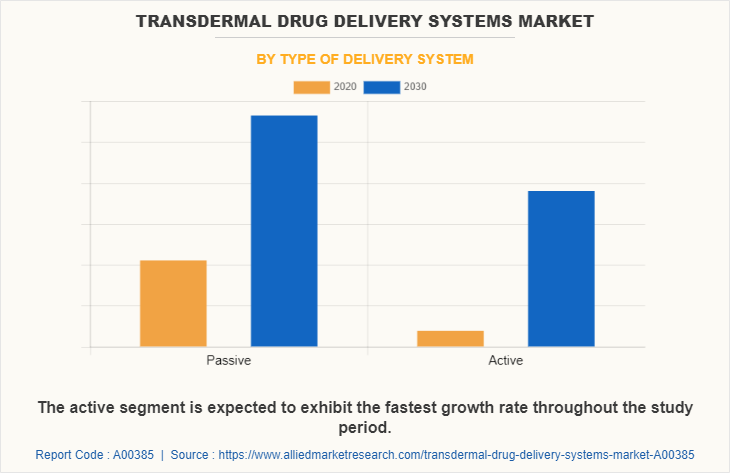
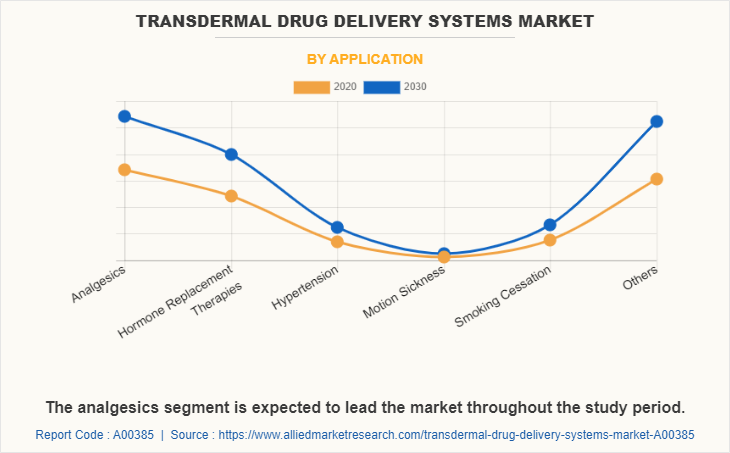
The transdermal drug delivery systems market is segmented on the basis of type of delivery, application, and region. By type of delivery, the market is categorized into passive, active, and others. On the basis of application, it is categorized into analgesics, hormone replacement therapy, hypertension, motion sickness, smoking cessation and others. Region-wise, the market is analyzed across North America, Europe, Asia-Pacific, and LAMEA. North America held the largest transdermal drug delivery systems market share in 2020, and is anticipated to maintain this trend throughout the forecast period. This is attributed to increase in population and rise in spending of healthcare facilities.

Transdermal Drug Delivery Systems Market
By Region

2030
North America 
Europe
Asia-Pacific
LAMEA

North America holds the dominat position throughout the study period.

Get more information on this report : Request Sample Pages

Key Benefits for Stakeholders

  • The report provides an extensive analysis of the current and emerging transdermal drug delivery systems market trends and dynamics. 
  • In-depth transdermal drug delivery systems market analysis is conducted by constructing market estimations for key market segments between 2021 and 2030.
  • Extensive analysis of the transdermal drug delivery systems market size is conducted by following key product positioning and monitoring of top competitors within the market framework.
  • A comprehensive analysis of all the regions is provided to determine the prevailing transdermal drug delivery systems market opportunities.
  • The global transdermal drug delivery systems market forecast analysis from 2021 to 2030 is included in the report.
  • The key players within transdermal drug delivery systems market are profiled in this report and their strategies are analyzed thoroughly, which help understand the competitive outlook of the transdermal drug delivery systems industry.

Transdermal Drug Delivery Systems Market Report Highlights

Aspects Details
By Type
  • Passive
  • Active
By APPLICATION
  • Analgesics
  • Hormone Replacement Therapies
  • Hypertension
  • Motion Sickness
  • Smoking Cessation
  • Others
By Region
  • Asia-Pacific  (Japan, China, India, Australia, South Korea, Rest of Asia-Pacific)
  • LAMEA  (Brazil, Saudi Arabia, South Africa, Rest of LAMEA)
  • North America  (U.S, Canada, Mexico)
  • Europe  (Germany, France, UK, Italy, Spain, Rest of Europe)
Key Market Players Bayer AG, Hisamitsu Pharmaceutical Co. Inc., Endo International plc, Purdue Pharma L.P., Altaris, Boehringer Ingelheim GmbH, Novartis AG, Viatris Inc., GlaxoSmithKline plc, Johnson & Johnson
 
  • CHAPTER 1:INTRODUCTION

    • 1.1.Report description

    • 1.2.Key market segments

    • 1.3.Key benefits to the stakeholders

    • 1.4.Research Methodology

      • 1.4.1.Secondary research

      • 1.4.2.Primary research

      • 1.4.3.Analyst tools and models

  • CHAPTER 2:EXECUTIVE SUMMARY

    • 2.1.Key findings of the study

    • 2.2.CXO Perspective

  • CHAPTER 3:MARKET OVERVIEW

    • 3.1.Market definition and scope

    • 3.2.Key findings

      • 3.2.1.Top investment pockets

    • 3.3.Porter’s five forces analysis

    • 3.4.Top player positioning

    • 3.5.Market dynamics

      • 3.5.1.Drivers

      • 3.5.2.Restraints

      • 3.5.3.Opportunities

    • 3.6.COVID-19 Impact Analysis on the market

  • CHAPTER 4: TRANSDERMAL DRUG DELIVERY SYSTEMS MARKET, BY TYPE OF DELIVERY SYSTEM

    • 4.1 Overview

      • 4.1.1 Market size and forecast

    • 4.2 Passive

      • 4.2.1 Key market trends, growth factors and opportunities

      • 4.2.2 Market size and forecast, by region

      • 4.2.3 Market analysis by country

    • 4.3 Active

      • 4.3.1 Key market trends, growth factors and opportunities

      • 4.3.2 Market size and forecast, by region

      • 4.3.3 Market analysis by country

  • CHAPTER 5: TRANSDERMAL DRUG DELIVERY SYSTEMS MARKET, BY APPLICATION

    • 5.1 Overview

      • 5.1.1 Market size and forecast

    • 5.2 Analgesics

      • 5.2.1 Key market trends, growth factors and opportunities

      • 5.2.2 Market size and forecast, by region

      • 5.2.3 Market analysis by country

    • 5.3 Hormone Replacement Therapies

      • 5.3.1 Key market trends, growth factors and opportunities

      • 5.3.2 Market size and forecast, by region

      • 5.3.3 Market analysis by country

    • 5.4 Hypertension

      • 5.4.1 Key market trends, growth factors and opportunities

      • 5.4.2 Market size and forecast, by region

      • 5.4.3 Market analysis by country

    • 5.5 Motion Sickness

      • 5.5.1 Key market trends, growth factors and opportunities

      • 5.5.2 Market size and forecast, by region

      • 5.5.3 Market analysis by country

    • 5.6 Smoking Cessation

      • 5.6.1 Key market trends, growth factors and opportunities

      • 5.6.2 Market size and forecast, by region

      • 5.6.3 Market analysis by country

    • 5.7 Others

      • 5.7.1 Key market trends, growth factors and opportunities

      • 5.7.2 Market size and forecast, by region

      • 5.7.3 Market analysis by country

  • CHAPTER 6: TRANSDERMAL DRUG DELIVERY SYSTEMS MARKET, BY REGION

    • 6.1 Overview

      • 6.1.1 Market size and forecast

    • 6.2 Asia-Pacific

      • 6.2.1 Key trends and opportunities

      • 6.2.2 Asia-Pacific Market size and forecast, by Type Of Delivery System

      • 6.2.3 Asia-Pacific Market size and forecast, by Application

      • 6.2.4 Asia-Pacific Market size and forecast, by country

        • 6.2.4.1 Japan
          • 6.2.4.1.1 Market size and forecast, by Type Of Delivery System
          • 6.2.4.1.2 Market size and forecast, by Application
        • 6.2.4.2 China
          • 6.2.4.2.1 Market size and forecast, by Type Of Delivery System
          • 6.2.4.2.2 Market size and forecast, by Application
        • 6.2.4.3 India
          • 6.2.4.3.1 Market size and forecast, by Type Of Delivery System
          • 6.2.4.3.2 Market size and forecast, by Application
        • 6.2.4.4 Australia
          • 6.2.4.4.1 Market size and forecast, by Type Of Delivery System
          • 6.2.4.4.2 Market size and forecast, by Application
        • 6.2.4.5 South Korea
          • 6.2.4.5.1 Market size and forecast, by Type Of Delivery System
          • 6.2.4.5.2 Market size and forecast, by Application
        • 6.2.4.6 Rest of Asia-Pacific
          • 6.2.4.6.1 Market size and forecast, by Type Of Delivery System
          • 6.2.4.6.2 Market size and forecast, by Application
    • 6.3 LAMEA

      • 6.3.1 Key trends and opportunities

      • 6.3.2 LAMEA Market size and forecast, by Type Of Delivery System

      • 6.3.3 LAMEA Market size and forecast, by Application

      • 6.3.4 LAMEA Market size and forecast, by country

        • 6.3.4.1 Brazil
          • 6.3.4.1.1 Market size and forecast, by Type Of Delivery System
          • 6.3.4.1.2 Market size and forecast, by Application
        • 6.3.4.2 Saudi Arabia
          • 6.3.4.2.1 Market size and forecast, by Type Of Delivery System
          • 6.3.4.2.2 Market size and forecast, by Application
        • 6.3.4.3 South Africa
          • 6.3.4.3.1 Market size and forecast, by Type Of Delivery System
          • 6.3.4.3.2 Market size and forecast, by Application
        • 6.3.4.4 Rest of LAMEA
          • 6.3.4.4.1 Market size and forecast, by Type Of Delivery System
          • 6.3.4.4.2 Market size and forecast, by Application
    • 6.4 North America

      • 6.4.1 Key trends and opportunities

      • 6.4.2 North America Market size and forecast, by Type Of Delivery System

      • 6.4.3 North America Market size and forecast, by Application

      • 6.4.4 North America Market size and forecast, by country

        • 6.4.4.1 U.S.
          • 6.4.4.1.1 Market size and forecast, by Type Of Delivery System
          • 6.4.4.1.2 Market size and forecast, by Application
        • 6.4.4.2 Canada
          • 6.4.4.2.1 Market size and forecast, by Type Of Delivery System
          • 6.4.4.2.2 Market size and forecast, by Application
        • 6.4.4.3 Mexico
          • 6.4.4.3.1 Market size and forecast, by Type Of Delivery System
          • 6.4.4.3.2 Market size and forecast, by Application
    • 6.5 Europe

      • 6.5.1 Key trends and opportunities

      • 6.5.2 Europe Market size and forecast, by Type Of Delivery System

      • 6.5.3 Europe Market size and forecast, by Application

      • 6.5.4 Europe Market size and forecast, by country

        • 6.5.4.1 Germany
          • 6.5.4.1.1 Market size and forecast, by Type Of Delivery System
          • 6.5.4.1.2 Market size and forecast, by Application
        • 6.5.4.2 France
          • 6.5.4.2.1 Market size and forecast, by Type Of Delivery System
          • 6.5.4.2.2 Market size and forecast, by Application
        • 6.5.4.3 U.K.
          • 6.5.4.3.1 Market size and forecast, by Type Of Delivery System
          • 6.5.4.3.2 Market size and forecast, by Application
        • 6.5.4.4 Italy
          • 6.5.4.4.1 Market size and forecast, by Type Of Delivery System
          • 6.5.4.4.2 Market size and forecast, by Application
        • 6.5.4.5 Spain
          • 6.5.4.5.1 Market size and forecast, by Type Of Delivery System
          • 6.5.4.5.2 Market size and forecast, by Application
        • 6.5.4.6 Rest of Europe
          • 6.5.4.6.1 Market size and forecast, by Type Of Delivery System
          • 6.5.4.6.2 Market size and forecast, by Application
  • CHAPTER 7: COMPANY LANDSCAPE

    • 7.1. Introduction

    • 7.2. Top winning strategies

    • 7.3. Product Mapping of Top 10 Player

    • 7.4. Competitive Dashboard

    • 7.5. Competitive Heatmap

    • 7.6. Key developments

  • CHAPTER 8: COMPANY PROFILES

    • 8.1 Viatris Inc.

      • 8.1.1 Company overview

      • 8.1.2 Company snapshot

      • 8.1.3 Operating business segments

      • 8.1.4 Product portfolio

      • 8.1.5 Business performance

      • 8.1.6 Key strategic moves and developments

    • 8.2 Bayer AG

      • 8.2.1 Company overview

      • 8.2.2 Company snapshot

      • 8.2.3 Operating business segments

      • 8.2.4 Product portfolio

      • 8.2.5 Business performance

      • 8.2.6 Key strategic moves and developments

    • 8.3 Boehringer Ingelheim GmbH

      • 8.3.1 Company overview

      • 8.3.2 Company snapshot

      • 8.3.3 Operating business segments

      • 8.3.4 Product portfolio

      • 8.3.5 Business performance

      • 8.3.6 Key strategic moves and developments

    • 8.4 Endo International plc

      • 8.4.1 Company overview

      • 8.4.2 Company snapshot

      • 8.4.3 Operating business segments

      • 8.4.4 Product portfolio

      • 8.4.5 Business performance

      • 8.4.6 Key strategic moves and developments

    • 8.5 GlaxoSmithKline plc

      • 8.5.1 Company overview

      • 8.5.2 Company snapshot

      • 8.5.3 Operating business segments

      • 8.5.4 Product portfolio

      • 8.5.5 Business performance

      • 8.5.6 Key strategic moves and developments

    • 8.6 Johnson & Johnson

      • 8.6.1 Company overview

      • 8.6.2 Company snapshot

      • 8.6.3 Operating business segments

      • 8.6.4 Product portfolio

      • 8.6.5 Business performance

      • 8.6.6 Key strategic moves and developments

    • 8.7 Novartis AG

      • 8.7.1 Company overview

      • 8.7.2 Company snapshot

      • 8.7.3 Operating business segments

      • 8.7.4 Product portfolio

      • 8.7.5 Business performance

      • 8.7.6 Key strategic moves and developments

    • 8.8 Purdue Pharma L.P.

      • 8.8.1 Company overview

      • 8.8.2 Company snapshot

      • 8.8.3 Operating business segments

      • 8.8.4 Product portfolio

      • 8.8.5 Business performance

      • 8.8.6 Key strategic moves and developments

    • 8.9 Altaris

      • 8.9.1 Company overview

      • 8.9.2 Company snapshot

      • 8.9.3 Operating business segments

      • 8.9.4 Product portfolio

      • 8.9.5 Business performance

      • 8.9.6 Key strategic moves and developments

    • 8.10 Hisamitsu Pharmaceutical Co. Inc.

      • 8.10.1 Company overview

      • 8.10.2 Company snapshot

      • 8.10.3 Operating business segments

      • 8.10.4 Product portfolio

      • 8.10.5 Business performance

      • 8.10.6 Key strategic moves and developments

  • LIST OF TABLES

  • TABLE 1. GLOBAL TRANSDERMAL DRUG DELIVERY SYSTEMS MARKET, BY TYPE OF DELIVERY SYSTEM, 2020-2030,($MILLION)
    TABLE 2. TRANSDERMAL DRUG DELIVERY SYSTEMS MARKET REVENUE, FOR PASSIVE, BY REGION , 2020-2030,($MILLION)
    TABLE 3. TRANSDERMAL DRUG DELIVERY SYSTEMS MARKET PASSIVE BY COUNTRY, 2020-2030,($MILLION)
    TABLE 4. TRANSDERMAL DRUG DELIVERY SYSTEMS MARKET REVENUE, FOR ACTIVE, BY REGION , 2020-2030,($MILLION)
    TABLE 5. TRANSDERMAL DRUG DELIVERY SYSTEMS MARKET ACTIVE BY COUNTRY, 2020-2030,($MILLION)
    TABLE 6. GLOBAL TRANSDERMAL DRUG DELIVERY SYSTEMS MARKET, BY APPLICATION, 2020-2030,($MILLION)
    TABLE 7. TRANSDERMAL DRUG DELIVERY SYSTEMS MARKET REVENUE, FOR ANALGESICS, BY REGION , 2020-2030,($MILLION)
    TABLE 8. TRANSDERMAL DRUG DELIVERY SYSTEMS MARKET ANALGESICS BY COUNTRY, 2020-2030,($MILLION)
    TABLE 9. TRANSDERMAL DRUG DELIVERY SYSTEMS MARKET REVENUE, FOR HORMONE REPLACEMENT THERAPIES, BY REGION , 2020-2030,($MILLION)
    TABLE 10. TRANSDERMAL DRUG DELIVERY SYSTEMS MARKET HORMONE REPLACEMENT THERAPIES BY COUNTRY, 2020-2030,($MILLION)
    TABLE 11. TRANSDERMAL DRUG DELIVERY SYSTEMS MARKET REVENUE, FOR HYPERTENSION, BY REGION , 2020-2030,($MILLION)
    TABLE 12. TRANSDERMAL DRUG DELIVERY SYSTEMS MARKET HYPERTENSION BY COUNTRY, 2020-2030,($MILLION)
    TABLE 13. TRANSDERMAL DRUG DELIVERY SYSTEMS MARKET REVENUE, FOR MOTION SICKNESS, BY REGION , 2020-2030,($MILLION)
    TABLE 14. TRANSDERMAL DRUG DELIVERY SYSTEMS MARKET MOTION SICKNESS BY COUNTRY, 2020-2030,($MILLION)
    TABLE 15. TRANSDERMAL DRUG DELIVERY SYSTEMS MARKET REVENUE, FOR SMOKING CESSATION, BY REGION , 2020-2030,($MILLION)
    TABLE 16. TRANSDERMAL DRUG DELIVERY SYSTEMS MARKET SMOKING CESSATION BY COUNTRY, 2020-2030,($MILLION)
    TABLE 17. TRANSDERMAL DRUG DELIVERY SYSTEMS MARKET REVENUE, FOR OTHERS, BY REGION , 2020-2030,($MILLION)
    TABLE 18. TRANSDERMAL DRUG DELIVERY SYSTEMS MARKET OTHERS BY COUNTRY, 2020-2030,($MILLION)
    TABLE 19. TRANSDERMAL DRUG DELIVERY SYSTEMS MARKET, BY REGION, 2020-2030,($MILLION)
    TABLE 20. ASIA-PACIFIC TRANSDERMAL DRUG DELIVERY SYSTEMS MARKET, BY TYPE OF DELIVERY SYSTEM, 2020-2030,($MILLION)
    TABLE 21. ASIA-PACIFIC TRANSDERMAL DRUG DELIVERY SYSTEMS MARKET, BY APPLICATION, 2020-2030,($MILLION)
    TABLE 22. ASIA-PACIFIC TRANSDERMAL DRUG DELIVERY SYSTEMS MARKET, BY COUNTRY, 2020-2030,($MILLION)
    TABLE 23. JAPAN TRANSDERMAL DRUG DELIVERY SYSTEMS MARKET BY TYPE OF DELIVERY SYSTEM 2020-2030,($MILLION)
    TABLE 24. JAPAN TRANSDERMAL DRUG DELIVERY SYSTEMS MARKET BY APPLICATION 2020-2030,($MILLION)
    TABLE 25. CHINA TRANSDERMAL DRUG DELIVERY SYSTEMS MARKET BY TYPE OF DELIVERY SYSTEM 2020-2030,($MILLION)
    TABLE 26. CHINA TRANSDERMAL DRUG DELIVERY SYSTEMS MARKET BY APPLICATION 2020-2030,($MILLION)
    TABLE 27. INDIA TRANSDERMAL DRUG DELIVERY SYSTEMS MARKET BY TYPE OF DELIVERY SYSTEM 2020-2030,($MILLION)
    TABLE 28. INDIA TRANSDERMAL DRUG DELIVERY SYSTEMS MARKET BY APPLICATION 2020-2030,($MILLION)
    TABLE 29. AUSTRALIA TRANSDERMAL DRUG DELIVERY SYSTEMS MARKET BY TYPE OF DELIVERY SYSTEM 2020-2030,($MILLION)
    TABLE 30. AUSTRALIA TRANSDERMAL DRUG DELIVERY SYSTEMS MARKET BY APPLICATION 2020-2030,($MILLION)
    TABLE 31. SOUTH KOREA TRANSDERMAL DRUG DELIVERY SYSTEMS MARKET BY TYPE OF DELIVERY SYSTEM 2020-2030,($MILLION)
    TABLE 32. SOUTH KOREA TRANSDERMAL DRUG DELIVERY SYSTEMS MARKET BY APPLICATION 2020-2030,($MILLION)
    TABLE 33. REST OF ASIA-PACIFIC TRANSDERMAL DRUG DELIVERY SYSTEMS MARKET BY TYPE OF DELIVERY SYSTEM 2020-2030,($MILLION)
    TABLE 34. REST OF ASIA-PACIFIC TRANSDERMAL DRUG DELIVERY SYSTEMS MARKET BY APPLICATION 2020-2030,($MILLION)
    TABLE 35. LAMEA TRANSDERMAL DRUG DELIVERY SYSTEMS MARKET, BY TYPE OF DELIVERY SYSTEM, 2020-2030,($MILLION)
    TABLE 36. LAMEA TRANSDERMAL DRUG DELIVERY SYSTEMS MARKET, BY APPLICATION, 2020-2030,($MILLION)
    TABLE 37. LAMEA TRANSDERMAL DRUG DELIVERY SYSTEMS MARKET, BY COUNTRY, 2020-2030,($MILLION)
    TABLE 38. BRAZIL TRANSDERMAL DRUG DELIVERY SYSTEMS MARKET BY TYPE OF DELIVERY SYSTEM 2020-2030,($MILLION)
    TABLE 39. BRAZIL TRANSDERMAL DRUG DELIVERY SYSTEMS MARKET BY APPLICATION 2020-2030,($MILLION)
    TABLE 40. SAUDI ARABIA TRANSDERMAL DRUG DELIVERY SYSTEMS MARKET BY TYPE OF DELIVERY SYSTEM 2020-2030,($MILLION)
    TABLE 41. SAUDI ARABIA TRANSDERMAL DRUG DELIVERY SYSTEMS MARKET BY APPLICATION 2020-2030,($MILLION)
    TABLE 42. SOUTH AFRICA TRANSDERMAL DRUG DELIVERY SYSTEMS MARKET BY TYPE OF DELIVERY SYSTEM 2020-2030,($MILLION)
    TABLE 43. SOUTH AFRICA TRANSDERMAL DRUG DELIVERY SYSTEMS MARKET BY APPLICATION 2020-2030,($MILLION)
    TABLE 44. REST OF LAMEA TRANSDERMAL DRUG DELIVERY SYSTEMS MARKET BY TYPE OF DELIVERY SYSTEM 2020-2030,($MILLION)
    TABLE 45. REST OF LAMEA TRANSDERMAL DRUG DELIVERY SYSTEMS MARKET BY APPLICATION 2020-2030,($MILLION)
    TABLE 46. NORTH AMERICA TRANSDERMAL DRUG DELIVERY SYSTEMS MARKET, BY TYPE OF DELIVERY SYSTEM, 2020-2030,($MILLION)
    TABLE 47. NORTH AMERICA TRANSDERMAL DRUG DELIVERY SYSTEMS MARKET, BY APPLICATION, 2020-2030,($MILLION)
    TABLE 48. NORTH AMERICA TRANSDERMAL DRUG DELIVERY SYSTEMS MARKET, BY COUNTRY, 2020-2030,($MILLION)
    TABLE 49. U.S. TRANSDERMAL DRUG DELIVERY SYSTEMS MARKET BY TYPE OF DELIVERY SYSTEM 2020-2030,($MILLION)
    TABLE 50. U.S. TRANSDERMAL DRUG DELIVERY SYSTEMS MARKET BY APPLICATION 2020-2030,($MILLION)
    TABLE 51. CANADA TRANSDERMAL DRUG DELIVERY SYSTEMS MARKET BY TYPE OF DELIVERY SYSTEM 2020-2030,($MILLION)
    TABLE 52. CANADA TRANSDERMAL DRUG DELIVERY SYSTEMS MARKET BY APPLICATION 2020-2030,($MILLION)
    TABLE 53. MEXICO TRANSDERMAL DRUG DELIVERY SYSTEMS MARKET BY TYPE OF DELIVERY SYSTEM 2020-2030,($MILLION)
    TABLE 54. MEXICO TRANSDERMAL DRUG DELIVERY SYSTEMS MARKET BY APPLICATION 2020-2030,($MILLION)
    TABLE 55. EUROPE TRANSDERMAL DRUG DELIVERY SYSTEMS MARKET, BY TYPE OF DELIVERY SYSTEM, 2020-2030,($MILLION)
    TABLE 56. EUROPE TRANSDERMAL DRUG DELIVERY SYSTEMS MARKET, BY APPLICATION, 2020-2030,($MILLION)
    TABLE 57. EUROPE TRANSDERMAL DRUG DELIVERY SYSTEMS MARKET, BY COUNTRY, 2020-2030,($MILLION)
    TABLE 58. GERMANY TRANSDERMAL DRUG DELIVERY SYSTEMS MARKET BY TYPE OF DELIVERY SYSTEM 2020-2030,($MILLION)
    TABLE 59. GERMANY TRANSDERMAL DRUG DELIVERY SYSTEMS MARKET BY APPLICATION 2020-2030,($MILLION)
    TABLE 60. FRANCE TRANSDERMAL DRUG DELIVERY SYSTEMS MARKET BY TYPE OF DELIVERY SYSTEM 2020-2030,($MILLION)
    TABLE 61. FRANCE TRANSDERMAL DRUG DELIVERY SYSTEMS MARKET BY APPLICATION 2020-2030,($MILLION)
    TABLE 62. U.K. TRANSDERMAL DRUG DELIVERY SYSTEMS MARKET BY TYPE OF DELIVERY SYSTEM 2020-2030,($MILLION)
    TABLE 63. U.K. TRANSDERMAL DRUG DELIVERY SYSTEMS MARKET BY APPLICATION 2020-2030,($MILLION)
    TABLE 64. ITALY TRANSDERMAL DRUG DELIVERY SYSTEMS MARKET BY TYPE OF DELIVERY SYSTEM 2020-2030,($MILLION)
    TABLE 65. ITALY TRANSDERMAL DRUG DELIVERY SYSTEMS MARKET BY APPLICATION 2020-2030,($MILLION)
    TABLE 66. SPAIN TRANSDERMAL DRUG DELIVERY SYSTEMS MARKET BY TYPE OF DELIVERY SYSTEM 2020-2030,($MILLION)
    TABLE 67. SPAIN TRANSDERMAL DRUG DELIVERY SYSTEMS MARKET BY APPLICATION 2020-2030,($MILLION)
    TABLE 68. REST OF EUROPE TRANSDERMAL DRUG DELIVERY SYSTEMS MARKET BY TYPE OF DELIVERY SYSTEM 2020-2030,($MILLION)
    TABLE 69. REST OF EUROPE TRANSDERMAL DRUG DELIVERY SYSTEMS MARKET BY APPLICATION 2020-2030,($MILLION)
    TABLE 70.VIATRIS INC.: COMPANY SNAPSHOT
    TABLE 71.VIATRIS INC.: OPERATING SEGMENTS
    TABLE 72.VIATRIS INC.: PRODUCT PORTFOLIO
    TABLE 73.VIATRIS INC.: NET SALES,
    TABLE 74.VIATRIS INC.: KEY STRATERGIES
    TABLE 75.BAYER AG: COMPANY SNAPSHOT
    TABLE 76.BAYER AG: OPERATING SEGMENTS
    TABLE 77.BAYER AG: PRODUCT PORTFOLIO
    TABLE 78.BAYER AG: NET SALES,
    TABLE 79.BAYER AG: KEY STRATERGIES
    TABLE 80.BOEHRINGER INGELHEIM GMBH: COMPANY SNAPSHOT
    TABLE 81.BOEHRINGER INGELHEIM GMBH: OPERATING SEGMENTS
    TABLE 82.BOEHRINGER INGELHEIM GMBH: PRODUCT PORTFOLIO
    TABLE 83.BOEHRINGER INGELHEIM GMBH: NET SALES,
    TABLE 84.BOEHRINGER INGELHEIM GMBH: KEY STRATERGIES
    TABLE 85.ENDO INTERNATIONAL PLC: COMPANY SNAPSHOT
    TABLE 86.ENDO INTERNATIONAL PLC: OPERATING SEGMENTS
    TABLE 87.ENDO INTERNATIONAL PLC: PRODUCT PORTFOLIO
    TABLE 88.ENDO INTERNATIONAL PLC: NET SALES,
    TABLE 89.ENDO INTERNATIONAL PLC: KEY STRATERGIES
    TABLE 90.GLAXOSMITHKLINE PLC: COMPANY SNAPSHOT
    TABLE 91.GLAXOSMITHKLINE PLC: OPERATING SEGMENTS
    TABLE 92.GLAXOSMITHKLINE PLC: PRODUCT PORTFOLIO
    TABLE 93.GLAXOSMITHKLINE PLC: NET SALES,
    TABLE 94.GLAXOSMITHKLINE PLC: KEY STRATERGIES
    TABLE 95.JOHNSON & JOHNSON: COMPANY SNAPSHOT
    TABLE 96.JOHNSON & JOHNSON: OPERATING SEGMENTS
    TABLE 97.JOHNSON & JOHNSON: PRODUCT PORTFOLIO
    TABLE 98.JOHNSON & JOHNSON: NET SALES,
    TABLE 99.JOHNSON & JOHNSON: KEY STRATERGIES
    TABLE 100.NOVARTIS AG: COMPANY SNAPSHOT
    TABLE 101.NOVARTIS AG: OPERATING SEGMENTS
    TABLE 102.NOVARTIS AG: PRODUCT PORTFOLIO
    TABLE 103.NOVARTIS AG: NET SALES,
    TABLE 104.NOVARTIS AG: KEY STRATERGIES
    TABLE 105.PURDUE PHARMA L.P.: COMPANY SNAPSHOT
    TABLE 106.PURDUE PHARMA L.P.: OPERATING SEGMENTS
    TABLE 107.PURDUE PHARMA L.P.: PRODUCT PORTFOLIO
    TABLE 108.PURDUE PHARMA L.P.: NET SALES,
    TABLE 109.PURDUE PHARMA L.P.: KEY STRATERGIES
    TABLE 110.ALTARIS: COMPANY SNAPSHOT
    TABLE 111.ALTARIS: OPERATING SEGMENTS
    TABLE 112.ALTARIS: PRODUCT PORTFOLIO
    TABLE 113.ALTARIS: NET SALES,
    TABLE 114.ALTARIS: KEY STRATERGIES
    TABLE 115.HISAMITSU PHARMACEUTICAL CO. INC.: COMPANY SNAPSHOT
    TABLE 116.HISAMITSU PHARMACEUTICAL CO. INC.: OPERATING SEGMENTS
    TABLE 117.HISAMITSU PHARMACEUTICAL CO. INC.: PRODUCT PORTFOLIO
    TABLE 118.HISAMITSU PHARMACEUTICAL CO. INC.: NET SALES,
    TABLE 119.HISAMITSU PHARMACEUTICAL CO. INC.: KEY STRATERGIES
  • LIST OF FIGURES

  • FIGURE 1.TRANSDERMAL DRUG DELIVERY SYSTEMS MARKET SEGMENTATION
    FIGURE 2.TRANSDERMAL DRUG DELIVERY SYSTEMS MARKET,2020-2030
    FIGURE 3.TRANSDERMAL DRUG DELIVERY SYSTEMS MARKET,2020-2030
    FIGURE 4. TOP INVESTMENT POCKETS, BY REGION
    FIGURE 5.PORTER FIVE-1
    FIGURE 6.PORTER FIVE-2
    FIGURE 7.PORTER FIVE-3
    FIGURE 8.PORTER FIVE-4
    FIGURE 9.PORTER FIVE-5
    FIGURE 10.TOP PLAYER POSITIONING
    FIGURE 11.TRANSDERMAL DRUG DELIVERY SYSTEMS MARKET:DRIVERS, RESTRAINTS AND OPPORTUNITIES
    FIGURE 11.TRANSDERMAL DRUG DELIVERY SYSTEMS MARKET,BY TYPE OF DELIVERY SYSTEM,2020(%)
    FIGURE 12.COMPARATIVE SHARE ANALYSIS OF PASSIVE TRANSDERMAL DRUG DELIVERY SYSTEMS MARKET,2020-2030(%)
    FIGURE 13.COMPARATIVE SHARE ANALYSIS OF ACTIVE TRANSDERMAL DRUG DELIVERY SYSTEMS MARKET,2020-2030(%)
    FIGURE 14.TRANSDERMAL DRUG DELIVERY SYSTEMS MARKET,BY APPLICATION,2020(%)
    FIGURE 15.COMPARATIVE SHARE ANALYSIS OF ANALGESICS TRANSDERMAL DRUG DELIVERY SYSTEMS MARKET,2020-2030(%)
    FIGURE 16.COMPARATIVE SHARE ANALYSIS OF HORMONE REPLACEMENT THERAPIES TRANSDERMAL DRUG DELIVERY SYSTEMS MARKET,2020-2030(%)
    FIGURE 17.COMPARATIVE SHARE ANALYSIS OF HYPERTENSION TRANSDERMAL DRUG DELIVERY SYSTEMS MARKET,2020-2030(%)
    FIGURE 18.COMPARATIVE SHARE ANALYSIS OF MOTION SICKNESS TRANSDERMAL DRUG DELIVERY SYSTEMS MARKET,2020-2030(%)
    FIGURE 19.COMPARATIVE SHARE ANALYSIS OF SMOKING CESSATION TRANSDERMAL DRUG DELIVERY SYSTEMS MARKET,2020-2030(%)
    FIGURE 20.COMPARATIVE SHARE ANALYSIS OF OTHERS TRANSDERMAL DRUG DELIVERY SYSTEMS MARKET,2020-2030(%)
    FIGURE 21.TRANSDERMAL DRUG DELIVERY SYSTEMS MARKET BY REGION,2020
    FIGURE 22.JAPAN TRANSDERMAL DRUG DELIVERY SYSTEMS MARKET,2020-2030($MILLION)
    FIGURE 23.CHINA TRANSDERMAL DRUG DELIVERY SYSTEMS MARKET,2020-2030($MILLION)
    FIGURE 24.INDIA TRANSDERMAL DRUG DELIVERY SYSTEMS MARKET,2020-2030($MILLION)
    FIGURE 25.AUSTRALIA TRANSDERMAL DRUG DELIVERY SYSTEMS MARKET,2020-2030($MILLION)
    FIGURE 26.SOUTH KOREA TRANSDERMAL DRUG DELIVERY SYSTEMS MARKET,2020-2030($MILLION)
    FIGURE 27.REST OF ASIA-PACIFIC TRANSDERMAL DRUG DELIVERY SYSTEMS MARKET,2020-2030($MILLION)
    FIGURE 28.BRAZIL TRANSDERMAL DRUG DELIVERY SYSTEMS MARKET,2020-2030($MILLION)
    FIGURE 29.SAUDI ARABIA TRANSDERMAL DRUG DELIVERY SYSTEMS MARKET,2020-2030($MILLION)
    FIGURE 30.SOUTH AFRICA TRANSDERMAL DRUG DELIVERY SYSTEMS MARKET,2020-2030($MILLION)
    FIGURE 31.REST OF LAMEA TRANSDERMAL DRUG DELIVERY SYSTEMS MARKET,2020-2030($MILLION)
    FIGURE 32.U.S. TRANSDERMAL DRUG DELIVERY SYSTEMS MARKET,2020-2030($MILLION)
    FIGURE 33.CANADA TRANSDERMAL DRUG DELIVERY SYSTEMS MARKET,2020-2030($MILLION)
    FIGURE 34.MEXICO TRANSDERMAL DRUG DELIVERY SYSTEMS MARKET,2020-2030($MILLION)
    FIGURE 35.GERMANY TRANSDERMAL DRUG DELIVERY SYSTEMS MARKET,2020-2030($MILLION)
    FIGURE 36.FRANCE TRANSDERMAL DRUG DELIVERY SYSTEMS MARKET,2020-2030($MILLION)
    FIGURE 37.U.K. TRANSDERMAL DRUG DELIVERY SYSTEMS MARKET,2020-2030($MILLION)
    FIGURE 38.ITALY TRANSDERMAL DRUG DELIVERY SYSTEMS MARKET,2020-2030($MILLION)
    FIGURE 39.SPAIN TRANSDERMAL DRUG DELIVERY SYSTEMS MARKET,2020-2030($MILLION)
    FIGURE 40.REST OF EUROPE TRANSDERMAL DRUG DELIVERY SYSTEMS MARKET,2020-2030($MILLION)
    FIGURE 41. TOP WINNING STRATEGIES, BY YEAR
    FIGURE 42. TOP WINNING STRATEGIES, BY DEVELOPMENT
    FIGURE 43. TOP WINNING STRATEGIES, BY COMPANY
    FIGURE 44.PRODUCT MAPPING OF TOP 10 PLAYERS
    FIGURE 45.COMPETITIVE DASHBOARD
    FIGURE 46.COMPETITIVE HEATMAP OF TOP 10 KEY PLAYERS
    FIGURE 47.VIATRIS INC..: NET SALES ,($MILLION)
    FIGURE 48.BAYER AG.: NET SALES ,($MILLION)
    FIGURE 49.BOEHRINGER INGELHEIM GMBH.: NET SALES ,($MILLION)
    FIGURE 50.ENDO INTERNATIONAL PLC.: NET SALES ,($MILLION)
    FIGURE 51.GLAXOSMITHKLINE PLC.: NET SALES ,($MILLION)
    FIGURE 52.JOHNSON & JOHNSON.: NET SALES ,($MILLION)
    FIGURE 53.NOVARTIS AG.: NET SALES ,($MILLION)
    FIGURE 54.PURDUE PHARMA L.P..: NET SALES ,($MILLION)
    FIGURE 55.ALTARIS.: NET SALES ,($MILLION)
    FIGURE 56.HISAMITSU PHARMACEUTICAL CO. INC..: NET SALES ,($MILLION)


The transdermal drug delivery systems market witnessed significant growth in past few years, owing to rapid growth of pharmaceutical industry across the globe and increase in spending on healthcare facilities in developing countries.

Rise in demand for pharmaceutical products fueled by increase in global population and rise in number of lifestyle diseases boosted the demand for transdermal drug delivery systems in the pharmaceutical industry. Furthermore, rise in geriatric populations created a rise in demand for effective drug delivery systems. Also, use of transdermal delivery system helps in controlling the dosage of drug to be given, and proves to be significantly more effective for analgesics. In addition, medication from transdermal drug delivery systems can easily be discontinued by peeling off the patch.

Moreover, supportive government initiatives and rapid growth of the pharmaceutical industry in emerging countries provide lucrative growth opportunities for the transdermal drug delivery systems market.

PURCHASE OPTIONS

Call or Email us

U.S.-Canada Toll-free: +1-800-792-5285
Int'l : +1-503-894-6022
Europe : +44-845-528-1300
Email : help@alliedmarketresearch.com
 
FREQUENTLY ASKED QUESTIONS?

A. North America is the largest regional market for transdermal drug delivery system.

A. Business expansion is key growth strategy of transdermal drug delivery system industry players

A. Altaris, Johnson & Johnson, GlaxoSmithKline plc and Hisamitsu Pharmaceutical Co. Inc. are some of the top companies to hold the market share in transdermal drug delivery system.

A. The company profile has been selected on factors such as geographical presence, market dominance (in terms of revenue and volume sales), various strategies and recent developments.

A. In 2020, $52,476.5 million is the estimated industry size of transdermal drug delivery system.

Looking for Customization?

 Customization Request

Have a Question?

 Speak with Analyst

Any Confusion?

 Inquire Before Buying

Have a glance of the Report

  Request Sample
RELATED TAGS

Purchase Full Report of
Transdermal Drug Delivery Systems Market

Start reading instantly.
This Report and over 66,905+ more Reports, Available with Avenue Library. T&C*.

  • Online Only
  • $3,565
  • Online cloud access only
  • Restricted print, copy, paste & download
  • Read only
  • Free industry update
    (Within 180 days)
  • Free report update in next update cycle
    (Mar 2023 - Mar 2024)
  • Data Pack
  • $3,961
  • Restricted to one authorized user
  • One print only
  • Available in
    Excel
  • Free industry update
    (Within 180 days)
  •   Free report update in next update cycle
    (Mar 2023 - Mar 2024)
  • Single User
  • $5,540
  • Restricted to one authorized user
  • One print only
  • Available in
    PDF
  • Free industry update
    (Within 180 days)
  •   Free report update in next update cycle
    (Mar 2023 - Mar 2024)
  • Five Users
  • $6,654
  • Limited to five authorized users
  • Print upto five copies
  • Available in
    PDF
  • Free industry update
    (Within 180 days)
  •   Free report update in next update cycle
    (Mar 2023 - Mar 2024)
  • Enterprise
    License/PDF

  • $10,280
  • Unlimited
    within
    company/enterprise
  • Available in Excel & PDF
  • Free industry update
    (Within 180 days)
  •   Free report update in next update cycle
    (Mar 2023 - Mar 2024)
  • Library
    Membership

  • $999 $ 1,175
    Per User/ Per month/ Billed annually
  • Published Content
    E-access
  • Company Profiles
    E-access
  • Newly Added Content Access
  • 10 PDF
    Downloads
  • 5 Excel Data
    Pack Downloads
  • 250 Company Profiles PDF Downloads
  • Buy Now

*Taxes/Fees, if applicable will be added during checkout. All prices in USD

RELATED REPORTS
 

Why Allied Market Research?


Infallible Methodology

To ensure high-level data integrity, accurate analysis, and impeccable forecasts

Analyst Support

For complete satisfaction

Customization

On-demand customization of scope of the report to exactly meet your needs

TARGETED MARKET VIEW

Targeted market view to provide pertinent information and save time of readers

Get fresh content delivered

Get insights on topics that are crucial for your business. Stay abreast of your interest areas.

Get Industry Data Alerts

Why Allied Market Research?

Infallible Methodology

To ensure high-level data integrity, accurate analysis, and impeccable forecasts

Analyst Support

For complete satisfaction

Customization

On-demand customization of scope of the report to exactly meet your needs

TARGETED MARKET VIEW

Targeted market view to provide pertinent information and save time of readers