0
2019
U.s. Enterprise Agile Transformation Services Market

U.S. Enterprise Agile Transformation Services Market

By Methodology (Scrum, Scrumban, ScrumXP, Kanban, Custom Hybrid, and Others), Service Type (Agile Readiness Assessment, Agile Training & Coaching, Agile Development, Agile Consulting, and Others), Organization Size (Large Enterprise and Small & Medium Enterprise), and Industry Vertical (BFSI, IT & Telecom, Retail, Media & Entertainment, Government & Public Sector, Manufacturing, Healthcare, and Others): Opportunity Analysis And Industry Forecast, 2019-2026

Report Code: A05035
Jul 2019 | Pages: 194
Tables: 79
Charts: 41
  • Formats*:

  • pdf

    Single User License, Five User
    License & Enterprise User License

  • xls

    Data Pack Excel License

  • ppt

    It comes with the additional cost
    of $2500.00 contact sales.


COVID-19

Pandemic disrupted the entire world and affected many industries.

Get detailed COVID-19 impact analysis on the U.s. Enterprise Agile Transformation Services Market

Request Now !

U.S. Enterprise Agile Transformation Services Market Outlook - 2026

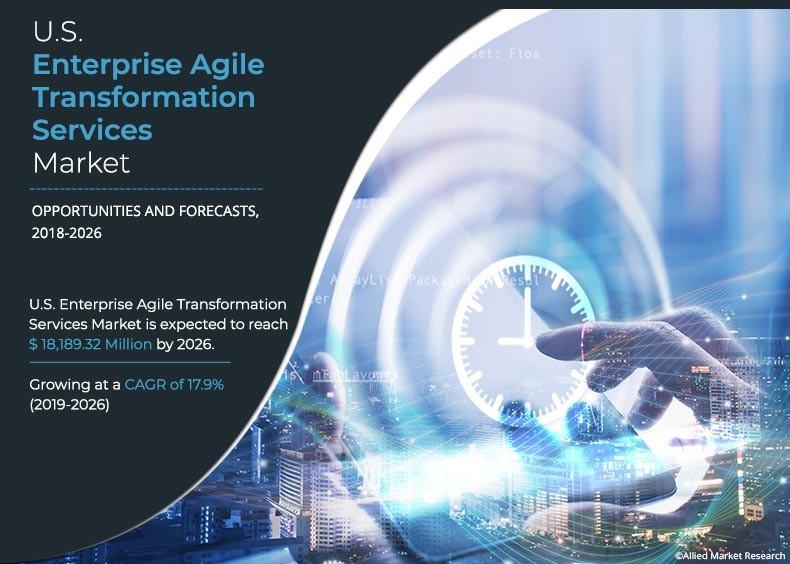
An agile transformation service helps enterprises to sustain the intense competition in the market and the threat of market disruption that is driven by advances in technology. Increase in inclination toward digital transformation among conventional organizations is one of the major factors driving the adoption of agile services across the U.S. Moreover, rise in awareness about agile transformation services and surge in need to reallocate resources skillfully & rapidly are the major factors anticipated to drive the U.S. enterprise agile transformation services market growth in this region. Furthermore, presence of multiple companies, which focus on embedding customer centricity in their product offerings is anticipated to offer lucrative opportunity for market expansion in this region. The U.S. enterprise agile transformation services market size was valued at $4,915.43 million in 2018, and is projected to reach $18,189.32 million by 2026, registering a CAGR of 17.9% from 2019 to 2026.

U.S. Enterprise Agile Transformation Services Market Outlook 2026

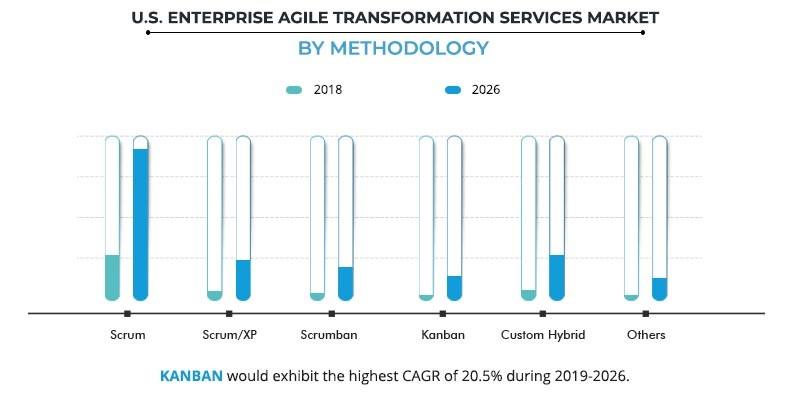
The scrum segment dominated the overall U.S. enterprise agile transformation services market size in 2018, and is expected to continue this trend during the forecast period, due to increase in need to efficiently manage the team structure and work. Furthermore, the custom hybrid segment is expected to grow at a rapid pace throughout the U.S. enterprise agile transformation services market forecast period.

U.S. Enterprise Agile Transformation Services Market by Service Type

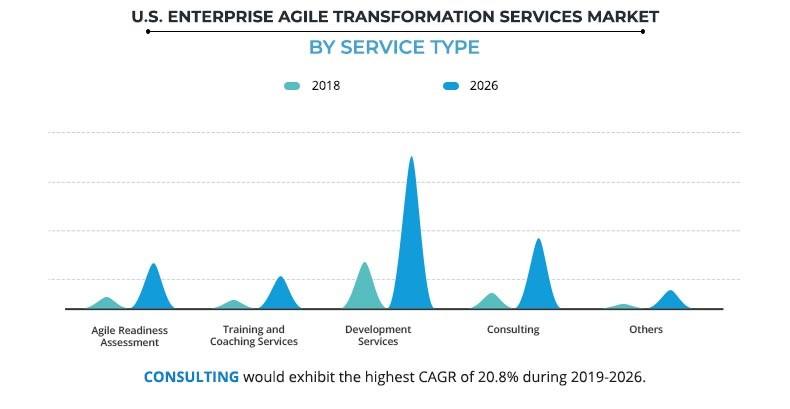
The development services segment is expected to garner significant U.S. enterprise agile transformation services market share in forecast period. The growth of this segment is mainly attributed to the evolving technologies and growing need to transform industries.

U.S. Enterprise Agile Transformation Services Market by Methodology

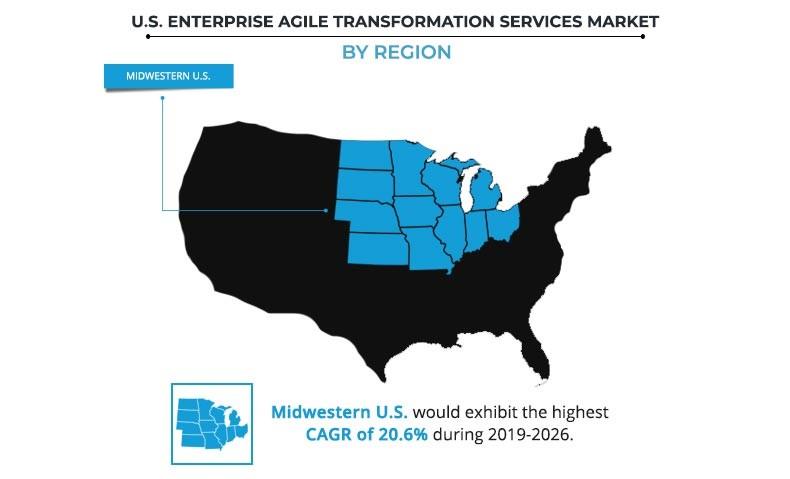
The Western U.S. accounted for the highest U.S. enterprise agile transformation services market share in 2018, and is projected to remain dominant during the forecast period owing to presence of major market players in the country. In addition, increase in demand for agile transformation services from small-scale industries is fueling the market growth in this region. Furthermore, Southwestern U.S. is expected to exhibit the highest CAGR during the forecast period, and considered as a major U.S. enterprise agile transformation services market opportunity.

U.S. Enterprise Agile Transformation Services Market Regional Analysis

The report focuses on the growth prospects, restraints, and trends of the U.S. enterprise agile transformation services market analysis. The study provides Porter’s five forces analysis to understand the impact of various factors such as bargaining power of suppliers, competitive intensity of competitors, threat of new entrants, threat of substitutes, and bargaining power of buyers on the U.S. enterprise agile transformation services market.

U.S. Enterprise Agile Transformation Services Market by Industry Vertical

Segment review

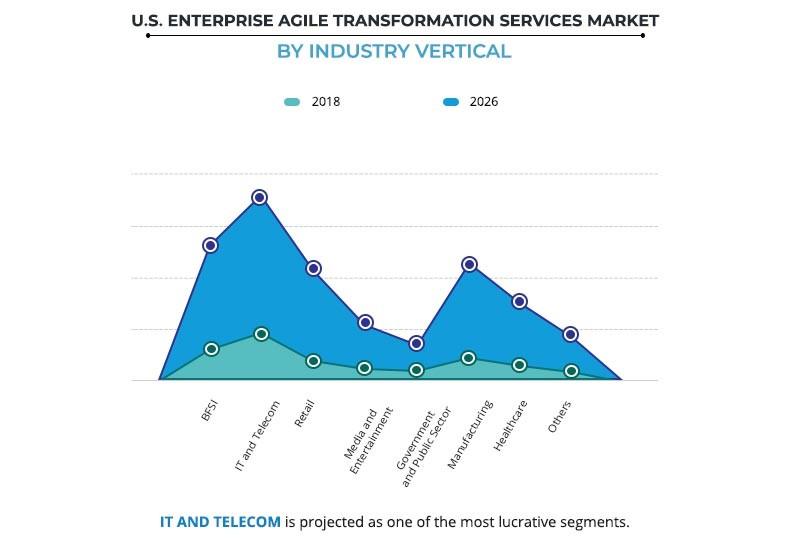
The U.S. enterprise agile transformation services market is segmented based on methodology, service type, organization size, industry vertical, and region. Depending on methodology, the market is divided into scrum, scrumXP, scrumban, kanban, custom hybrid, and others. By service type, it is categorized into agile readiness assessment, training & coaching services, development services, consulting, and others. On the basis of organization size, it is bifurcated into large enterprises and SMEs. As per industry vertical, it is classified into, BFSI, IT & telecom, retail, media & entertainment, government & public sector, manufacturing, healthcare, and others. Region wise, it is analyzed across Western U.S., Southeastern U.S., Southwestern U.S., Northeastern U.S., and Midwestern U.S.

Some of the key players covered in the U.S. enterprise agile transformation services industry such as Accenture Plc., Agile Sparks Broadcom Inc., Endava Plc, Hexaware Technologies Limited, International Business Machines Corporation, LeadingAgile, Symphony Solutions, Xebia Group, and Cognizant Technology Solutions Corporation, and others.

Top impacting factors

Current and future U.S. enterprise agile transformation services market trends are outlined to determine the overall attractiveness of the market. Top impacting factors highlight the opportunities during the forecast period. Factors such as upsurge in need for faster time-to-market in product development, continuous changes in business needs, and increase in need for better communication & collaboration among businesses, along with the rise in shift from traditional transformation toward agile transformation are the key factors that drive the growth of the U.S. enterprise agile transformation services market. Several benefits of agile transformation, such as reduced costs, more flexibility, quicker time to release, better predictability & quality, and early risk detection boost the adoption of this process among organizations. However, certain issues associated with adoption of agile transformation, such as structural complexities and other architectural complexities are expected to hinder the growth of the market. On the contrary, rise in adoption of agile approaches among major non-IT industries, such as manufacturing, retail, and transportation, and emerging applications of agile approaches in growing Big Data-based complex landscape are expected to present major opportunities for U.S. enterprise agile transformation services market expansion during the forecast period.

Increase in need for accelerated product development

Prolonged development timelines have been considered as one of the major obstacles when it comes to generating returns on innovation as well as product development. The reduced speed-to-market in terms of product development & management offers several financial and nonfinancial benefits. These benefits include faster innovation, lower development costs, high forecasting accuracy, and larger market share. Agile transformation is considered as a crucial factor, which enables time to market, and helps to react faster to changes, thus satisfying user’s requirements. Various studies have shown the benefits of agile adoption in the recent years, as the teams using agile have been?50% faster to market, as well as 25% more productive. By adopting agile, the companies are able to strategize their businesses by reacting quickly to competitors’ moves. In addition, lower development costs offered by agile transformation, owing to streamlined processes and limited iterations present agile as one of the top selective alternatives for faster time to market needs. This serves as a key driver of U.S. enterprise agile transformation services market expansion.

Shift in business needs

The technological disruption across all the industry verticals has pushed the limits of all enterprises across the world. This has led to intense competition across all the markets, as new entrants come up with innovative business ideas, due to varying consumer demands and business needs. Moreover, traditional ways of handling business are failing owing to lack in adoption of recent technologies and improper management of teams & businesses, which in turn boost the adoption of agile transformations services. Furthermore, rise in business risks and fluctuations in market dynamics heavily impact business operations, which further drive the demand for agile transformation services.

Increase in adoption of agile services among non-IT industries

Though agile development and transformation have been heavily used in IT organizations, a significant adoption trend has been noticed in non-IT organizations. The core principles of agile help organizations to deal with complex systems and processes within an organization. Several useful features such as workflow tracking and story mapping & analytics are some major factors to attract end-user industries, such as BFSI, manufacturing, retail, transportation, and others. In addition, the need for improved visibility & predictability among teams and focus on continuous improvement in product development & management have been shifting the preference of companies from traditional methodologies to agile methodologies. Moreover, various successful implementations of agile transformation have been recorded in the recent years. For instance, head staff of Air Methods, an emergency air transport company, started using agile practice of keeping a prioritized backlog in a public Trello board to manage the strategy for creating training and education for the organization. Adoption of agile practice of the prioritized backlog helped its employees in achieving better and transparent communication. More number of such implementations are expected in other fields such as energy & utilities, healthcare, and transportation, thereby offering remunerative opportunities for the U.S. enterprise agile transformation services market.

Key Benefits for U.S. Enterprise Agile Transformation Services Market:

  • This study presents the U.S. enterprise agile transformation services market analysis, trends and future estimations to determine the imminent investment pockets.
  • A detailed analysis of the segments measures the potential of the market. These segments outline the favorable conditions for the U.S. enterprise agile transformation services market.
  • The report presents information related to key drivers, restraints, and opportunities.
  • The current U.S. enterprise agile transformation services market is quantitatively analyzed from 2018 to 2025 to highlight the financial competency of the industry.
  • Porter’s five forces analysis illustrates the potency of buyers & suppliers in the industry.

U.S. Enterprise Agile Transformation Services Market Report Highlights

Aspects Details
By Methodology
  • Scrum
  • ScrumXP
  • Scrumban
  • Kanban
  • Custom Hybrid
  • Others
By Service Type
  • Agile Readiness Assessment
  • Agile Training & Coaching
  • Agile Development
  • Agile Consulting
  • Others
By Organization Size
  • Large Enterprises
  • Small & medium Enterprises
By Industry Vertical
  • BFSI
  • IT & Telecom
  • Retail
  • Media & Entertainment
  • Government & Public Sector
  • Manufacturing
  • Healthcare
  • Others
By Region
  • Western U.S. 
  • Southeastern U.S. 
  • Southwestern U.S. 
  • Northeastern U.S. 
  • Midwestern U.S. 
Key Market Players Broadcom Inc., Hexaware Technologies Limited, Xebia Group, Endava Plc., Symphony Solutions, International Business Machines Corporation (IBM), LeadingAgile, Accenture Plc., AgileSparks, Cognizant Technology Solutions Corporation
 

CHAPTER 1:    INTRODUCTION

1.1.    Report description
1.2.    Key benefits for stakeholders
1.3.    Key market segments
1.4.    Research methodology

1.4.1.    Secondary research
1.4.2.    Primary research
1.4.3.    Analyst tools & models

CHAPTER 2:    EXECUTIVE SUMMARY

2.1.    Key findings

2.1.1.    Top impacting factors
2.1.2.    Top investment pockets
2.1.3.    Top winning strategies

2.2.    CXO perspective

CHAPTER 3:    MARKET OVERVIEW

3.1.    Market definition and scope
3.2.    Key forces shaping U.S. enterprise agile transformation services market
3.3.    Case studies

3.3.1.    William Hill
3.3.2.    American Association of Insurance Services (AAIS)

3.4.    Market dynamics

3.4.1.    Drivers

3.4.1.1.    Increase in need for accelerated product development
3.4.1.2.    Surge in need to improve teamwork and communication in enterprises
3.4.1.3.    Shift in business needs

3.4.2.    Restraint

3.4.2.1.    Frequent failure rates

3.4.3.    Opportunities

3.4.3.1.    Increase in adoption of agile services among non-IT industries
3.4.3.2.    Emerging applications of agile in growing Big Data complex landscape

3.5.    Key player positioning, 2018

CHAPTER 4:    U.S. ENTERPRISE AGILE TRANSFORMATION SERVICES MARKET, BY METHODOLOGY

4.1.    Overview
4.2.    Scrum

4.2.1.    Key market trends, growth factors, and opportunities
4.2.2.    Market size and forecast, by region

4.3.    Scrumban

4.3.1.    Key market trends, growth factors, and opportunity
4.3.2.    Market size and forecast, by region

4.4.    ScrumXP

4.4.1.    Key market trends, growth factors, and opportunity
4.4.2.    Market size and forecast, by region

4.5.    Kanban

4.5.1.    Key market trends, growth factors, and opportunities
4.5.2.    Market size and forecast, by region

4.6.    Custom hybrid

4.6.1.    Key market trends, growth factors, and opportunity
4.6.2.    Market size and forecast, by region

4.7.    Others

4.7.1.    Key market trends, growth factors, and opportunity
4.7.2.    Market size and forecast, by region

CHAPTER 5:    U.S. ENTERPRISE AGILE TRANSFORMATION SERVICES MARKET, BY SERVICE TYPE

5.1.    Overview
5.2.    Agile readiness assessment

5.2.1.    Key market trends, growth factors, and opportunities
5.2.2.    Market size and forecast, by region

5.3.    Agile training & coaching

5.3.1.    Key market trends, growth factors, and opportunities
5.3.2.    Market size and forecast, by region

5.4.    Agile consulting

5.4.1.    Key market trends, growth factors, and opportunities
5.4.2.    Market size and forecast, by region

5.5.    Agile development

5.5.1.    Key market trends, growth factors, and opportunities
5.5.2.    Market size and forecast, by region

5.6.    Others

5.6.1.    Key market trends, growth factors, and opportunities
5.6.2.    Market size and forecast, by region

CHAPTER 6:    U.S. ENTERPRISE AGILE TRANSFORMATION SERVICES MARKET, BY ORGANIZATION SIZE

6.1.    Overview
6.2.    Large  enterprises

6.2.1.    Key market trends, growth factors, and opportunities
6.2.2.    Market size and forecast, by region

6.3.    Small & medium enterprises

6.3.1.    Key market trends, growth factors, and opportunities
6.3.2.    Market size and forecast, by region

CHAPTER 7:    U.S. ENTERPRISE AGILE TRANSFORMATION SERVICES MARKET, BY INDUSTRY VERTICAL

7.1.    Overview
7.2.    BFSI

7.2.1.    Key market trends, growth factors, and opportunities
7.2.2.    Market size and forecast, by region

7.3.    IT & telecom

7.3.1.    Key market trends, growth factors, and opportunities
7.3.2.    Market size and forecast, by region

7.4.    Retail

7.4.1.    Key market trends, growth factors, and opportunities
7.4.2.    Market size and forecast, by region

7.5.    Media & entertainment

7.5.1.    Key market trends, growth factors, and opportunities
7.5.2.    Market size and forecast, by region

7.6.    Government & public sector

7.6.1.    Key market trends, growth factors, and opportunities
7.6.2.    Market size and forecast, by region

7.7.    Manufacturing

7.7.1.    Key market trends, growth factors, and opportunities
7.7.2.    Market size and forecast, by region

7.8.    Healthcare

7.8.1.    Key market trends, growth factors, and opportunities
7.8.2.    Market size and forecast, by region

7.9.    Others

7.9.1.    Key market trends, growth factors, and opportunities
7.9.2.    Market size and forecast, by region

CHAPTER 8:    U.S. ENTERPRISE AGILE TRANSFORMATION SERVICES MARKET, BY REGION

8.1.    Overview
8.2.    Western U.S.

8.2.1.    Key market trends, growth factors and opportunities
8.2.2.    Market size and forecast, by methodology
8.2.3.    Market size and forecast, by service type
8.2.4.    Market size and forecast, by organization size
8.2.5.    Market size and forecast, by industry vertical

8.3.    Southeastern U.S.

8.3.1.    Key market trends, growth factors and opportunities
8.3.2.    Market size and forecast, by methodology
8.3.3.    Market size and forecast, by service type
8.3.4.    Market size and forecast, by organization size
8.3.5.    Market size and forecast, by industry vertical

8.4.    Southwestern U.S.

8.4.1.    Key market trends, growth factors and opportunities
8.4.2.    Market size and forecast, by methodology
8.4.3.    Market size and forecast, by service type
8.4.4.    Market size and forecast, by organization size
8.4.5.    Market size and forecast, by industry vertical

8.5.    Northeastern U.S.

8.5.1.    Key market trends, growth factors and opportunities
8.5.2.    Market size and forecast, by methodology
8.5.3.    Market size and forecast, by service type
8.5.4.    Market size and forecast, by organization size
8.5.5.    Market size and forecast, by industry vertical

8.6.    Midwestern U.S.

8.6.1.    Key market trends, growth factors and opportunities
8.6.2.    Market size and forecast, by methodology
8.6.3.    Market size and forecast, by service type
8.6.4.    Market size and forecast, by organization size
8.6.5.    Market size and forecast, by industry vertical

CHAPTER 9:    COMPANY PROFILE

9.1.    Accenture Plc.

9.1.1.    Company overview
9.1.2.    Key executives
9.1.3.    Company snapshot
9.1.4.    Operating business segments
9.1.5.    Product portfolio
9.1.6.    Business performance
9.1.7.    Key strategic moves and developments

9.2.    AgileSparks

9.2.1.    Company overview
9.2.2.    Key executives
9.2.3.    Company snapshot
9.2.4.    Product portfolio
9.2.5.    Key strategic moves and developments

9.3.    Broadcom Inc.

9.3.1.    Company overview
9.3.2.    Key Executives
9.3.3.    Company snapshot
9.3.4.    Operating business segments
9.3.5.    Product portfolio
9.3.6.    R&D expenditure
9.3.7.    Business performance
9.3.8.    Key strategic moves and developments

9.4.    Endava Plc.

9.4.1.    Company overview
9.4.2.    Key Executives
9.4.3.    Company snapshot
9.4.4.    Product portfolio
9.4.5.    Business performance
9.4.6.    Key strategic moves and developments

9.5.    Hexaware Technologies Limited

9.5.1.    Company overview
9.5.2.    Key Executives
9.5.3.    Company snapshot
9.5.4.    Product portfolio
9.5.5.    Business performance
9.5.6.    Key strategic moves and developments

9.6.    International Business Machines Corporation (IBM)

9.6.1.    Company overview
9.6.2.    Key Executives
9.6.3.    Company snapshot
9.6.4.    Operating business segments
9.6.5.    Product portfolio
9.6.6.    R&D expenditure
9.6.7.    Business performance
9.6.8.    Key strategic moves and developments

9.7.    LeadingAgile

9.7.1.    Company overview
9.7.2.    Key Executives
9.7.3.    Company snapshot
9.7.4.    Product portfolio
9.7.5.    Key strategic moves and developments

9.8.    Symphony Solutions

9.8.1.    Company overview
9.8.2.    Key Executives
9.8.3.    Company snapshot
9.8.4.    Product portfolio
9.8.5.    Key strategic moves and developments

9.9.    Xebia Group

9.9.1.    Company overview
9.9.2.    Key Executives
9.9.3.    Company snapshot
9.9.4.    Product portfolio
9.9.5.    Key strategic moves and developments

9.10.    Cognizant Technology Solutions Corporation

9.10.1.    Company overview
9.10.2.    Key Executives
9.10.3.    Company snapshot
9.10.4.    Operating business segments
9.10.5.    Product portfolio
9.10.6.    Business performance
9.10.7.    Key strategic moves and developments

LIST OF TABLES

TABLE 01.    U.S. ENTERPRISE AGILE TRANSFORMATION SERVICES MARKET REVENUE FOR SCRUM, BY REGION, 2018–2026 ($MILLION)
TABLE 02.    U.S. ENTERPRISE AGILE TRANSFORMATION SERVICES MARKET REVENUE FOR SCRUMBAN BY REGION, 2018–2026 ($MILLION)
TABLE 03.    U.S. ENTERPRISE AGILE TRANSFORMATION SERVICES MARKET REVENUE FOR SCRUMXP BY REGION, 2018–2026 ($MILLION)
TABLE 04.    U.S. ENTERPRISE AGILE TRANSFORMATION SERVICES MARKET REVENUE FOR KANBAN, BY REGION, 2018–2026 ($MILLION)
TABLE 05.    U.S. ENTERPRISE AGILE TRANSFORMATION SERVICES MARKET REVENUE FOR CUSTOM HYBRID BY REGION, 2018–2026 ($MILLION)
TABLE 06.    U.S. ENTERPRISE AGILE TRANSFORMATION SERVICES MARKET REVENUE FOR OTHERS, BY REGION, 2018–2026 ($MILLION)
TABLE 07.    U.S. ENTERPRISE AGILE TRANSFORMATION SERVICES MARKET REVENUE, BY SERVICE TYPE, 2018–2026 ($MILLION)
TABLE 08.    U.S. ENTERPRISE AGILE TRANSFORMATION SERVICES MARKET REVENUE FOR AGILE READINESS ASSESSMENT SERVICES, BY REGION, 2018–2026 ($MILLION)
TABLE 09.    U.S. ENTERPRISE AGILE TRANSFORMATION SERVICES MARKET REVENUE FOR PRIVATE CLOUD, BY REGION, 2018–2026 ($MILLION)
TABLE 10.    U.S. ENTERPRISE AGILE TRANSFORMATION SERVICES MARKET REVENUE FOR CONSULTING SERVICES, BY REGION, 2018–2026 ($MILLION)
TABLE 11.    U.S. ENTERPRISE AGILE TRANSFORMATION SERVICES MARKET REVENUE FOR DEVELOPMENT SERVICES, BY REGION, 2018–2026 ($MILLION)
TABLE 12.    U.S. ENTERPRISE AGILE TRANSFORMATION SERVICES MARKET REVENUE FOR OTHER SERVICES, BY REGION, 2018–2026 ($MILLION)
TABLE 13.    U.S. ENTERPRISE AGILE TRANSFORMATION SERVICES MARKET REVENUE, BY ORGANIZATION SIZE, 2018–2026 ($MILLION)
TABLE 14.    U.S. ENTERPRISE AGILE TRANSFORMATION SERVICES MARKET REVENUE FOR LARGE ENTERPRISES, BY REGION, 2018–2026 ($MILLION)
TABLE 15.    U.S. ENTERPRISE AGILE TRANSFORMATION SERVICES MARKET REVENUE FOR SMES, BY REGION, 2018–2026 ($MILLION)
TABLE 16.    U.S. ENTERPRISE AGILE TRANSFORMATION SERVICES MARKET REVENUE, BY INDUSTRY VERTICAL, 2018–2026 ($MILLION)
TABLE 17.    U.S. ENTERPRISE AGILE TRANSFORMATION SERVICES MARKET REVENUE FOR BFSI, BY REGION, 2018–2026 ($MILLION)
TABLE 18.    U.S. ENTERPRISE AGILE TRANSFORMATION SERVICES MARKET REVENUE FOR IT & TELECOM, BY REGION, 2018–2026 ($MILLION)
TABLE 19.    U.S. ENTERPRISE AGILE TRANSFORMATION SERVICES MARKET REVENUE FOR RETAIL, BY REGION, 2018–2026 ($MILLION)
TABLE 20.    U.S. ENTERPRISE AGILE TRANSFORMATION SERVICES MARKET REVENUE FOR MEDIA & ENTERTAINMENT, BY REGION, 2018–2026 ($MILLION)
TABLE 21.    U.S. ENTERPRISE AGILE TRANSFORMATION SERVICES MARKET REVENUE FOR GOVERNMENT & PUBLIC SECTOR, BY REGION, 2018–2026 ($MILLION)
TABLE 22.    U.S. ENTERPRISE AGILE TRANSFORMATION SERVICES MARKET REVENUE FOR MANUFACTURING, BY REGION, 2018–2026 ($MILLION)
TABLE 23.    U.S. ENTERPRISE AGILE TRANSFORMATION SERVICES MARKET REVENUE FOR HEALTHCARE, BY REGION, 2018–2026 ($MILLION)
TABLE 24.    U.S. ENTERPRISE AGILE TRANSFORMATION SERVICES MARKET REVENUE FOR OTHERS, BY REGION, 2018–2026 ($MILLION)
TABLE 25.    U.S. ENTERPRISE AGILE TRANSFORMATION SERVICES MARKET REVENUE, BY REGION, 2018–2026 ($MILLION)
TABLE 26.    WESTERN U.S. ENTERPRISE AGILE TRANSFORMATION SERVICES MARKET REVENUE, BY METHODOLOGY, 2018–2026 ($MILLION)
TABLE 27.    WESTERN U.S. ENTERPRISE AGILE TRANSFORMATION SERVICES MARKET REVENUE, BY SERVICE TYPE, 2018–2026 ($MILLION)
TABLE 28.    WESTERN U.S. ENTERPRISE AGILE TRANSFORMATION SERVICES MARKET REVENUE, BY ORGANIZATION SIZE, 2018–2026 ($MILLION)
TABLE 29.    WESTERN U.S. ENTERPRISE AGILE TRANSFORMATION SERVICES MARKET REVENUE, BY INDUSTRY VERTICAL, 2018–2026 ($MILLION)
TABLE 30.    SOUTHEASTERN U.S. ENTERPRISE AGILE TRANSFORMATION SERVICES MARKET REVENUE, BY METHODOLOGY, 2018–2026 ($MILLION)
TABLE 31.    SOUTHEASTERN U.S. ENTERPRISE AGILE TRANSFORMATION SERVICES MARKET REVENUE, BY SERVICE TYPE, 2018–2026 ($MILLION)
TABLE 32.    SOUTHEASTERN U.S. ENTERPRISE AGILE TRANSFORMATION SERVICES MARKET REVENUE, BY ORGANIZATION SIZE, 2018–2026 ($MILLION)
TABLE 33.    SOUTHEASTERN U.S. ENTERPRISE AGILE TRANSFORMATION SERVICES MARKET REVENUE, BY INDUSTRY VERTICAL, 2018–2026 ($MILLION)
TABLE 34.    SOUTHWESTERN U.S. ENTERPRISE AGILE TRANSFORMATION SERVICES MARKET REVENUE, BY METHODOLOGY, 2018–2026 ($MILLION)
TABLE 35.    SOUTHWESTERN U.S. ENTERPRISE AGILE TRANSFORMATION SERVICES MARKET REVENUE, BY SERVICE TYPE, 2018–2026 ($MILLION)
TABLE 36.    SOUTHWESTERN U.S. ENTERPRISE AGILE TRANSFORMATION SERVICES MARKET REVENUE, BY ORGANIZATION SIZE, 2018–2026 ($MILLION)
TABLE 37.    SOUTHWESTERN U.S. ENTERPRISE AGILE TRANSFORMATION SERVICES MARKET REVENUE, BY INDUSTRY VERTICAL, 2018–2026 ($MILLION)
TABLE 38.    NORTHEASTERN U.S. ENTERPRISE AGILE TRANSFORMATION SERVICES MARKET REVENUE, BY METHODOLOGY, 2018–2026 ($MILLION)
TABLE 39.    NORTHEASTERN U.S. ENTERPRISE AGILE TRANSFORMATION SERVICES MARKET REVENUE, BY SERVICE TYPE, 2018–2026 ($MILLION)
TABLE 40.    NORTHEASTERN U.S. ENTERPRISE AGILE TRANSFORMATION SERVICES MARKET REVENUE, BY ORGANIZATION SIZE, 2018–2026 ($MILLION)
TABLE 41.    NORTHEASTERN U.S. ENTERPRISE AGILE TRANSFORMATION SERVICES MARKET REVENUE, BY INDUSTRY VERTICAL, 2018–2026 ($MILLION)
TABLE 42.    MIDWESTERN U.S. ENTERPRISE AGILE TRANSFORMATION SERVICES MARKET REVENUE, BY METHODOLOGY, 2018–2026 ($MILLION)
TABLE 43.    MIDWESTERN U.S. ENTERPRISE AGILE TRANSFORMATION SERVICES MARKET REVENUE, BY SERVICE TYPE, 2018–2026 ($MILLION)
TABLE 44.    MIDWESTERN U.S. ENTERPRISE AGILE TRANSFORMATION SERVICES MARKET REVENUE, BY ORGANIZATION SIZE, 2018–2026 ($MILLION)
TABLE 45.    MIDWESTERN U.S. ENTERPRISE AGILE TRANSFORMATION SERVICES MARKET REVENUE, BY INDUSTRY VERTICAL, 2018–2026 ($MILLION)
TABLE 46.    ACCENTURE PLC: KEY EXECUTIVES
TABLE 47.    ACCENTURE PLC: COMPANY SNAPSHOT
TABLE 48.    ACCENTURE PLC: OPERATING SEGMENTS
TABLE 49.    ACCENTURE PLC: PRODUCT PORTFOLIO
TABLE 50.    AGILESPARKS: KEY EXECUTIVES
TABLE 51.    AGILESPARKS: COMPANY SNAPSHOT
TABLE 52.    AGILESPARKS: PRODUCT PORTFOLIO
TABLE 53.    BROADCOM INC.: KEY EXECUTIVES
TABLE 54.    BROADCOM INC.: COMPANY SNAPSHOT
TABLE 55.    BROADCOM INC.: OPERATING SEGMENTS
TABLE 56.    BROADCOM INC.: PRODUCT PORTFOLIO
TABLE 57.    ENDAVA PLC: KEY EXECUTIVES
TABLE 58.    ENDAVA PLC: COMPANY SNAPSHOT
TABLE 59.    ENDAVA PLC: PRODUCT PORTFOLIO
TABLE 60.    HEXAWARE TECHNOLOGIES LIMITED: KEY EXECUTIVES
TABLE 61.    HEXAWARE TECHNOLOGIES LIMITED: COMPANY SNAPSHOT
TABLE 62.    HEXAWARE TECHNOLOGIES LIMITED: PRODUCT PORTFOLIO
TABLE 63.    INTERNATIONAL BUSINESS MACHINES CORPORATION: KEY EXECUTIVES
TABLE 64.    INTERNATIONAL BUSINESS MACHINES CORPORATION: COMPANY SNAPSHOT
TABLE 65.    INTERNATIONAL BUSINESS MACHINES CORPORATION: OPERATING SEGMENTS
TABLE 66.    INTERNATIONAL BUSINESS MACHINES CORPORATION: PRODUCT PORTFOLIO
TABLE 67.    LEADINGAGILE: KEY EXECUTIVES
TABLE 68.    LEADINGAGILE: COMPANY SNAPSHOT
TABLE 69.    LEADINGAGILE: PRODUCT PORTFOLIO
TABLE 70.    SYMPHONY SOLUTIONS: KEY EXECUTIVES
TABLE 71.    SYMPHONY SOLUTIONS: COMPANY SNAPSHOT
TABLE 72.    SYMPHONY SOLUTIONS: PRODUCT PORTFOLIO
TABLE 73.    XEBIA GROUP: KEY EXECUTIVES
TABLE 74.    XEBIA GROUP: COMPANY SNAPSHOT
TABLE 75.    XEBIA GROUP: PRODUCT PORTFOLIO
TABLE 76.    COGNIZANT TECHNOLOGY SOLUTIONS CORPORATION: KEY EXECUTIVES
TABLE 77.    COGNIZANT TECHNOLOGY SOLUTIONS CORPORATION: COMPANY SNAPSHOT
TABLE 78.    COGNIZANT TECHNOLOGY SOLUTIONS CORPORATION: OPERATING SEGMENTS
TABLE 79.    COGNIZANT TECHNOLOGY SOLUTIONS CORPORATION: PRODUCT PORTFOLIO

LIST OF FIGURES

FIGURE 01.    KEY MARKET SEGMENTS
FIGURE 02.    U.S. ENTERPRISE AGILE TRANSFORMATION SERVICES MARKET, 2018–2026
FIGURE 03.    TOP IMPACTING FACTORS
FIGURE 04.    TOP INVESTMENT POCKETS
FIGURE 05.    TOP WINNING STRATEGIES, BY YEAR, 2016-2019*
FIGURE 06.    TOP WINNING STRATEGIES, BY DEVELOPMENT, 2016-2019*
FIGURE 07.    TOP WINNING STRATEGIES, BY COMPANY, 2016-2019*
FIGURE 08.    MODERATE-TO-HIGH BARGAINING POWER OF SUPPLIERS
FIGURE 09.    MODERATE BARGAINING POWER OF BUYERS
FIGURE 10.    MODERATE THREAT OF SUBSTITUTES
FIGURE 11.    MODERATE THREAT OF NEW ENTRANTS
FIGURE 12.    MODERATE-TO-HIGH COMPETITIVE RIVALRY
FIGURE 13.    KEY PLAYER POSITIONING, 2018
FIGURE 14.    U.S. ENTERPRISE AGILE TRANSFORMATION SERVICES MARKET REVENUE, BY METHODOLOGY, 2018–2026 ($MILLION)
FIGURE 15.    U.S. ENTERPRISE AGILE TRANSFORMATION SERVICES MARKET REVENUE, BY SERVICE TYPE, 2018–2026 ($MILLION)
FIGURE 16.    U.S. ENTERPRISE AGILE TRANSFORMATION SERVICES MARKET REVENUE, BY ORGANIZATION SIZE, 2018–2026 ($MILLION)
FIGURE 17.    U.S. ENTERPRISE AGILE TRANSFORMATION SERVICES MARKET REVENUE, BY INDUSTRY VERTICAL, 2018–2026 ($MILLION)
FIGURE 18.    WESTERN U.S. AGILE TRANSFORMATION SERVICES MARKET, 2018-2026 ($MILLION)
FIGURE 19.    SOUTHEASTERN U.S. AGILE TRANSFORMATION SERVICES MARKET, 2018-2026 ($MILLION)
FIGURE 20.    SOUTHEWESTERN U.S. AGILE TRANSFORMATION SERVICES MARKET, 2018-2026 ($MILLION)
FIGURE 21.    NORTHEASTERN U.S. AGILE TRANSFORMATION SERVICES MARKET, 2018-2026 ($MILLION)
FIGURE 22.    MIDWESTERN U.S. AGILE TRANSFORMATION SERVICES MARKET, 2018-2026 ($MILLION)
FIGURE 23.    ACCENTURE PLC: REVENUE, 2016–2018 ($MILLION)
FIGURE 24.    ACCENTURE PLC: REVENUE SHARE BY SEGMENT, 2018 (%)
FIGURE 25.    ACCENTURE PLC: REVENUE SHARE BY REGION, 2018 (%)
FIGURE 26.    R&D EXPENDITURE, 2016–2018 ($MILLION)
FIGURE 27.    BROADCOM INC.: REVENUE, 2016–2018 ($MILLION)
FIGURE 28.    BROADCOM INC.: REVENUE SHARE BY SEGMENT, 2018 (%)
FIGURE 29.    BROADCOM INC.: REVENUE SHARE BY REGION, 2018 (%)
FIGURE 30.    ENDAVA PLC: REVENUE, 2016–2018 ($MILLION)
FIGURE 31.    ENDAVA PLC: REVENUE SHARE BY REGION, 2018 (%)
FIGURE 32.    HEXAWARE TECHNOLOGIES LIMITED: REVENUE, 2016-2018 ($MILLION)
FIGURE 33.    HEXAWARE TECHNOLOGIES LIMITED: REVENUE SHARE BY SEGMENT, 2018 (%)
FIGURE 34.    HEXAWARE TECHNOLOGIES LIMITED: REVENUE SHARE BY REGION, 2018 (%)
FIGURE 35.    R&D EXPENDITURE, 2016–2017 ($MILLION)
FIGURE 36.    INTERNATIONAL BUSINESS MACHINES CORPORATION: REVENUE, 2016–2018 ($MILLION)
FIGURE 37.    INTERNATIONAL BUSINESS MACHINES CORPORATION: REVENUE SHARE BY SEGMENT, 2018 (%)
FIGURE 38.    INTERNATIONAL BUSINESS MACHINES CORPORATION: REVENUE SHARE BY REGION, 2018 (%)
FIGURE 39.    COGNIZANT TECHNOLOGY SOLUTIONS CORPORATION: REVENUE, 2016–2018 ($MILLION)
FIGURE 40.    COGNIZANT TECHNOLOGY SOLUTIONS CORPORATION: REVENUE SHARE BY SEGMENT, 2018 (%)
FIGURE 41.    COGNIZANT TECHNOLOGY SOLUTIONS CORPORATION: REVENUE SHARE BY REGION, 2018 (%)


Agile transformation services have witnessed a significant increase in adoption among businesses to tackle the challenges associated with high competition and market disruption threats. These services help organizations to enable and implement delivery functions to foster engagement and collaboration. Agile transformation aids to create more collaborative, open, creative, and efficient business environment as compared to traditional business models. Moreover, several benefits are associated with agile transformation such as reduced costs, high product quality, higher levels of customer satisfaction & success, shortened time-to-market, more flexibility in project management, and faster feedback & ROI, which drive the adoption of these services across various industries. In addition, significant demand for rapid product development, constant changes in business needs, and need for improved & enhanced communication among teams contribute toward the market growth. However, high failure rate in large organizations, owing to several factors such as organization challenges, is the key factor that majorly hinders the growth of the market.

The U.S. enterprise agile transformations services market is consolidated with the presence of key vendors such as Cognizant, IBM Corporation, Accenture, and others, which constitute a large share. Western U.S. and Northeastern U.S. are the major shareholders of the U.S. enterprise agile transformations services market, owing to significant adoption of agile approaches among their well-established business industries. Some of the key players profiled in the report include Accenture Plc., Agile Sparks Broadcom Inc., Endava Plc., Hexaware Technologies Limited, International Business Machines Corporation, LeadingAgile, Symphony Solutions, Xebia Group, and Cognizant Technology Solutions Corporation.
 

PURCHASE OPTIONS

Call or Email us

U.S.-Canada Toll-free: +1-800-792-5285
Int'l : +1-503-894-6022
Europe : +44-845-528-1300
Email : help@alliedmarketresearch.com

Looking for Customization?

 Customization Request

Have a Question?

 Speak with Analyst

Any Confusion?

 Inquire Before Buying

Have a glance of the Report

  Request Sample
RELATED TAGS

Purchase Full Report of
U.s. Enterprise Agile Transformation Services Market

Start reading instantly.
This Report and over 68,439+ more Reports, Available with Avenue Library. T&C*.

  • Data Pack
  • $2,324
  • Restricted to one authorized user
  • One print only
  • Available in
    Excel
  • Free industry update
    (Within 180 days)
  •   Free report update in next update cycle
    (Jul 2020 - Jul 2021)
  • Single User
  • $3,250
  • Restricted to one authorized user
  • One print only
  • Available in
    PDF
  • Free industry update
    (Within 180 days)
  •   Free report update in next update cycle
    (Jul 2020 - Jul 2021)
  • Five Users
  • $3,904
  • Limited to five authorized users
  • Print upto five copies
  • Available in
    PDF
  • Free industry update
    (Within 180 days)
  •   Free report update in next update cycle
    (Jul 2020 - Jul 2021)
  • Enterprise
    License/PDF

  • $6,444
  • Unlimited
    within
    company/enterprise
  • Available in Excel & PDF
  • Free industry update
    (Within 180 days)
  •   Free report update in next update cycle
    (Jul 2020 - Jul 2021)
  • Library
    Membership

  • $999 $ 1,175
    Per User/ Per month/ Billed annually
  • Published Content
    E-access
  • Company Profiles
    E-access
  • Newly Added Content Access
  • 10 PDF
    Downloads
  • 5 Excel Data
    Pack Downloads
  • 250 Company Profiles PDF Downloads
  • Buy Now

*Taxes/Fees, if applicable will be added during checkout. All prices in USD

RELATED REPORTS
 

Why Allied Market Research?


Infallible Methodology

To ensure high-level data integrity, accurate analysis, and impeccable forecasts

Analyst Support

For complete satisfaction

Customization

On-demand customization of scope of the report to exactly meet your needs

TARGETED MARKET VIEW

Targeted market view to provide pertinent information and save time of readers

Get fresh content delivered

Get insights on topics that are crucial for your business. Stay abreast of your interest areas.

Get Industry Data Alerts

Why Allied Market Research?

Infallible Methodology

To ensure high-level data integrity, accurate analysis, and impeccable forecasts

Analyst Support

For complete satisfaction

Customization

On-demand customization of scope of the report to exactly meet your needs

TARGETED MARKET VIEW

Targeted market view to provide pertinent information and save time of readers