✷ Report Code: A04887 | Mar 2022 | Pages: 160 | ||
Tables: 146 | Charts: 64 |
|
Pandemic disrupted the entire world and affected many industries.
Get detailed COVID-19 impact analysis on the U.s. Large Screen Display Market
Request Now !
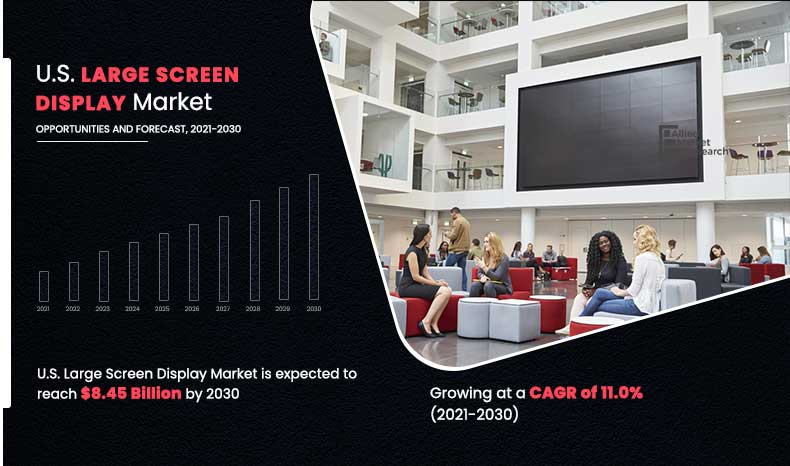
The U.S. large screen display market size was valued at $2.91 billion in 2020, and is projected to reach $8.45 billion by 2030, registering a CAGR of 11.0% from 2021 to 2030. Large screen displays are a class of large display screen formats, which improve the visual experience with its professional-grade image quality and are mostly used for endorsing and advertising. These displays have replaced the traditional small and micro-display screens with large wall-sized LED and LCD displays, used across various industries. They are designed for applications that require the vendors to engage their customers/audiences with its wider viewing angle and to extract maximum effectiveness from the marketing messages. In addition, these displays ensure higher durability and enhanced performance as against traditional display screens. Large screen displays are mostly suited for retail store, lobby, control room, or other professional application.
Â
The retail and education segment has been negatively impacted by the COVID-19 pandemic outbreak.
In the current business scenario, it is crucial to employ efficient systems for advertising, owing to the development of numerous user engagement devices and applications. Large screen displays are a cost-effective medium of promoting and branding any product or service; this advantage drives the U.S. large screen display market growth.
In addition, these displays provide high wavelength uniformity for fine pixel pitch displays. Further, they consume less power and deliver increased brightness, ultrahigh definition picture quality, improved color saturation, and faster response rate as compared to small OLEDs and LCDs, and thus, are suited for both indoor and outdoor displays.
Rise in demand for bright and power-efficient display panels and rapid digitalization and decline in demand for traditional billboards are the factors that drive the growth of the U.S. large screen display market. However, deployment of widescreen alternatives such as projectors and screenless displays, hampers the market growth to a certain extent. Furthermore, emerging display technology such as MicroLED and quantum dots and increase in preference of electronic giants toward large-screen displays offer lucrative opportunities for the U.S. large screen display market.Â
The U.S. large screen display market is segmented on the basis of screen size, application, product, location, end user, and region. By screen size, the market is classified into 80 Inch to 99 Inch, 100 inch to 149-inch, 150 inch to 199-inch, 200 inch to 300 inch, and above 300-inch segments. In 2020, the 80 Inch to 99 Inch segment secured highest revenue share and is expected to follow same trend during forecast period. Based on application, the market is divided into B to B and B to C applications, among which B to B segment is expected to dominate the U.S. large screen display market share.Â
By product, the U.S. large screen display market is categorized into single screen, video wall and projector. Based on location, it is segregated into indoor and outdoor. Â By end user, it is categorized into retail, education, healthcare, corporate, stadiums, media & entertainment, government, and others. On the basis of region, it is analyzed across North America, Europe, Asia-Pacific, and LAMEA. The corporate segment was the highest contributor to the market in 2020, owing to increase in adoption of large screen displays in conference rooms, cafeterias, and work floors help engage their employees, visitors, and create good environment.Â
The notable factors positively affecting the U.S. Large Screen Display Market include rise in demand for bright and power-efficient display panels, rapid digitalization, and decline in demand for traditional billboards. However, deployment of widescreen alternatives such as projectors and screenless displays, is expected to hinder the market growth. Moreover, emerging display technologies such as MicroLED & quantum dots and increase in preference of electronic giants toward large screen displays are expected to offer huge market opportunities in the coming years. Each of these factors is anticipated to have a definite impact on the U.S. large screen display market during the forecast period. Â
Â
The key players profiled in the U.S. large screen display market report include iSEMC, Koninklijke Philips N.V., LG Electronics Inc., NEC Corporation, Panasonic Corporation, Planar Systems, Samsung Electronics Co. Ltd., Sony Corporation, ViewSonic Corporation, and Volanti Displays. These key players have adopted strategies, such as product portfolio expansion, mergers & acquisitions, agreements, geographical expansion, and collaborations to enhance their position in the U.S. large screen display industry. In 2019, Planer Systems launched 100-inch 4K LCD display with Ultra HD resolution (3840 x 2160), which offers high brightness of 700 nits and wide color gamut for stunning image quality and deep, rich color reproduction.
The global outbreak of COVID-19 has significantly affected the growth of the U.S. large screen display market in 2020, and the market is estimated to witness relatively slow growth till the end of 2021. Further, the global selling market was primarily hit by several obstacles due to COVID-19 in the manufacturing and selling industries such as lack of availability of raw material and skill workforce, contractual obligations, and project delays or cancellations. Furthermore, the negative impact on outdoor advertisement solution in 2020 decreased the demand for large screen displays from commercial sector. However, rise in demand for VR gaming solutions is expected to witness relatively high growth by the end of 2021.
Â
Key Benefits For Stakeholders
U.S. Large Screen Display Market Report Highlights
Aspects | Details |
---|---|
By Screen Size |
|
By Application |
|
By Product |
|
By Location |
|
By End User |
|
By Region |
|
By Key Market Players |
|
Chapter 1:Introduction
1.1.Report description
1.2.Key benefits for stakeholders
1.3.Key market segments
1.4.AMR research methodology
1.5.Data collection process
1.5.1.Secondary sources
1.5.2.Primary research
1.5.3.Data Triangulation and computation tools & models
1.5.4.Data modelling
1.5.4.1.US Large Screen Display Market – Data Modelling Approach
1.5.5.Scope
1.5.6.Assumptions
1.5.7.Limitation
1.5.8.Sources referred but not limited to –
Chapter 2:Executive summary
2.1.CXO perspective
Chapter 3:MARKET OVERVIEW
3.1.Market definition and scope
3.2.Key findings
3.2.1.Top impacting factors
3.2.2.Top investment pockets
3.2.3.Top winning strategies
3.3.Porter’s five forces analysis
3.4.Market dynamics
3.4.1.Drivers
3.4.1.1.Rise in demand for bright and power-efficient display panels
3.4.1.2.Rapid digitalization and decline in demand for traditional billboards
3.4.2.Restraint
3.4.2.1.Deployment of widescreen alternatives such as projectors and screenless displays
3.4.3.Opportunities
3.4.3.1.Emerging display technology such as micro LED and quantum dots
3.4.3.2.Increase in preference of electronic giants towards large-screen displays
Chapter 4:U.S. LARGE SCREEN DISPLAY MARKet, BY SCREEN SIZE
4.1.Overview
4.1.1.Market size and forecast
4.2.80 Inch to 99 Inch
4.2.1.Overview
4.2.2.Key market trends, growth factors and opportunities
4.2.3.Market size and forecast
4.3.100 Inch to 149 Inch
4.3.1.Overview
4.3.2.Key market trends, growth factors and opportunities
4.3.3.Market size and forecast
4.4.150 Inch to 199 Inch
4.4.1.Key market trends, growth factors, and opportunities
4.4.2.Market size and forecast
4.5.200 Inch to 300 Inch
4.5.1.Key market trends, growth factors, and opportunities
4.5.2.Market size and forecast
4.6.Above 300 Inch
4.6.1.Key market trends, growth factors, and opportunities
4.6.2.Market size and forecast
Chapter 5:U.S. LARGE SCREEN DISPLAY MARKet, BY APPLICATION
5.1.Overview
5.1.1.Market size and forecast
5.2.B to B
5.2.1.Overview
5.2.2.Market size and forecast
5.2.2.1.Command & control
5.2.2.1.1.Key market trends, growth factors, and opportunities
5.2.2.2.Conferencing & collaboration
5.2.2.3.Digital signage
5.2.2.3.1.Key market trends, growth factors, and opportunities
5.3.B to C
5.3.1.Overview
5.3.2.Market size and forecast
Chapter 6:U.S. LARGE SCREEN DISPLAY MARKet, BY location
6.1.Overview
6.1.1.Market size and forecast
6.2.Indoor
6.2.1.Overview
6.2.2.Key market trends, growth factors and opportunities
6.2.3.Market size and forecast
6.2.3.1.Boardroom
6.2.3.2.Conference room
6.2.3.3.Office entrance:
6.2.3.4.Classroom
6.2.3.5.Park
6.2.3.6.Others
6.3.Outdoor
6.3.1.Key market trends, growth factors and opportunities
6.3.2.Market size and forecast
6.3.2.1.Industrial
6.3.2.2.Commercial
Chapter 7:U.S. LARGE SCREEN DISPLAY MARKet, BY product
7.1.Overview
7.1.1.Market size and forecast
7.2.Single screen
7.2.1.Key market trends, growth factors and opportunities
7.2.2.Market size and forecast
7.2.2.1.LED
7.2.2.2.OLED
7.3.Video wall
7.3.1.Market size and forecast
7.3.1.1.LCD
7.3.1.2.MicroLED
7.4.Projector
7.4.1.Market size and forecast
Chapter 8:U.S. LARGE SCREEN DISPLAY MARKet, BY end user
8.1.Overview
8.1.1.Market size and forecast
8.2.Retail
8.2.1.Key market trends, growth factors and opportunities
8.2.2.Market size and forecast
8.3.Education
8.3.1.Key market trends, growth factors and opportunities
8.3.2.Market size and forecast
8.4.Healthcare
8.4.1.Key market trends, growth factors and opportunities
8.4.2.Market size and forecast
8.5.Corporate
8.5.1.Key market trends, growth factors and opportunities
8.5.2.Market size and forecast
8.6.Stadiums
8.6.1.Market size and forecast
8.7.Media and entertainment.
8.7.1.Key market trends, growth factors and opportunities
8.7.2.Market size and forecast
8.8.Government
8.8.1.Market size and forecast
8.9.Others
8.9.1.Market size and forecast
Chapter 9:Company profiles
9.1.ISEMC (HHSD TECHNOLOGY)
9.1.1.Company overview
9.1.2.Key Executives
9.1.3.Company snapshot
9.1.4.Product portfolio
9.1.5.Key strategic moves and developments
9.2.KONINKLIJKE PHILIPS N.V.
9.2.1.Company overview
9.2.2.Key Executives
9.2.3.Company snapshot
9.2.4.Operating business segments
9.2.5.Product portfolio
9.2.6.R&D Expenditure
9.2.7.Business performance
9.3.LG ELECTRONICS INC.
9.3.1.Company overview
9.3.2.Key Executives
9.3.3.Company snapshot
9.3.4.Operating business segments
9.3.5.Product portfolio
9.3.6.R&D Expenditure
9.3.7.Business performance
9.4.NEC CORPORATION
9.4.1.Company overview
9.4.2.Key Executives
9.4.3.Company snapshot
9.4.4.Operating business segments
9.4.5.Product portfolio
9.4.6.Business performance
9.4.7.Key strategic moves and developments
9.5.PANASONIC CORPORATION.
9.5.1.Company overview
9.5.2.Key Executives
9.5.3.Company snapshot
9.5.4.Operating business segments
9.5.5.Product portfolio
9.5.6.R&D Expenditure
9.5.7.Business performance
9.6.PLANAR SYSTEMS.
9.6.1.Company overview
9.6.2.Key Executives
9.6.3.Company snapshot
9.6.4.Product portfolio
9.6.5.Key strategic moves and developments
9.7.SAMSUNG ELECTRONICS CO. LTD.
9.7.1.Company overview
9.7.2.Key Executives
9.7.3.Company snapshot
9.7.4.Operating business segments
9.7.5.Product portfolio
9.7.6.R&D Expenditure
9.7.7.Business performance
9.7.8.Key strategic moves and developments
9.8.SONY CORPORATION
9.8.1.Company overview
9.8.2.Key Executives
9.8.3.Company snapshot
9.8.4.Operating business segments
9.8.5.Product portfolio
9.8.6.R&D Expenditure
9.8.7.Business performance
9.8.8.Key strategic moves and developments
9.9.VIEWSONIC CORPORATION
9.9.1.Company overview
9.9.2.Key executives
9.9.3.Company snapshot.
9.9.4.Product portfolio
9.10.VOLANTI DISPLAYS
9.10.1.Company overview
9.10.2.Key executives
9.10.3.Company snapshot
9.10.4.Product portfolio
LIST OF TABLES
TABLE 01.U.S. LAGE SCREEN DISPLAY MARKET REVENUE, BY SCREEN SIZE, 2020-2030 ($MILLION)
TABLE 02.U.S. LAGE SCREEN DISPLAY MARKET REVENUE, BY APPLICATION, 2020-2030 ($MILLION)
TABLE 03.U.S. LAGE SCREEN DISPLAY MARKET REVENUE, BY LOCATION, 2020-2030 ($MILLION)
TABLE 04.U.S. LAGE SCREEN DISPLAY MARKET REVENUE, BY PRODUCT, 2020-2030 ($MILLION)
TABLE 05.U.S. LAGE SCREEN DISPLAY MARKET REVENUE, BY END USER, 2020-2030 ($MILLION)
TABLE 06.ISEMC:KEY EXECUTIVES
TABLE 07.ISEMC: COMPANY SNAPSHOT
TABLE 08.ISEMC: PRODUCT PORTFOLIO
TABLE 09.ISEMC: KEY STRATEGIC MOVES AND DEVELOPMENTS
TABLE 10.KONINKLIJKE PHILIPS N.V..:KEY EXECUTIVES
TABLE 11.KONINKLIJKE PHILIPS N.V..: COMPANY SNAPSHOT
TABLE 12.KONINKLIJKE PHILIPS N.V.: OPERATING SEGMENTS
TABLE 13.KONINKLIJKE PHILIPS N.V.: PRODUCT PORTFOLIO
TABLE 14.LG ELECTRONICS INC.:KEY EXECUTIVES
TABLE 15.LG ELECTRONICS INC.: COMPANY SNAPSHOT
TABLE 16.LG ELECTRONICS INC.: OPERATING SEGMENTS
TABLE 17.LG ELECTRONICS INC.: PRODUCT PORTFOLIO
TABLE 18.NEC CORPORATION: KEY EXECUTIVES
TABLE 19.NEC CORPORATION: COMPANY SNAPSHOT
TABLE 20.NEC CORPORATION: OPERATING SEGMENTS
TABLE 21.NEC CORPORATION: PRODUCT PORTFOLIO
TABLE 22.NEC CORPORATION: KEY STRATEGIC MOVES AND DEVELOPMENTS
TABLE 23.PANASONIC CORPORATION: KEY EXECUTIVES
TABLE 24.PANASONIC CORPORATION: COMPANY SNAPSHOT
TABLE 25.PANASONIC CORPORATION: OPERATING SEGMENTS
TABLE 26.PANASONIC CORPORATION: PRODUCT PORTFOLIO
TABLE 27.PLANAR SYSTEMS:KEY EXECUTIVES
TABLE 28.PLANAR SYSTEMS: COMPANY SNAPSHOT
TABLE 29.PLANAR SYSTEMS: PRODUCT PORTFOLIO
TABLE 30.PLANAR SYSTEMS: KEY STRATEGIC MOVES AND DEVELOPMENTS
TABLE 31.SAMSUNG ELECTRONICS CO. LTD.:KEY EXECUTIVES
TABLE 32.SAMSUNG ELECTRONICS CO. LTD.: COMPANY SNAPSHOT
TABLE 33.SAMSUNG ELECTRONICS CO. LTD.: OPERATING SEGMENTS
TABLE 34.SAMSUNG ELECTRONICS CO. LTD.: PRODUCT PORTFOLIO
TABLE 35.SAMSUNG ELECTRONICS CO. LTD: KEY STRATEGIC MOVES AND DEVELOPMENTS
TABLE 36.SONY CORPORATION:KEY EXECUTIVES
TABLE 37.SONY CORPORATION: COMPANY SNAPSHOT
TABLE 38.SONY CORPORATION: OPERATING SEGMENTS
TABLE 39.SONY CORPORATION: PRODUCT PORTFOLIO
TABLE 40.SONY CORPORATION: KEY STRATEGIC MOVES AND DEVELOPMENTS
TABLE 41.VIEWSONIC CORPORATION:KEY EXECUTIVES
TABLE 42.VIEWSONIC CORPORATION: COMPANY SNAPSHOT
TABLE 43.VIEWSONIC CORPORATION: PRODUCT PORTFOLIO
TABLE 44.VOLANTI DISPLAYS:KEY EXECUTIVES
TABLE 45.VOLANTI DISPLAYS: COMPANY SNAPSHOT
TABLE 46.VOLANTI DISPLAYS: PRODUCT PORTFOLIO
LIST OF FIGURES
FIGURE 01.AMR’S RESEARCH WORKFLOW
FIGURE 02.DATA COLLECTION PROCESS
FIGURE 03.SECONDARY DATA EVALUATION
FIGURE 04.SECONDARY DATA SOURCES
FIGURE 05.DATA TRIANGULATION OVERVIEW
FIGURE 06.EXECUTIVE SUMMARY
FIGURE 07.TOP IMPACTING FACTORS
FIGURE 08.TOP INVESTMENT POCKETS
FIGURE 09.TOP WINNING STRATEGIES, BY YEAR, 2016–2019*
FIGURE 10.TOP WINNING STRATEGIES, BY YEAR, 2016–2019*
FIGURE 11.TOP WINNING STRATEGIES, BY COMPANY, 2016–2019*
FIGURE 12.MODERATE-TO-HIGH BARGAINING POWER OF SUPPLIERS
FIGURE 13.MODERATE-TO-HIGH THREAT OF NEW ENTRANTS
FIGURE 14.MODERATE THREAT OF SUBSTITUTES
FIGURE 15.HIGH-TO-MODERATE INTENSITY OF RIVALRY
FIGURE 16.HIGH-TO-MODERATE BARGAINING POWER OF BUYERS
FIGURE 17.U.S. LARGE SCREEN DISPLAY MARKET SHARE, BY SCREEN SIZE, 2021–2030 (%)
FIGURE 18.U.S. LAGE SCREEN DISPLAY MARKET REVENUE FOR 80 INCH TO 100 INCH SCREEN, 2020-2030 ($MILLION)
FIGURE 19.U.S. LAGE SCREEN DISPLAY MARKET REVENUE FOR 100 INCH TO 149 INCH SCREEN, 2020-2030 ($MILLION)
FIGURE 20.U.S. LAGE SCREEN DISPLAY MARKET REVENUE FOR 150 INCH TO 199 INCH SCREEN, 2020-2030 ($MILLION)
FIGURE 21.U.S. LAGE SCREEN DISPLAY MARKET REVENUE FOR 200 INCH TO 300 INCH SCREEN, 2020-2030 ($MILLION)
FIGURE 22.U.S. LAGE SCREEN DISPLAY MARKET REVENUE FOR ABOVE 300 INCH SCREEN, 2020-2030 ($MILLION)
FIGURE 23.U.S. LARGE SCREEN DISPLAY MARKET SHARE, BY APPLICATION, 2021–2030 (%)
FIGURE 24.U.S. LAGE SCREEN DISPLAY MARKET REVENUE FOR B TO B APPLICATIONS, 2020-2030 ($MILLION)
FIGURE 25.U.S. LARGE SCREEN DISPLAY MARKET REVENUE FOR B TO C APPLICATIONS, 2020-2030 ($MILLION)
FIGURE 26.U.S. LARGE SCREEN DISPLAY MARKET SHARE, BY LOCATION, 2021–2030 (%)
FIGURE 27.U.S. LAGE SCREEN DISPLAY MARKET REVENUE FOR INDOOR, 2020-2030 ($MILLION)
FIGURE 28.U.S. LAGE SCREEN DISPLAY MARKET REVENUE FOR OUTDOOR, 2020-2030 ($MILLION)
FIGURE 29.U.S. LARGE SCREEN DISPLAY MARKET SHARE, BY PRODUCT, 2021–2030 (%)
FIGURE 30.U.S. LAGE SCREEN DISPLAY MARKET REVENUE FOR SINGLE SCREEN, 2020-2030 ($MILLION)
FIGURE 31.U.S. LAGE SCREEN DISPLAY MARKET REVENUE FOR VIDEO WALL, 2020-2030($MILLION)
FIGURE 32.U.S. LAGE SCREEN DISPLAY MARKET REVENUE FOR PROJECTOR, 2020-2030 ($MILLION)
FIGURE 33.U.S. LARGE SCREEN DISPLAY MARKET SHARE, BY END USER, 2021–2030 (%)
FIGURE 34.U.S. LAGE SCREEN DISPLAY MARKET REVENUE FOR RETAIL, 2020-2030 ($MILLION)
FIGURE 35.U.S. LAGE SCREEN DISPLAY MARKET REVENUE FOR EDUCATION, 2020-2030($MILLION)
FIGURE 36.U.S. LAGE SCREEN DISPLAY MARKET REVENUE FOR HEALTHCARE, 2020-2030 ($MILLION)
FIGURE 37.U.S. LAGE SCREEN DISPLAY MARKET REVENUE FOR CORPORATE, 2020-2030 ($MILLION)
FIGURE 38.U.S. LAGE SCREEN DISPLAY MARKET REVENUE FOR STADIUMS, 2020-2030 ($MILLION)
FIGURE 39.U.S. LAGE SCREEN DISPLAY MARKET REVENUE FOR MEDIA AND ENTERTAINMENT, 2020-2030 ($MILLION)
FIGURE 40.U.S. LAGE SCREEN DISPLAY MARKET REVENUE FOR GOVERNMENT, 2020-2030 ($MILLION)
FIGURE 41.U.S. LAGE SCREEN DISPLAY MARKET REVENUE FOR OTHERS, 2020-2030 ($MILLION)
FIGURE 42.KONINKLIJKE PHILIPS N.V., 2018–2020 ($MILLION)
FIGURE 43.KONINKLIJKE PHILIPS N.V.: REVENUE, 2018–2020 ($MILLION)
FIGURE 44.KONINKLIJKE PHILIPS N.V.: REVENUE SHARE BY SEGMENT, 2020 (%)
FIGURE 45.KONINKLIJKE PHILIPS N.V.: REVENUE SHARE BY REGION, 2020 (%)
FIGURE 46.LG ELECTRONICS INC., 2018–2020 ($MILLION)
FIGURE 47.LG ELECTRONICS INC.: REVENUE, 2018–2020 ($MILLION)
FIGURE 48.LG ELECTRONICS INC.: REVENUE SHARE BY SEGMENT, 2020 (%)
FIGURE 49.LG ELECTRONICS INC.: REVENUE SHARE BY REGION, 2020 (%)
FIGURE 50.NEC CORPORATION: REVENUE, 2019–2022 ($MILLION)
FIGURE 51.NEC CORPORATION: REVENUE SHARE BY SEGMENT, 2021 (%)
FIGURE 52.NEC CORPORATION: REVENUE SHARE BY REGION, 2021 (%)
FIGURE 53.PANASONIC CORPORATION, 2018–2020 ($MILLION)
FIGURE 54.PANASONIC CORPORATION: REVENUE, 2019–2021 ($MILLION)
FIGURE 55.PANASONIC CORPORATION: REVENUE SHARE BY SEGMENT, 2020 (%)
FIGURE 56.PANASONIC CORPORATION: REVENUE SHARE BY REGION, 2021 (%)
FIGURE 57.SAMSUNG ELECTRONICS CO. LTD., 2018–2020 ($MILLION)
FIGURE 58.SAMSUNG ELECTRONICS CO. LTD.: REVENUE, 2018–2020 ($MILLION)
FIGURE 59.SAMSUNG ELECTRONICS CO. LTD.: REVENUE SHARE BY SEGMENT, 2020 (%)
FIGURE 60.SAMSUNG ELECTRONICS CO. LTD.: REVENUE SHARE BY REGION, 2020 (%)
FIGURE 61.SONY CORPORATION, 2018–2020 ($MILLION)
FIGURE 62.SONY CORPORATION: REVENUE, 2018–2020 ($MILLION)
FIGURE 63.SONY CORPORATION: REVENUE SHARE BY SEGMENT, 2020 (%)
FIGURE 64.SONY CORPORATION: REVENUE SHARE BY REGION, 2020 (%)
The large screen display market possesses high potential for the semiconductor industry. In the current business scenario, the demand for displays, particularly in the developing regions, witnesses a significant increase, owing to rise in demand for bright and power-efficient display panels. Thus, companies operating in display industry adopt various innovative techniques to provide customers with advanced and innovative product offerings.
The U.S. large screen display market has high potential for the residential, commercial, and advertising industry. The market growth is also attributed to increase in R&D investments by the large players to deploy enhanced specifications in the product portfolio. Moreover, companies are projected to indulge in mergers, collaborations, and partnerships to make the most use of technology, which is further projected to propel the market growth
The U.S. Large Screen Display Market is expected to witness high growth rate in the future, due to rise in demand for bright and power-efficient display panels, rapid digitalization and decline in demand for traditional billboards, emerging display technology such as Micro LED and quantum dots, and increase in preference of electronic giants such as Apple and Panasonic toward large screen displays.
The key players profiled in the report include iSEMC, Koninklijke Philips N.V., LG Electronics Inc., NEC Corporation, Panasonic Corporation, Planar Systems, Samsung Electronics Co. Ltd., Sony Corporation, ViewSonic Corporation, and Volanti Displays.
Â
A. The U.S. large screen display market is estimated to grow at a CAGR of 11.0% from 2021 to 2030.
A. The U.S. large screen display market is projected to reach $8.45 billion by 2030.
A. To get the latest version of sample report
A. Rise in demand for bright and power-efficient display panels and rapid digitalization and decline in demand for traditional billboards.
A. The key players profiled in the report include iSEMC, Koninklijke Philips N.V., LG Electronics Inc., NEC Corporation, Panasonic Corporation, and many more.
A. On the basis of top growing big corporations, we select top 10 players.
A. The U.S. large screen display market is segmented on the basis of screen size, application, product, location, end user, and region.
A. The key growth strategies of U.S. large screen display market players include acquisition, geographical expansion, product development, strategic alliance, and collaboration.
A. Above 300 Inch segment would grow at a highest CAGR of 18.2% during the forecast period.
A. Corporate segments will dominate the market by the end of 2030.
Start reading instantly.
This Report and over 67,540+ more Reports, Available with Avenue Library. T&C*.
Enterprise
License/PDF
Library
Membership
*Taxes/Fees, if applicable will be added during checkout. All prices in USD
To ensure high-level data integrity, accurate analysis, and impeccable forecasts
For complete satisfaction
On-demand customization of scope of the report to exactly meet your needs
Targeted market view to provide pertinent information and save time of readers
Get insights on topics that are crucial for your business. Stay abreast of your interest areas.
Get Industry Data AlertsTo ensure high-level data integrity, accurate analysis, and impeccable forecasts
For complete satisfaction
On-demand customization of scope of the report to exactly meet your needs
Targeted market view to provide pertinent information and save time of readers