Report Code: A11938 | Jul 2021 | Pages: 165 | ||
Tables: 81 | Charts: 43 |
|
Pandemic disrupted the entire world and affected many industries.
Get detailed COVID-19 impact analysis on the U.s. Protein Supplement Market
Request Now !
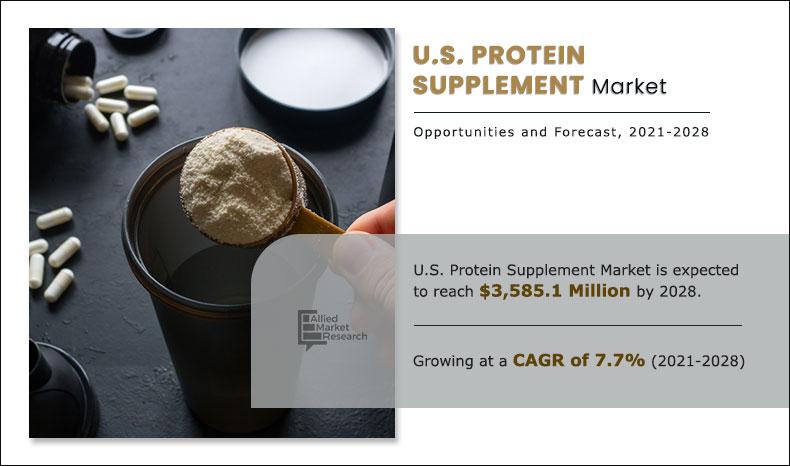
The U.S. protein supplement market forecast is projected to reach $3,585.07 million by 2028 from $1,922.50 million in 2019, growing at a CAGR of 7.7% from 2021 to 2028. Over the past of couple of years, there has been a rise in number of health-conscious customers around the globe. They look out for ways in adopting a healthy and an active lifestyle, which has fueled the demand for health-oriented food products.
Thus, protein supplement endures the same kind of traction in North America, Europe as well as Asia-Pacific regions. Healthy lifestyle is becoming a normal way of life that majorly has concerns over obesity, food sensitivity, and people affected by diseases continue to rise.
Major factors that are driving the growth of U.S. protein supplement industry are Increase in awareness among people for health & fitness, alarming rise in obesity rates, increase in disposable income, and rise in demand for supplement from the millennial population. Obesity has been a major issue since many years and number of overweight and obese people is greater than number of underweight people owing to availability of junk food and beverages at cheaper rates. Obese people are mostly expected to have high cholesterol and high blood pressure due to which they are more inclined toward these proteins supplements. Moreover, presently, protein supplements are used on a large scale due to rise in healthcare awareness among people and increase in obesity concerns. Due to rising health care awareness, people are ultimately shifting toward healthy diets and increasing their protein intake to get extra nutrients found in these supplements thereby fueling the market growth for protein supplements.
The demand for protein supplements from the young population is increasing mainly in athletes as they provide various benefits such as lowering cholesterol, building of muscles, increasing strength, fighting cancer, improving immunity, and lowering blood pressure. Thus, the market provides a great opportunity for the manufacturers in the future.
The report segments the U.S. protein supplement market based on type, form, source, gender, age group, and distribution channel. By type, the market is divided into casein, whey protein, egg protein, soy protein, and others. The whey protein segment was the highest contributor to the U.S. protein supplement market in 2019 and is estimated to dominate the market in 2028 growing at a moderate CAGR from 2021 to 2028. The soy protein segment is estimated to grow with highest CAGR of in this segment. On the basis of form, it is classified into powder, RTD liquid, and protein bars. These are generally available as protein powders in the market while RTD protein shakes and protein bars are comparatively new. On account of source, the market is segmented into animal and plant sources. The consumption of plant-based protein products has been witnessing rapid growth, which is driven by various factors such as rise in number of vegan populations, rise in number of lactose intolerant population and consumers being skeptical over the safety of animal protein consumption.
On the basis of gender, the market is bifurcated into male and female. Women seek various specific food and nutrition products to support their active and healthy lifestyle and they expect the products to be easily adaptable to their lifestyle. On the basis of age group, the market is classified into millennial, generation X, and baby boomer. Millennial are more concerned about brain health, heart health, weight loss, weight maintenance, fighting fatigue, and maintaining high energy levels. This concern drives the demand for health promoting products such as probiotics, multivitamins tablets, fish oils, as well as protein supplements. Based on distribution channel, it is categorized into supermarkets/hypermarkets, e-commerce, chemist/drugstore, nutrition store, health food store, specialist sports store, and others. E-commerce is increasingly becoming a popular platform, as it has enabled consumers to buy foreign-manufactured protein supplements. Consumers now rely on internet for gaining information and even consider online shopping as the most convenient factor.
The key market players are: Abbott Laboratories, ABH Pharma Inc., Amway Corporation, Glanbia Corp., GlazoSmithKline, GNC Holdings, Herbalife International of America Inc., Bob's Red Mill, Nutiva Inc., and MusclePharm Corporation. The major strategies adopted by key players to expand their business include expansion in untapped regions and new product launches.
During the COVID-19 outbreak, consumers have become more concerned about their overall health and wellness as COVID-19 has impacted mental and physical well-being of almost everyone across the globe.
Moreover, consumers are now more conscious about their immunity and weight gain, which has become an issue during the pandemic as people have become extremely inactive. Such factors have led to various chronic diseases such as diabetes and obesity and people are looking for healthy alternatives to combat the same. The protein supplement industry is expected to benefit from consumers, who want to lead healthier lifestyles and improve their dietary habits during and after COVID-19.
Consumers with the belief that vegan supplements boost immunity power and could help them fight against coronavirus disease boost the adoption of vegan supplements, which, in turn, propels the market growth of plant based protein supplement. Moreover, there is an increase in the number of social media users owing to rise in internet penetration. Taking this into consideration, most of the key players in the protein supplement market strategize on promoting their products and services on these social media platforms such as Instagram, Facebook, YouTube and others.
Key Benefits For Stakeholders
Key market segment
By Type
By Form
By Source
By Gender
By Age Group
U.S. Protein Supplement Market Report Highlights
Aspects | Details |
---|---|
By Type |
|
By Form |
|
By Source |
|
By Gender |
|
By Age Group |
|
By Distribution Channel |
|
Key Market Players | MUSCLEPHARM CORPORATION, AMWAY CORPORATION (AMWAY), GLAXOSMITHKLINE PLC. (GSK), ABBOTT LABORATORIES (ABBOTT), GENERAL NUTRITION CORPORATION (GNC HOLDINGS, INC.), GLANBIA PLC., HERBALIFE INTERNATIONAL OF AMERICA INC., ABH PHARMA INC, NUTIVA INC., BOB'S RED MILL |
CHAPTER 1:INTRODUCTION
1.1.Report description
1.2.Key benefits for stakeholders
1.3.Key market segment
1.4.Research methodology
1.4.1.Primary research
1.4.2.Secondary research
1.4.3.Analyst tools and models
CHAPTER 2:EXECUTIVE SUMMARY
2.1.Key findings of the study
2.2.CXO perspective
CHAPTER 3:MARKET OVERVIEW
3.1.Market definition and scope
3.2.Key findings
3.2.1.Top investment pockets
3.3.Porter's five forces analysis
3.4.Market dynamics
3.4.1.Drivers
3.4.1.1.Increase in awareness among people for health & fitness
3.4.1.2.Alarming rise in obesity rates
3.4.1.3.Increase in disposable income
3.4.1.4.Rise in demand for supplement from the millennial population
3.4.2.Restraints
3.4.2.1.Presence of cheaper substitutes
3.4.2.2.Side-effects and negative publicity & claims
3.4.3.Opportunity
3.4.3.1.Growth in demand from young population
3.5.US protein supplement market: covid-19 Impact analysis
CHAPTER 4:U.S. PROTEIN SUPPLEMENT MARKET, BY TYPE
4.1.Overview
4.1.1.Market size and forecast
4.2.Casein
4.2.1.Key market trends, growth factors and opportunities
4.2.2.Market size and forecast
4.3.Whey protein
4.3.1.Key market trends, growth factors and opportunities
4.3.2.Market size and forecast
4.4.Egg protein
4.4.1.Key market trends, growth factors and opportunities
4.4.2.Market size and forecast
4.5.Soy protein
4.5.1.Key market trends, growth factors and opportunities
4.5.2.Market size and forecast
4.6.Others
4.6.1.Key market trends, growth factors and opportunities
4.6.2.Market size and forecast
CHAPTER 5:U.S. PROTEIN SUPPLEMENT MARKET, BY FORM
5.1.Overview
5.1.1.Market size and forecast
5.2.Powder
5.2.1.Key market trends, growth factors and opportunities
5.2.2.Market size and forecast
5.3.RTD liquid
5.3.1.Key market trends, growth factors and opportunities
5.3.2.Market size and forecast
5.4.Protein bar
5.4.1.Key market trends, growth factors and opportunities
5.4.2.Market size and forecast
CHAPTER 6:U.S. PROTEIN SUPPLEMENT MARKET, BY SOURCE
6.1.Overview
6.1.1.Market size and forecast
6.2.Animal
6.2.1.Key market trends, growth factors and opportunities
6.2.2.Market size and forecast
6.3.Plant
6.3.1.Key market trends, growth factors and opportunities
6.3.2.Market size and forecast
CHAPTER 7:U.S. PROTEIN SUPPLEMENT MARKET, BY GENDER
7.1.Overview
7.1.1.Market size and forecast
7.2.Male
7.2.1.Key market trends, growth factors and opportunities
7.2.2.Market size and forecast
7.3.Female
7.3.1.Key market trends, growth factors and opportunities
7.3.2.Market size and forecast
CHAPTER 8:U.S. PROTEIN SUPPLEMENT MARKET, BY AGE GROUP
8.1.Overview
8.1.1.Market size and forecast
8.2.Millennial
8.2.1.Key market trends, growth factors and opportunities
8.2.2.Market size and forecast
8.3.Generation X
8.3.1.Key market trends, growth factors and opportunities
8.3.2.Market size and forecast
8.4.Baby boomer
8.4.1.Key market trends, growth factors and opportunities
8.4.2.Market size and forecast
CHAPTER 9:U.S. PROTEIN SUPPLEMENT MARKET, BY DISTRIBUTION CHANNEL
9.1.Overview
9.1.1.Market size and forecast
9.2.Hypermarkets/Supermarkets
9.2.1.Key market trends, growth factors and opportunities
9.2.2.Market size and forecast
9.3.E-Commerce
9.3.1.Key market trends, growth factors and opportunities
9.3.2.Market size and forecast
9.4.Chemist/Drugstore
9.4.1.Key market trends, growth factors and opportunities
9.4.2.Market size and forecast
9.5.Nutrition store
9.5.1.Key market trends, growth factors and opportunities
9.5.2.Market size and forecast
9.6.Health food store
9.6.1.Key market trends, growth factors and opportunities
9.6.2.Market size and forecast
9.7.Specialist sports store
9.7.1.Key market trends, growth factors and opportunities
9.7.2.Market size and forecast
9.8.Others
9.8.1.Key market trends, growth factors and opportunities
9.8.2.Market size and forecast
CHAPTER 10:COMPETITION LANDSCAPE
10.1.Top winning strategies
10.2.Product mapping
10.3.Competitive dashboard
10.4.Competitive heat map
10.5.Key developments
10.5.1.Acquisition
10.5.2.Product Launch
10.5.3.Partnership
10.5.4.Agreement
CHAPTER 11:COMPANY PROFILES
11.1.ABBOTT LABORATORIES (ABBOTT)
11.1.1.Company overview
11.1.2.Key Executives
11.1.3.Company snapshot
11.1.4.Operating business segments
11.1.5.Product portfolio
11.1.6.R&D Expenditure
11.1.7.Business performance
11.1.8.Key strategic moves and developments
11.2.ABH PHARMA INC
11.2.1.Company overview
11.2.2.Key Executives
11.2.3.Company snapshot
11.2.4.Product portfolio
11.3.AMWAY CORPORATION (AMWAY)
11.3.1.Company overview
11.3.2.Key Executives
11.3.3.Company snapshot
11.3.4.Product portfolio
11.4.BOB'S RED MILL
11.4.1.Company overview
11.4.2.Key Executives
11.4.3.Company snapshot
11.4.4.Product portfolio
11.4.5.Key strategic moves and developments
11.5.GENERAL NUTRITION CORPORATION (GNC HOLDINGS, INC.)
11.5.1.Company overview
11.5.2.Key Executives
11.5.3.Company snapshot
11.5.4.Operating business segments
11.5.5.Product portfolio
11.5.6.R&D Expenditure
11.5.7.Business performance
11.5.8.Key strategic moves and developments
11.6.GLANBIA PLC.
11.6.1.Company overview
11.6.2.Key Executives
11.6.3.Company snapshot
11.6.4.Operating business segments
11.6.5.Product portfolio
11.6.6.R&D Expenditure
11.6.7.Business performance
11.6.8.Key strategic moves and developments
11.7.GLAXOSMITHKLINE PLC. (GSK)
11.7.1.Company overview
11.7.2.Key Executives
11.7.3.Company snapshot
11.7.4.Operating business segments
11.7.5.Product portfolio
11.7.6.R&D Expenditure
11.7.7.Business performance
11.7.8.Key strategic moves and developments
11.8.HERBALIFE INTERNATIONAL OF AMERICA INC.
11.8.1.Company overview
11.8.2.Key Executives
11.8.3.Company snapshot
11.8.4.Operating business segments
11.8.5.Product portfolio
11.8.6.Business performance
11.9.MUSCLEPHARM CORPORATION
11.9.1.Company overview
11.9.2.Key Executives
11.9.3.Company snapshot
11.9.4.Operating business segments
11.9.5.Product portfolio
11.9.6.R&D Expenditure
11.9.7.Business performance
11.9.8.Key strategic moves and developments
11.10.NUTIVA INC.
11.10.1.Company overview
11.10.2.Key Executives
11.10.3.Company snapshot
11.10.4.Product portfolio
11.10.5.Key strategic moves and developments
LIST OF TABLES
TABLE 01.U.S. PROTEIN SUPPLEMENT MARKET REVENUE, BY TYPE, 2019–2028 ($MILLION)
TABLE 02.U.S. PROTEIN SUPPLEMENT MARKET VOLUME, BY TYPE, 2019–2028 (KILOTON)
TABLE 03.U.S. CASEIN PROTEIN SUPPLEMENT MARKET REVENUE, 2019–2028 ($MILLION)
TABLE 04.U.S. CASEIN PROTEIN SUPPLEMENT MARKET VOLUME, 2019–2028 (KILOTON)
TABLE 05.U.S. WHEY PROTEIN SUPPLEMENT MARKET REVENUE, 2019–2028 ($MILLION)
TABLE 06.U.S. WHEY PROTEIN SUPPLEMENT MARKET VOLUME, 2019–2028 (KILOTON)
TABLE 07.U.S. EGG PROTEIN SUPPLEMENT MARKET REVENUE, 2019–2028 ($MILLION)
TABLE 08.U.S. EGG PROTEIN SUPPLEMENT MARKET VOLUME, 2019–2028 (KILOTON)
TABLE 09.U.S. SOY PROTEIN SUPPLEMENT MARKET REVENUE, 2019–2028 ($MILLION)
TABLE 10.U.S. SOY PROTEIN SUPPLEMENT MARKET VOLUME, 2019–2028 (KILOTON)
TABLE 11.U.S. OTHER PROTEIN SUPPLEMENT MARKET REVENUE, 2019–2028 ($MILLION)
TABLE 12.U.S. OTHER PROTEIN SUPPLEMENT MARKET VOLUME, 2019–2028 (KILOTON)
TABLE 13.U.S. PROTEIN SUPPLEMENT MARKET REVENUE, BY FORM, 2019–2028 ($MILLION)
TABLE 14.U.S. POWDER PROTEIN SUPPLEMENT MARKET REVENUE, 2019–2028 ($MILLION)
TABLE 15.U.S. RTD LIQUID PROTEIN SUPPLEMENT MARKET REVENUE, 2019–2028 ($MILLION)
TABLE 16.U.S. PROTEIN BAR MARKET REVENUE, 2019–2028 ($MILLION)
TABLE 17.U.S. PROTEIN SUPPLEMENT MARKET REVENUE, BY SOURCE, 2019–2028 ($MILLION)
TABLE 18.U.S. ANIMAL PROTEIN SUPPLEMENT MARKET REVENUE, 2019–2028 ($MILLION)
TABLE 19.U.S. PLANT PROTEIN SUPPLEMENT MARKET REVENUE, 2019–2028 ($MILLION)
TABLE 20.U.S. PROTEIN SUPPLEMENT MARKET REVENUE, BY GENDER, 2019–2028 ($MILLION)
TABLE 21.U.S. PROTEIN SUPPLEMENT MARKET REVENUE FOR MALE, 2019–2028 ($MILLION)
TABLE 22.U.S. PROTEIN SUPPLEMENT MARKET REVENUE FOR FEMALE, 2019–2028 ($MILLION)
TABLE 23.U.S. PROTEIN SUPPLEMENT MARKET REVENUE, BY AGE GROUP, 2019–2028 ($MILLION)
TABLE 24.U.S. PROTEIN SUPPLEMENT MARKET REVENUE FOR MILLENIAL, 2019–2028 ($MILLION)
TABLE 25.U.S. PROTEIN SUPPLEMENT MARKET REVENUE FOR GENERATION X, 2019–2028 ($MILLION)
TABLE 26.U.S. PROTEIN SUPPLEMENT MARKET REVENUE FOR BABY BOOMER, 2019–2028 ($MILLION)
TABLE 27.U.S. PROTEIN SUPPLEMENT MARKET REVENUE, BY DISTRIBUTION CHANNEL, 2019–2028 ($MILLION)
TABLE 28.U.S. PROTEIN SUPPLEMENT MARKET REVENUE FOR HYPERMARKETS/SUPERMARKETS, 2019–2028 ($MILLION)
TABLE 29.U.S. PROTEIN SUPPLEMENT MARKET REVENUE FOR E-COMMERCE, 2019–2028 ($MILLION)
TABLE 30.U.S. PROTEIN SUPPLEMENT MARKET REVENUE FOR CHEMIST/DRUGSTORE, 2019–2028 ($MILLION)
TABLE 31.U.S. PROTEIN SUPPLEMENT MARKET REVENUE FOR NUTRITION STORE, 2019–2028 ($MILLION)
TABLE 32.U.S. PROTEIN SUPPLEMENT MARKET REVENUE FOR HEALTH FOOD STORE, 2019–2028 ($MILLION)
TABLE 33.U.S. PROTEIN SUPPLEMENT MARKET REVENUE FOR SPECIALIST SPORTS STORE, 2019–2028 ($MILLION)
TABLE 34.U.S. PROTEIN SUPPLEMENT MARKET REVENUE FOR OTHERS, 2019–2028 ($MILLION)
TABLE 35.ABBOTT LABORATORIES: KEY EXECUTIVES
TABLE 36.ABBOTT LABORATORIES: COMPANY SNAPSHOT
TABLE 37.ABBOTT LABORATORIES: OPERATING SEGMENTS
TABLE 38.ABBOTT LABORATORIES: PRODUCT PORTFOLIO
TABLE 39.ABBOTT LABORATORIES: R&D EXPENDITURE, 2018–2020 ($MILLION)
TABLE 40.ABBOTT LABORATORIES: NET SALES, 2018–2020 ($MILLION)
TABLE 41.ABH PHARMA INC: KEY EXECUTIVES
TABLE 42.ABH PHARMA INC: COMPANY SNAPSHOT
TABLE 43.ABH PHARMA INC: PRODUCT PORTFOLIO
TABLE 44.AMWAY: KEY EXECUTIVES
TABLE 45.AMWAY: COMPANY SNAPSHOT
TABLE 46.AMWAY: PRODUCT PORTFOLIO
TABLE 47.BOB’S RED MILL: KEY EXECUTIVES
TABLE 48.BOB’S RED MILL: COMPANY SNAPSHOT
TABLE 49.BOB’S RED MILL: PRODUCT PORTFOLIO
TABLE 50.GNC HOLDINGS, INC.: KEY EXECUTIVES
TABLE 51.GNC HOLDINGS, INC.: COMPANY SNAPSHOT
TABLE 52.GNC HOLDINGS, INC.: OPERATING SEGMENTS
TABLE 53.GNC HOLDINGS, INC.: PRODUCT PORTFOLIO
TABLE 54.GNC HOLDINGS, INC.: R&D EXPENDITURE, 2017–2019 ($MILLION)
TABLE 55.GNC HOLDINGS, INC.: NET SALES, 2017–2019 ($MILLION)
TABLE 56.GLANBIA PLC: KEY EXECUTIVES
TABLE 57.GLANBIA PLC: COMPANY SNAPSHOT
TABLE 58.GLANBIA PLC: OPERATING SEGMENTS
TABLE 59.GLANBIA PLC: PRODUCT PORTFOLIO
TABLE 60.GLANBIA PLC: R&D EXPENDITURE, 2018–2020 ($MILLION)
TABLE 61.GLANBIA PLC: NET SALES, 2018–2020 ($MILLION)
TABLE 62.GSK: KEY EXECUTIVES
TABLE 63.GSK: COMPANY SNAPSHOT
TABLE 64.GSK: OPERATING SEGMENTS
TABLE 65.GSK: PRODUCT PORTFOLIO
TABLE 66.GSK: R&D EXPENDITURE, 2018–2020 ($MILLION)
TABLE 67.GSK: NET SALES, 2018–2020 ($MILLION)
TABLE 68.HERBALIFE INTERNATIONAL OF AMERICA, INC.: KEY EXECUTIVES
TABLE 69.HERBALIFE INTERNATIONAL OF AMERICA, INC.: COMPANY SNAPSHOT
TABLE 70.HERBALIFE INTERNATIONAL OF AMERICA, INC.: OPERATING SEGMENTS
TABLE 71.HERBALIFE INTERNATIONAL OF AMERICA, INC: PRODUCT PORTFOLIO
TABLE 72.HERBALIFE INTERNATIONAL OF AMERICA, INC: NET SALES, 2018–2020 ($MILLION)
TABLE 73.MUSCLEPHARM CORPORATION: KEY EXECUTIVES
TABLE 74.MUSCLEPHARM CORPORATION: COMPANY SNAPSHOT
TABLE 75.MUSCLEPHARM CORPORATION: OPERATING SEGMENTS
TABLE 76.MUSCLEPHARM CORPORATION: PRODUCT PORTFOLIO
TABLE 77.MUSCLEPHARM CORPORATION: R&D EXPENDITURE, 2018–2020 ($MILLION)
TABLE 78.MUSCLEPHARM CORPORATION: NET SALES, 2018–2020 ($MILLION)
TABLE 79.NUTIVA INC: KEY EXECUTIVES
TABLE 80.NUTIVA INC: COMPANY SNAPSHOT
TABLE 81.NUTIVA INC: PRODUCT PORTFOLIO
LIST OF FIGURES
FIGURE 01.KEY MARKET SEGMENTS
FIGURE 02.EXECUTIVE SUMMARY
FIGURE 03.TOP INVESTMENT POCKETS
FIGURE 04.LOW BARGAINING POWER OF SUPPLIERS
FIGURE 05.MODERATE THREAT OF NEW ENTRANTS
FIGURE 06.MODERATE TO HIGH THREAT OF SUBSTITUTES
FIGURE 07.HIGH INTENSITY OF RIVALRY
FIGURE 08.LOW TO MODERATE BARGAINING POWER OF BUYERS
FIGURE 09.U.S. PROTEIN SUPPLEMENT MARKET: DRIVERS, RESTRAINTS, AND OPPORTUNITIES
FIGURE 10.U.S. PROTEIN SUPPLEMENT MARKET, BY TYPE, 2019 (%)
FIGURE 11.U.S. PROTEIN SUPPLEMENT MARKET, BY FORM, 2019 (%)
FIGURE 12.U.S. PROTEIN SUPPLEMENT MARKET, BY SOURCE, 2019 (%)
FIGURE 13.U.S. PROTEIN SUPPLEMENT MARKET, BY GENDER, 2019 (%)
FIGURE 14.U.S. PROTEIN SUPPLEMENT MARKET, BY AGE GROUP, 2019 (%)
FIGURE 15.U.S. PROTEIN SUPPLEMENT MARKET, BY DISTRIBUTION CHANNEL, 2019 (%)
FIGURE 16.TOP WINNING STRATEGIES, BY YEAR, 2018–2021*
FIGURE 17.TOP WINNING STRATEGIES, BY DEVELOPMENT, 2018–2021* (%)
FIGURE 18.TOP WINNING STRATEGIES, BY COMPANY, 2018–2021*
FIGURE 19.PRODUCT MAPPING OF TOP 10 KEY PLAYERS
FIGURE 20.COMPETITIVE DASHBOARD OF TOP 10 KEY PLAYERS
FIGURE 21.COMPETITIVE HEATMAP OF TOP 10 KEY PLAYERS
FIGURE 22.ABBOTT LABORATORIES: R&D EXPENDITURE, 2018–2020 ($MILLION)
FIGURE 23.ABBOTT LABORATORIES: NET SALES, 2018–2020 ($MILLION)
FIGURE 24.ABBOTT LABORATORIES: REVENUE SHARE BY SEGMENT, 2020 (%)
FIGURE 25.ABBOTT LABORATORIES: REVENUE SHARE BY REGION, 2020 (%)
FIGURE 26.GNC HOLDINGS, INC.: R&D EXPENDITURE, 2017–2019 ($MILLION)
FIGURE 27.GNC HOLDINGS, INC.: NET SALES, 2017–2019 ($MILLION)
FIGURE 28.GNC HOLDINGS, INC.: REVENUE SHARE BY SEGMENT, 2019 (%)
FIGURE 29.GNC HOLDINGS, INC.: REVENUE SHARE BY REGION, 2019 (%)
FIGURE 30.GLANBIA PLC: R&D EXPENDITURE, 2018–2020 ($MILLION)
FIGURE 31.GLANBIA PLC: NET SALES, 2018–2020 ($MILLION)
FIGURE 32.GLANBIA PLC: REVENUE SHARE BY SEGMENT, 2020(%)
FIGURE 33.GLANBIA PLC: REVENUE SHARE BY REGION, 2020 (%)
FIGURE 34.GSK: R&D EXPENDITURE, 2018–2020 ($MILLION)
FIGURE 35.GSK: NET SALES, 2018–2020 ($MILLION)
FIGURE 36.GSK: REVENUE SHARE BY SEGMENT, 2020 (%)
FIGURE 37.GSK: REVENUE SHARE BY REGION, 2020 (%)
FIGURE 38.HERBALIFE INTERNATIONAL OF AMERICA, INC: NET SALES, 2018–2020 ($MILLION)
FIGURE 39.HERBALIFE INTERNATIONAL OF AMERICA, INC: REVENUE SHARE BY SEGMENT, 2020 (%)
FIGURE 40.HERBALIFE INTERNATIONAL OF AMERICA, INC: REVENUE SHARE BY REGION, 2020 (%)
FIGURE 41.MUSCLEPHARM CORPORATION: R&D EXPENDITURE, 2018–2020 ($MILLION)
FIGURE 42.MUSCLEPHARM CORPORATION: NET SALES, 2018–2020 ($MILLION)
FIGURE 43.MUSCLEPHARM CORPORATION: REVENUE SHARE BY REGION, 2020 (%)
According to CXO’s of leading companies, the U.S. protein supplement market is expected to witness significant growth during the forecast period owing to various factors such as increase in obesity rates, rise in healthcare awareness among youth and surge in disposable income of consumers. Protein-related products used by athletes are included in the sports nutrition market, but the ones taken by common people for building muscles or losing weight come under the U.S. protein supplement market. These are generally available as protein powders in the market while RTD protein shakes and protein bars are comparatively new.
A. The U.S. protein supplement market forecast is projected to reach $3,585.07 million by 2028
A. The forecast period for the market is 2021-2028
A. The base year calculated in the U.S. protein supplement market is 2019.
A. The key market players holding the major market share in the market are Abbott Laboratories, ABH Pharma Inc., Amway Corporation, Glanbia Corp., GlazoSmithKline, GNC Holdings, Herbalife International of America Inc., Bob's Red Mill, Nutiva Inc., and MusclePharm Corporation. The major strategies adopted by key players to expand their business include expansion in untapped regions and new product launches.
A. Millenial segment is the fastest growing segment in the market.
A. On the basis of form, powder segment holds the highest market share
A. Company profile is selected on the basis of majority market share
A. The U.S. protein supplement market is valued at $1,922.50 million in 2019.
Start reading instantly.
This Report and over 66,944+ more Reports, Available with Avenue Library. T&C*.
Enterprise
License/PDF
Library
Membership
*Taxes/Fees, if applicable will be added during checkout. All prices in USD
To ensure high-level data integrity, accurate analysis, and impeccable forecasts
For complete satisfaction
On-demand customization of scope of the report to exactly meet your needs
Targeted market view to provide pertinent information and save time of readers
Get insights on topics that are crucial for your business. Stay abreast of your interest areas.
Get Industry Data AlertsTo ensure high-level data integrity, accurate analysis, and impeccable forecasts
For complete satisfaction
On-demand customization of scope of the report to exactly meet your needs
Targeted market view to provide pertinent information and save time of readers