0
2022
Vegan Cosmetics Market

Vegan Cosmetics Market

by Product Type (Skincare, Cosmetics, Haircare, Others), by Price Point (Premium, Economic), by Gender (Women, Men, Children), by End User (Personal, Commercial), by Distribution Channel (Hypermarkets/supermarkets, Specialty Stores, Online Channels, Others): Global Opportunity Analysis and Industry Forecast, 2021-2031

Report Code: A16339
May 2022 | Pages: 370
Tables: 211
Charts: 69
  • Formats*:

  • pdf

    Single User License, Five User
    License & Enterprise User License

  • xls

    Data Pack Excel License

  • ppt

    It comes with the additional cost
    of $2500.00 contact sales.


Vegan Cosmetics Market Research, 2031

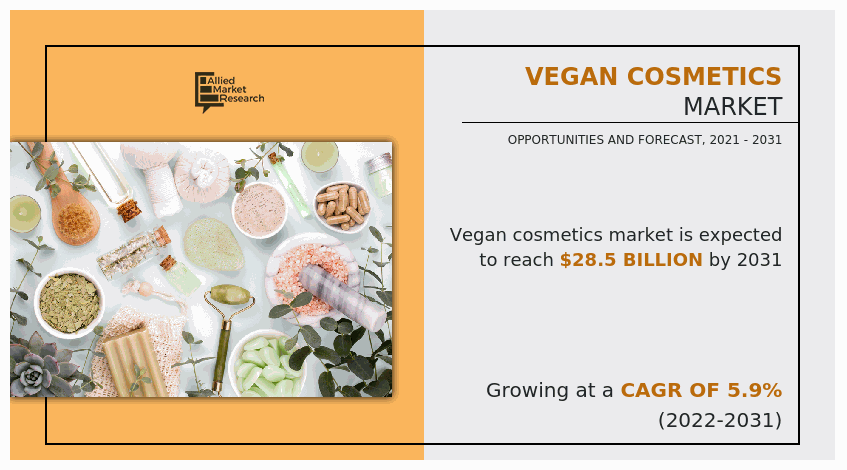
The global vegan cosmetics market size was valued at $16.6 billion in 2021, and is projected to reach $28.5 billion by 2031, growing at a CAGR of 5.9% from 2022 to 2031.

The COVID-19 outbreak has disrupted the cosmetics market across the globe. Furthermore, the impact of the pandemic on the society and the economy has been witnessed as a result of global lockdowns. Restrictions on travel, airline suspensions, and most importantly, slowdown in the global economy have affected the business of cosmetics manufacturers across the globe. Consumers' skincare routine has changed by the growing perception of the risk associated with COVID-19. Consumers avoided purchasing cosmetics to focus on acquiring the necessities that were required to survive in the present pandemic crisis, which has a direct impact on the growth of the overall cosmetics sector, thus hindering the vegan cosmetics market growth.

Vegan Cosmetics Market, Vegan Cosmetics Industry, Vegan Cosmetics Market Size, Vegan Cosmetics Market Share, Vegan Cosmetics Market Growth, Vegan Cosmetics Market Trends, Vegan Cosmetics Market Analysis, Vegan Cosmetics Market Forecast

Vegan cosmetics are made up of chemical compounds taken from natural or synthetic sources that do not contain any animal-derived ingredients. Ingredients produced from animals include, honey, beeswax, lanolin, collagen, albumen, carmine, cholesterol, gelatin, and many others. Vegan cosmetics are also devoid of animal cruelty and testing. Vegan cosmetics are meant for personal care, skincare, face care, and hair care and are used to cleanse or protect the body or hair. Vegan cosmetics are used to enhance or modify a person's appearance (makeup) by hiding imperfections, accentuating natural features (such as brows and eyelashes), adding radiance to the face, or completely redefining the look.
The vegan cosmetics market is segmented into product type, price point, gender, end user, sales channel, and region. On the basis of product type, the market is categorized into skincare, cosmetics, hair care, and others. On the basis of price point, it is divided into premium and economic. On the basis of gender, the market is segmented into women, men, and children. On the basis of end user, the market is divided into personal and commercial. By sales channel, the market is divided into hypermarkets/supermarkets, specialty stores, online channels, and others. On the basis of region, the market is analyzed across North America (the U.S., Canada, and Mexico), Europe (Germany, UK, France, Italy, Spain, and rest of Europe), Asia-Pacific (China, Japan, Australia, South Korea, India and rest of Asia-Pacific), and LAMEA (Brazil, Argentina, Chile, South Africa, and rest of LAMEA).

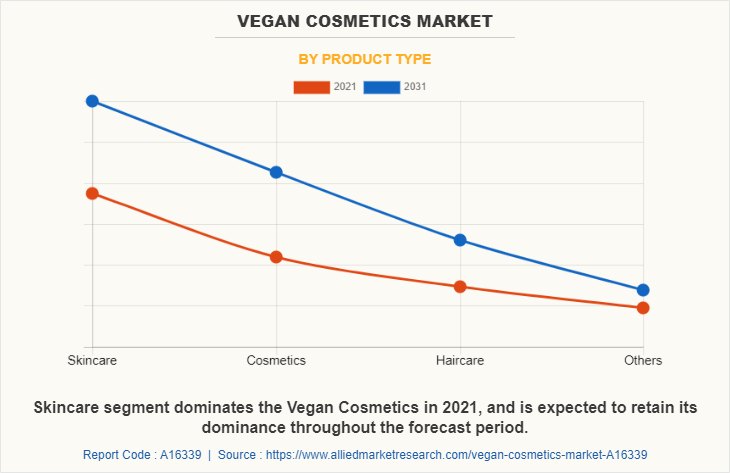
On the basis of product type, the skincare segment gained a major share in the global market in 2021 and is expected to sustain its market share during the forecast period. The skincare segment was growing, with a CAGR of 5.2% in 2021. The growth of this segment is due to the usage of skincare products by the global consumers to maintain proper skin condition.
Vegan Cosmetics Market

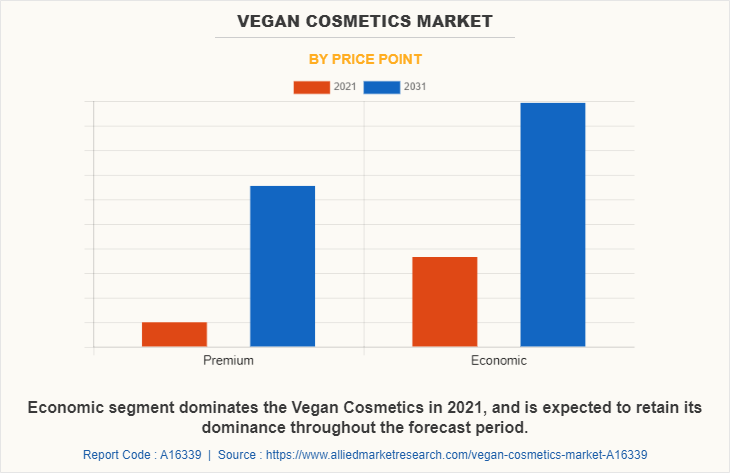
On the basis of price point, the economic segment gained a major share in the global market in 2021 and is expected to sustain its market share during the vegan cosmetics market forecast period. The growth of this segment is due to the high usage of economic vegan cosmetic products by global consumers as the pricing was economic and the availability of these products was high.
Vegan Cosmetics Market

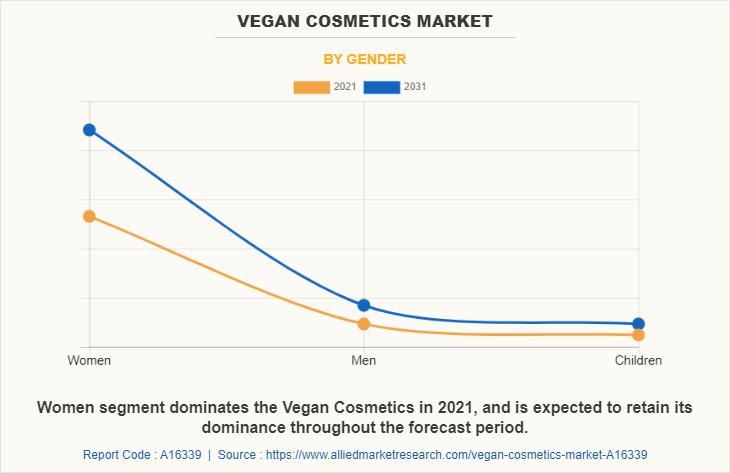
According to vegan cosmetics market analysis, on the basis of gender, the women segment gained a major share in the global market in 2021 and is expected to sustain its market share during the forecast period. The growth of the women segment is due to the high usage of vegan cosmetic products by the global women population as cosmetics is an integral part of women.
Vegan Cosmetics Market

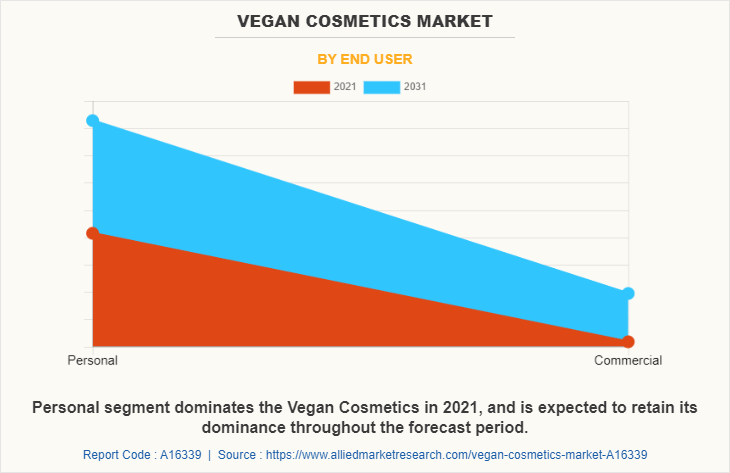
On the basis of end user, the personal segment gained a major share in the global market in 2021 and is expected to sustain its market share during the forecast period. The growth of the personal segment is due to the high usage of vegan cosmetic products by the global population for personal use as cosmetics is needed by the consumers on a regular basis.
Vegan Cosmetics Market

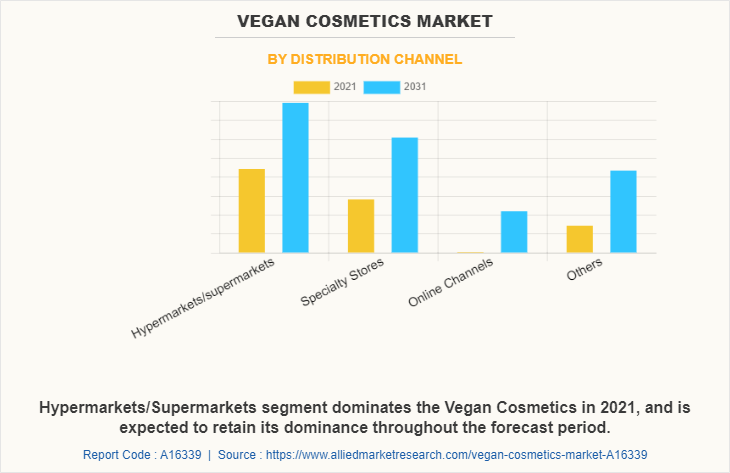
On the basis of distribution channel, the hypermarkets/supermarkets gained a major share in 2021 and is expected to sustain its market share during the forecast period, with a CAGR of 4.8%. Hypermarkets/supermarkets are the most common place that consumers prefer to but cosmetics products and offers an access to various vegan cosmetic products that are unavailable in other channels. The availability of vegan cosmetic products in the hypermarkets is fueling the vegan cosmetics market growth.
Vegan Cosmetics Market

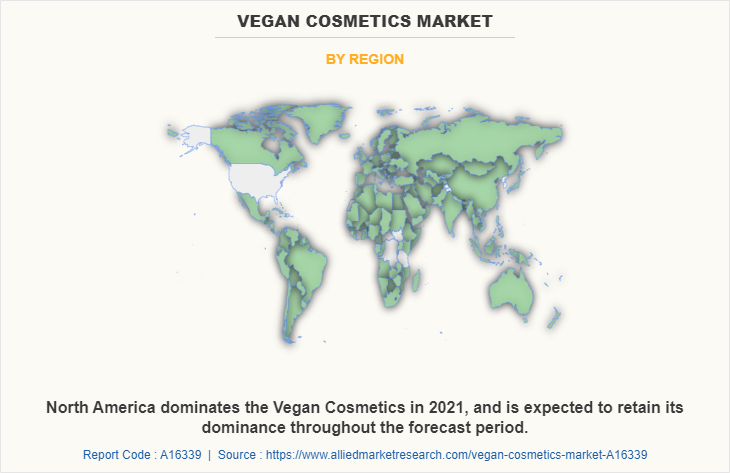
Region-wise, North America dominated the vegan cosmetics market in 2021, with a CAGR of 4.6%, owing to the higher percentage of population, which prefers to use vegan cosmetic products in the North American countries and North America is home to the highest vegan population.
Vegan Cosmetics Market

The players operating in the global vegan cosmetics market have adopted various developmental strategies to expand their vegan cosmetics market share, increase profitability, and remain competitive in the market. The key players profiled in this report include, Amway Corporation, Estee Lauder Companies Inc., Groupe Rocher, L'Occitane Group, L'Oréal S.A., LVMH Group, MuLondon, Pacifica Beauty, Unilever, and Weleda.

Key Benefits For Stakeholders

  • This report provides a quantitative analysis of the market segments, current trends, estimations, and dynamics of the vegan cosmetic market analysis from 2021 to 2031 to identify the prevailing vegan cosmetic market opportunities.
  • The market research is offered along with information related to key drivers, restraints, and opportunities.
  • Porter's five forces analysis highlights the potency of buyers and suppliers to enable stakeholders make profit-oriented business decisions and strengthen their supplier-buyer network.
  • In-depth analysis of the vegan cosmetics industry segmentation assists to determine the prevailing market opportunities.
  • Major countries in each region are mapped according to their revenue contribution to the global market.
  • Market player positioning facilitates benchmarking and provides a clear understanding of the present position of the market players.
  • The report includes the analysis of the regional as well as global vegan cosmetics market trends, key players, market segments, application areas, and market growth strategies.

Vegan Cosmetics Market Report Highlights

Aspects Details
By Price Point
  • Premium
  • Economic
By Gender
  • Women
  • Men
  • Children
By Product Type
  • Skincare
  • Cosmetics
  • Haircare
  • Others
By End User
  • Personal
  • Commercial
By Distribution Channel
  • Hypermarkets/supermarkets
  • Specialty Stores
  • Online Channels
  • Others
By Region
  • North America  (U.S., Canada, Mexico)
  • Europe  (Germany, France, U.K., Italy, Spain, Rest of Europe)
  • Asia-Pacific  (China, Japan, South Korea, India, Australia, Rest of Asia-Pacific)
  • LAMEA  (Brazil, Argentina, Chile, South Africa, Rest of LAMEA)
Key Market Players MuLondon, L'Occitane Group, Amway Corporation, Estee Lauder Companies Inc., Weleda, LVMH Group, L'Oréal S.A., Unilever plc, Groupe Rocher, Pacifica Beauty
 
  • CHAPTER 1:INTRODUCTION

    • 1.1.Report description

    • 1.2.Key market segments

    • 1.3.Key benefits to the stakeholders

    • 1.4.Research Methodology

      • 1.4.1.Secondary research

      • 1.4.2.Primary research

      • 1.4.3.Analyst tools and models

  • CHAPTER 2:EXECUTIVE SUMMARY

    • 2.1.Key findings of the study

    • 2.2.CXO Perspective

  • CHAPTER 3:MARKET OVERVIEW

    • 3.1.Market definition and scope

    • 3.2.Key findings

      • 3.2.1.Top investment pockets

    • 3.3.Porter’s five forces analysis

    • 3.4.Top player positioning

    • 3.5.Market dynamics

      • 3.5.1.Drivers

      • 3.5.2.Restraints

      • 3.5.3.Opportunities

    • 3.6.COVID-19 Impact Analysis on the market

    • 3.7.Pricing Analysis

    • 3.8.Value Chain Analysis

    • 3.9.Market Share Analysis

  • CHAPTER 4: VEGAN COSMETICS MARKET, BY PRODUCT TYPE

    • 4.1 Overview

      • 4.1.1 Market size and forecast

    • 4.2 Skincare

      • 4.2.1 Key market trends, growth factors and opportunities

      • 4.2.2 Market size and forecast, by region

      • 4.2.3 Market analysis by country

    • 4.3 Cosmetics

      • 4.3.1 Key market trends, growth factors and opportunities

      • 4.3.2 Market size and forecast, by region

      • 4.3.3 Market analysis by country

    • 4.4 Haircare

      • 4.4.1 Key market trends, growth factors and opportunities

      • 4.4.2 Market size and forecast, by region

      • 4.4.3 Market analysis by country

    • 4.5 Others

      • 4.5.1 Key market trends, growth factors and opportunities

      • 4.5.2 Market size and forecast, by region

      • 4.5.3 Market analysis by country

  • CHAPTER 5: VEGAN COSMETICS MARKET, BY PRICE POINT

    • 5.1 Overview

      • 5.1.1 Market size and forecast

    • 5.2 Premium

      • 5.2.1 Key market trends, growth factors and opportunities

      • 5.2.2 Market size and forecast, by region

      • 5.2.3 Market analysis by country

    • 5.3 Economic

      • 5.3.1 Key market trends, growth factors and opportunities

      • 5.3.2 Market size and forecast, by region

      • 5.3.3 Market analysis by country

  • CHAPTER 6: VEGAN COSMETICS MARKET, BY GENDER

    • 6.1 Overview

      • 6.1.1 Market size and forecast

    • 6.2 Women

      • 6.2.1 Key market trends, growth factors and opportunities

      • 6.2.2 Market size and forecast, by region

      • 6.2.3 Market analysis by country

    • 6.3 Men

      • 6.3.1 Key market trends, growth factors and opportunities

      • 6.3.2 Market size and forecast, by region

      • 6.3.3 Market analysis by country

    • 6.4 Children

      • 6.4.1 Key market trends, growth factors and opportunities

      • 6.4.2 Market size and forecast, by region

      • 6.4.3 Market analysis by country

  • CHAPTER 7: VEGAN COSMETICS MARKET, BY END USER

    • 7.1 Overview

      • 7.1.1 Market size and forecast

    • 7.2 Personal

      • 7.2.1 Key market trends, growth factors and opportunities

      • 7.2.2 Market size and forecast, by region

      • 7.2.3 Market analysis by country

    • 7.3 Commercial

      • 7.3.1 Key market trends, growth factors and opportunities

      • 7.3.2 Market size and forecast, by region

      • 7.3.3 Market analysis by country

  • CHAPTER 8: VEGAN COSMETICS MARKET, BY DISTRIBUTION CHANNEL

    • 8.1 Overview

      • 8.1.1 Market size and forecast

    • 8.2 Hypermarkets/supermarkets

      • 8.2.1 Key market trends, growth factors and opportunities

      • 8.2.2 Market size and forecast, by region

      • 8.2.3 Market analysis by country

    • 8.3 Specialty Stores

      • 8.3.1 Key market trends, growth factors and opportunities

      • 8.3.2 Market size and forecast, by region

      • 8.3.3 Market analysis by country

    • 8.4 Online Channels

      • 8.4.1 Key market trends, growth factors and opportunities

      • 8.4.2 Market size and forecast, by region

      • 8.4.3 Market analysis by country

    • 8.5 Others

      • 8.5.1 Key market trends, growth factors and opportunities

      • 8.5.2 Market size and forecast, by region

      • 8.5.3 Market analysis by country

  • CHAPTER 9: VEGAN COSMETICS MARKET, BY REGION

    • 9.1 Overview

      • 9.1.1 Market size and forecast

    • 9.2 North America

      • 9.2.1 Key trends and opportunities

      • 9.2.2 North America Market size and forecast, by Product Type

      • 9.2.3 North America Market size and forecast, by Price Point

      • 9.2.4 North America Market size and forecast, by Gender

      • 9.2.5 North America Market size and forecast, by End User

      • 9.2.6 North America Market size and forecast, by Distribution Channel

      • 9.2.7 North America Market size and forecast, by country

        • 9.2.7.1 U.S.
          • 9.2.7.1.1 Market size and forecast, by Product Type
          • 9.2.7.1.2 Market size and forecast, by Price Point
          • 9.2.7.1.3 Market size and forecast, by Gender
          • 9.2.7.1.4 Market size and forecast, by End User
          • 9.2.7.1.5 Market size and forecast, by Distribution Channel
        • 9.2.7.2 Canada
          • 9.2.7.2.1 Market size and forecast, by Product Type
          • 9.2.7.2.2 Market size and forecast, by Price Point
          • 9.2.7.2.3 Market size and forecast, by Gender
          • 9.2.7.2.4 Market size and forecast, by End User
          • 9.2.7.2.5 Market size and forecast, by Distribution Channel
        • 9.2.7.3 Mexico
          • 9.2.7.3.1 Market size and forecast, by Product Type
          • 9.2.7.3.2 Market size and forecast, by Price Point
          • 9.2.7.3.3 Market size and forecast, by Gender
          • 9.2.7.3.4 Market size and forecast, by End User
          • 9.2.7.3.5 Market size and forecast, by Distribution Channel
    • 9.3 Europe

      • 9.3.1 Key trends and opportunities

      • 9.3.2 Europe Market size and forecast, by Product Type

      • 9.3.3 Europe Market size and forecast, by Price Point

      • 9.3.4 Europe Market size and forecast, by Gender

      • 9.3.5 Europe Market size and forecast, by End User

      • 9.3.6 Europe Market size and forecast, by Distribution Channel

      • 9.3.7 Europe Market size and forecast, by country

        • 9.3.7.1 Germany
          • 9.3.7.1.1 Market size and forecast, by Product Type
          • 9.3.7.1.2 Market size and forecast, by Price Point
          • 9.3.7.1.3 Market size and forecast, by Gender
          • 9.3.7.1.4 Market size and forecast, by End User
          • 9.3.7.1.5 Market size and forecast, by Distribution Channel
        • 9.3.7.2 France
          • 9.3.7.2.1 Market size and forecast, by Product Type
          • 9.3.7.2.2 Market size and forecast, by Price Point
          • 9.3.7.2.3 Market size and forecast, by Gender
          • 9.3.7.2.4 Market size and forecast, by End User
          • 9.3.7.2.5 Market size and forecast, by Distribution Channel
        • 9.3.7.3 U.K.
          • 9.3.7.3.1 Market size and forecast, by Product Type
          • 9.3.7.3.2 Market size and forecast, by Price Point
          • 9.3.7.3.3 Market size and forecast, by Gender
          • 9.3.7.3.4 Market size and forecast, by End User
          • 9.3.7.3.5 Market size and forecast, by Distribution Channel
        • 9.3.7.4 Italy
          • 9.3.7.4.1 Market size and forecast, by Product Type
          • 9.3.7.4.2 Market size and forecast, by Price Point
          • 9.3.7.4.3 Market size and forecast, by Gender
          • 9.3.7.4.4 Market size and forecast, by End User
          • 9.3.7.4.5 Market size and forecast, by Distribution Channel
        • 9.3.7.5 Spain
          • 9.3.7.5.1 Market size and forecast, by Product Type
          • 9.3.7.5.2 Market size and forecast, by Price Point
          • 9.3.7.5.3 Market size and forecast, by Gender
          • 9.3.7.5.4 Market size and forecast, by End User
          • 9.3.7.5.5 Market size and forecast, by Distribution Channel
        • 9.3.7.6 Rest of Europe
          • 9.3.7.6.1 Market size and forecast, by Product Type
          • 9.3.7.6.2 Market size and forecast, by Price Point
          • 9.3.7.6.3 Market size and forecast, by Gender
          • 9.3.7.6.4 Market size and forecast, by End User
          • 9.3.7.6.5 Market size and forecast, by Distribution Channel
    • 9.4 Asia-Pacific

      • 9.4.1 Key trends and opportunities

      • 9.4.2 Asia-Pacific Market size and forecast, by Product Type

      • 9.4.3 Asia-Pacific Market size and forecast, by Price Point

      • 9.4.4 Asia-Pacific Market size and forecast, by Gender

      • 9.4.5 Asia-Pacific Market size and forecast, by End User

      • 9.4.6 Asia-Pacific Market size and forecast, by Distribution Channel

      • 9.4.7 Asia-Pacific Market size and forecast, by country

        • 9.4.7.1 China
          • 9.4.7.1.1 Market size and forecast, by Product Type
          • 9.4.7.1.2 Market size and forecast, by Price Point
          • 9.4.7.1.3 Market size and forecast, by Gender
          • 9.4.7.1.4 Market size and forecast, by End User
          • 9.4.7.1.5 Market size and forecast, by Distribution Channel
        • 9.4.7.2 Japan
          • 9.4.7.2.1 Market size and forecast, by Product Type
          • 9.4.7.2.2 Market size and forecast, by Price Point
          • 9.4.7.2.3 Market size and forecast, by Gender
          • 9.4.7.2.4 Market size and forecast, by End User
          • 9.4.7.2.5 Market size and forecast, by Distribution Channel
        • 9.4.7.3 India
          • 9.4.7.3.1 Market size and forecast, by Product Type
          • 9.4.7.3.2 Market size and forecast, by Price Point
          • 9.4.7.3.3 Market size and forecast, by Gender
          • 9.4.7.3.4 Market size and forecast, by End User
          • 9.4.7.3.5 Market size and forecast, by Distribution Channel
        • 9.4.7.4 Australia
          • 9.4.7.4.1 Market size and forecast, by Product Type
          • 9.4.7.4.2 Market size and forecast, by Price Point
          • 9.4.7.4.3 Market size and forecast, by Gender
          • 9.4.7.4.4 Market size and forecast, by End User
          • 9.4.7.4.5 Market size and forecast, by Distribution Channel
        • 9.4.7.5 South Korea
          • 9.4.7.5.1 Market size and forecast, by Product Type
          • 9.4.7.5.2 Market size and forecast, by Price Point
          • 9.4.7.5.3 Market size and forecast, by Gender
          • 9.4.7.5.4 Market size and forecast, by End User
          • 9.4.7.5.5 Market size and forecast, by Distribution Channel
        • 9.4.7.6 Rest of Asia-Pacific
          • 9.4.7.6.1 Market size and forecast, by Product Type
          • 9.4.7.6.2 Market size and forecast, by Price Point
          • 9.4.7.6.3 Market size and forecast, by Gender
          • 9.4.7.6.4 Market size and forecast, by End User
          • 9.4.7.6.5 Market size and forecast, by Distribution Channel
    • 9.5 LAMEA

      • 9.5.1 Key trends and opportunities

      • 9.5.2 LAMEA Market size and forecast, by Product Type

      • 9.5.3 LAMEA Market size and forecast, by Price Point

      • 9.5.4 LAMEA Market size and forecast, by Gender

      • 9.5.5 LAMEA Market size and forecast, by End User

      • 9.5.6 LAMEA Market size and forecast, by Distribution Channel

      • 9.5.7 LAMEA Market size and forecast, by country

        • 9.5.7.1 Brazil
          • 9.5.7.1.1 Market size and forecast, by Product Type
          • 9.5.7.1.2 Market size and forecast, by Price Point
          • 9.5.7.1.3 Market size and forecast, by Gender
          • 9.5.7.1.4 Market size and forecast, by End User
          • 9.5.7.1.5 Market size and forecast, by Distribution Channel
        • 9.5.7.2 Argentina
          • 9.5.7.2.1 Market size and forecast, by Product Type
          • 9.5.7.2.2 Market size and forecast, by Price Point
          • 9.5.7.2.3 Market size and forecast, by Gender
          • 9.5.7.2.4 Market size and forecast, by End User
          • 9.5.7.2.5 Market size and forecast, by Distribution Channel
        • 9.5.7.3 Chile
          • 9.5.7.3.1 Market size and forecast, by Product Type
          • 9.5.7.3.2 Market size and forecast, by Price Point
          • 9.5.7.3.3 Market size and forecast, by Gender
          • 9.5.7.3.4 Market size and forecast, by End User
          • 9.5.7.3.5 Market size and forecast, by Distribution Channel
        • 9.5.7.4 South Africa
          • 9.5.7.4.1 Market size and forecast, by Product Type
          • 9.5.7.4.2 Market size and forecast, by Price Point
          • 9.5.7.4.3 Market size and forecast, by Gender
          • 9.5.7.4.4 Market size and forecast, by End User
          • 9.5.7.4.5 Market size and forecast, by Distribution Channel
        • 9.5.7.5 Rest of LAMEA
          • 9.5.7.5.1 Market size and forecast, by Product Type
          • 9.5.7.5.2 Market size and forecast, by Price Point
          • 9.5.7.5.3 Market size and forecast, by Gender
          • 9.5.7.5.4 Market size and forecast, by End User
          • 9.5.7.5.5 Market size and forecast, by Distribution Channel
  • CHAPTER 10: COMPANY LANDSCAPE

    • 10.1. Introduction

    • 10.2. Top winning strategies

    • 10.3. Product Mapping of Top 10 Player

    • 10.4. Competitive Dashboard

    • 10.5. Competitive Heatmap

    • 10.6. Key developments

  • CHAPTER 11: COMPANY PROFILES

    • 11.1 Amway Corporation

      • 11.1.1 Company overview

      • 11.1.2 Company snapshot

      • 11.1.3 Operating business segments

      • 11.1.4 Product portfolio

      • 11.1.5 Business performance

      • 11.1.6 Key strategic moves and developments

    • 11.2 Estee Lauder Companies Inc.

      • 11.2.1 Company overview

      • 11.2.2 Company snapshot

      • 11.2.3 Operating business segments

      • 11.2.4 Product portfolio

      • 11.2.5 Business performance

      • 11.2.6 Key strategic moves and developments

    • 11.3 Groupe Rocher

      • 11.3.1 Company overview

      • 11.3.2 Company snapshot

      • 11.3.3 Operating business segments

      • 11.3.4 Product portfolio

      • 11.3.5 Business performance

      • 11.3.6 Key strategic moves and developments

    • 11.4 L'Occitane Group

      • 11.4.1 Company overview

      • 11.4.2 Company snapshot

      • 11.4.3 Operating business segments

      • 11.4.4 Product portfolio

      • 11.4.5 Business performance

      • 11.4.6 Key strategic moves and developments

    • 11.5 L'Oréal S.A.

      • 11.5.1 Company overview

      • 11.5.2 Company snapshot

      • 11.5.3 Operating business segments

      • 11.5.4 Product portfolio

      • 11.5.5 Business performance

      • 11.5.6 Key strategic moves and developments

    • 11.6 LVMH Group

      • 11.6.1 Company overview

      • 11.6.2 Company snapshot

      • 11.6.3 Operating business segments

      • 11.6.4 Product portfolio

      • 11.6.5 Business performance

      • 11.6.6 Key strategic moves and developments

    • 11.7 MuLondon

      • 11.7.1 Company overview

      • 11.7.2 Company snapshot

      • 11.7.3 Operating business segments

      • 11.7.4 Product portfolio

      • 11.7.5 Business performance

      • 11.7.6 Key strategic moves and developments

    • 11.8 Pacifica Beauty

      • 11.8.1 Company overview

      • 11.8.2 Company snapshot

      • 11.8.3 Operating business segments

      • 11.8.4 Product portfolio

      • 11.8.5 Business performance

      • 11.8.6 Key strategic moves and developments

    • 11.9 Unilever plc

      • 11.9.1 Company overview

      • 11.9.2 Company snapshot

      • 11.9.3 Operating business segments

      • 11.9.4 Product portfolio

      • 11.9.5 Business performance

      • 11.9.6 Key strategic moves and developments

    • 11.10 Weleda

      • 11.10.1 Company overview

      • 11.10.2 Company snapshot

      • 11.10.3 Operating business segments

      • 11.10.4 Product portfolio

      • 11.10.5 Business performance

      • 11.10.6 Key strategic moves and developments

  • LIST OF TABLES

  • TABLE 9. VEGAN COSMETICS MARKET OTHERS BY COUNTRY, 2021-2031,($MILLION)
    TABLE 10. GLOBAL VEGAN COSMETICS MARKET, BY PRICE POINT, 2021-2031,($MILLION)
    TABLE 11. VEGAN COSMETICS MARKET REVENUE, FOR PREMIUM, BY REGION , 2021-2031,($MILLION)
    TABLE 12. VEGAN COSMETICS MARKET PREMIUM BY COUNTRY, 2021-2031,($MILLION)
    TABLE 13. VEGAN COSMETICS MARKET REVENUE, FOR ECONOMIC, BY REGION , 2021-2031,($MILLION)
    TABLE 14. VEGAN COSMETICS MARKET ECONOMIC BY COUNTRY, 2021-2031,($MILLION)
    TABLE 15. GLOBAL VEGAN COSMETICS MARKET, BY GENDER, 2021-2031,($MILLION)
    TABLE 16. VEGAN COSMETICS MARKET REVENUE, FOR WOMEN, BY REGION , 2021-2031,($MILLION)
    TABLE 17. VEGAN COSMETICS MARKET WOMEN BY COUNTRY, 2021-2031,($MILLION)
    TABLE 18. VEGAN COSMETICS MARKET REVENUE, FOR MEN, BY REGION , 2021-2031,($MILLION)
    TABLE 19. VEGAN COSMETICS MARKET MEN BY COUNTRY, 2021-2031,($MILLION)
    TABLE 20. VEGAN COSMETICS MARKET REVENUE, FOR CHILDREN, BY REGION , 2021-2031,($MILLION)
    TABLE 21. VEGAN COSMETICS MARKET CHILDREN BY COUNTRY, 2021-2031,($MILLION)
    TABLE 22. GLOBAL VEGAN COSMETICS MARKET, BY END USER, 2021-2031,($MILLION)
    TABLE 23. VEGAN COSMETICS MARKET REVENUE, FOR PERSONAL, BY REGION , 2021-2031,($MILLION)
    TABLE 24. VEGAN COSMETICS MARKET PERSONAL BY COUNTRY, 2021-2031,($MILLION)
    TABLE 25. VEGAN COSMETICS MARKET REVENUE, FOR COMMERCIAL, BY REGION , 2021-2031,($MILLION)
    TABLE 26. VEGAN COSMETICS MARKET COMMERCIAL BY COUNTRY, 2021-2031,($MILLION)
    TABLE 27. GLOBAL VEGAN COSMETICS MARKET, BY DISTRIBUTION CHANNEL, 2021-2031,($MILLION)
    TABLE 28. VEGAN COSMETICS MARKET REVENUE, FOR HYPERMARKETS/SUPERMARKETS, BY REGION , 2021-2031,($MILLION)
    TABLE 29. VEGAN COSMETICS MARKET HYPERMARKETS/SUPERMARKETS BY COUNTRY, 2021-2031,($MILLION)
    TABLE 1. GLOBAL VEGAN COSMETICS MARKET, BY PRODUCT TYPE, 2021-2031,($MILLION)
    TABLE 2. VEGAN COSMETICS MARKET REVENUE, FOR SKINCARE, BY REGION , 2021-2031,($MILLION)
    TABLE 3. VEGAN COSMETICS MARKET SKINCARE BY COUNTRY, 2021-2031,($MILLION)
    TABLE 4. VEGAN COSMETICS MARKET REVENUE, FOR COSMETICS, BY REGION , 2021-2031,($MILLION)
    TABLE 5. VEGAN COSMETICS MARKET COSMETICS BY COUNTRY, 2021-2031,($MILLION)
    TABLE 6. VEGAN COSMETICS MARKET REVENUE, FOR HAIRCARE, BY REGION , 2021-2031,($MILLION)
    TABLE 7. VEGAN COSMETICS MARKET HAIRCARE BY COUNTRY, 2021-2031,($MILLION)
    TABLE 8. VEGAN COSMETICS MARKET REVENUE, FOR OTHERS, BY REGION , 2021-2031,($MILLION)
    TABLE 30. VEGAN COSMETICS MARKET REVENUE, FOR SPECIALTY STORES, BY REGION , 2021-2031,($MILLION)
    TABLE 31. VEGAN COSMETICS MARKET SPECIALTY STORES BY COUNTRY, 2021-2031,($MILLION)
    TABLE 32. VEGAN COSMETICS MARKET REVENUE, FOR ONLINE CHANNELS, BY REGION , 2021-2031,($MILLION)
    TABLE 33. VEGAN COSMETICS MARKET ONLINE CHANNELS BY COUNTRY, 2021-2031,($MILLION)
    TABLE 34. VEGAN COSMETICS MARKET REVENUE, FOR OTHERS, BY REGION , 2021-2031,($MILLION)
    TABLE 35. VEGAN COSMETICS MARKET OTHERS BY COUNTRY, 2021-2031,($MILLION)
    TABLE 36. VEGAN COSMETICS MARKET, BY REGION, 2021-2031,($MILLION)
    TABLE 37. NORTH AMERICA VEGAN COSMETICS MARKET, BY PRODUCT TYPE, 2021-2031,($MILLION)
    TABLE 38. NORTH AMERICA VEGAN COSMETICS MARKET, BY PRICE POINT, 2021-2031,($MILLION)
    TABLE 39. NORTH AMERICA VEGAN COSMETICS MARKET, BY GENDER, 2021-2031,($MILLION)
    TABLE 40. NORTH AMERICA VEGAN COSMETICS MARKET, BY END USER, 2021-2031,($MILLION)
    TABLE 41. NORTH AMERICA VEGAN COSMETICS MARKET, BY DISTRIBUTION CHANNEL, 2021-2031,($MILLION)
    TABLE 42. NORTH AMERICA VEGAN COSMETICS MARKET, BY COUNTRY, 2021-2031,($MILLION)
    TABLE 43. U.S. VEGAN COSMETICS MARKET BY PRODUCT TYPE 2021-2031,($MILLION)
    TABLE 44. U.S. VEGAN COSMETICS MARKET BY PRICE POINT 2021-2031,($MILLION)
    TABLE 45. U.S. VEGAN COSMETICS MARKET BY GENDER 2021-2031,($MILLION)
    TABLE 46. U.S. VEGAN COSMETICS MARKET BY END USER 2021-2031,($MILLION)
    TABLE 47. U.S. VEGAN COSMETICS MARKET BY DISTRIBUTION CHANNEL 2021-2031,($MILLION)
    TABLE 48. CANADA VEGAN COSMETICS MARKET BY PRODUCT TYPE 2021-2031,($MILLION)
    TABLE 50. CANADA VEGAN COSMETICS MARKET BY GENDER 2021-2031,($MILLION)
    TABLE 51. CANADA VEGAN COSMETICS MARKET BY END USER 2021-2031,($MILLION)
    TABLE 52. CANADA VEGAN COSMETICS MARKET BY DISTRIBUTION CHANNEL 2021-2031,($MILLION)
    TABLE 53. MEXICO VEGAN COSMETICS MARKET BY PRODUCT TYPE 2021-2031,($MILLION)
    TABLE 54. MEXICO VEGAN COSMETICS MARKET BY PRICE POINT 2021-2031,($MILLION)
    TABLE 55. MEXICO VEGAN COSMETICS MARKET BY GENDER 2021-2031,($MILLION)
    TABLE 56. MEXICO VEGAN COSMETICS MARKET BY END USER 2021-2031,($MILLION)
    TABLE 57. MEXICO VEGAN COSMETICS MARKET BY DISTRIBUTION CHANNEL 2021-2031,($MILLION)
    TABLE 58. EUROPE VEGAN COSMETICS MARKET, BY PRODUCT TYPE, 2021-2031,($MILLION)
    TABLE 59. EUROPE VEGAN COSMETICS MARKET, BY PRICE POINT, 2021-2031,($MILLION)
    TABLE 60. EUROPE VEGAN COSMETICS MARKET, BY GENDER, 2021-2031,($MILLION)
    TABLE 61. EUROPE VEGAN COSMETICS MARKET, BY END USER, 2021-2031,($MILLION)
    TABLE 62. EUROPE VEGAN COSMETICS MARKET, BY DISTRIBUTION CHANNEL, 2021-2031,($MILLION)
    TABLE 63. EUROPE VEGAN COSMETICS MARKET, BY COUNTRY, 2021-2031,($MILLION)
    TABLE 64. GERMANY VEGAN COSMETICS MARKET BY PRODUCT TYPE 2021-2031,($MILLION)
    TABLE 65. GERMANY VEGAN COSMETICS MARKET BY PRICE POINT 2021-2031,($MILLION)
    TABLE 66. GERMANY VEGAN COSMETICS MARKET BY GENDER 2021-2031,($MILLION)
    TABLE 67. GERMANY VEGAN COSMETICS MARKET BY END USER 2021-2031,($MILLION)
    TABLE 68. GERMANY VEGAN COSMETICS MARKET BY DISTRIBUTION CHANNEL 2021-2031,($MILLION)
    TABLE 69. FRANCE VEGAN COSMETICS MARKET BY PRODUCT TYPE 2021-2031,($MILLION)
    TABLE 70. FRANCE VEGAN COSMETICS MARKET BY PRICE POINT 2021-2031,($MILLION)
    TABLE 71. FRANCE VEGAN COSMETICS MARKET BY GENDER 2021-2031,($MILLION)
    TABLE 72. FRANCE VEGAN COSMETICS MARKET BY END USER 2021-2031,($MILLION)
    TABLE 73. FRANCE VEGAN COSMETICS MARKET BY DISTRIBUTION CHANNEL 2021-2031,($MILLION)
    TABLE 74. U.K. VEGAN COSMETICS MARKET BY PRODUCT TYPE 2021-2031,($MILLION)
    TABLE 49. CANADA VEGAN COSMETICS MARKET BY PRICE POINT 2021-2031,($MILLION)
    TABLE 75. U.K. VEGAN COSMETICS MARKET BY PRICE POINT 2021-2031,($MILLION)
    TABLE 76. U.K. VEGAN COSMETICS MARKET BY GENDER 2021-2031,($MILLION)
    TABLE 77. U.K. VEGAN COSMETICS MARKET BY END USER 2021-2031,($MILLION)
    TABLE 78. U.K. VEGAN COSMETICS MARKET BY DISTRIBUTION CHANNEL 2021-2031,($MILLION)
    TABLE 79. ITALY VEGAN COSMETICS MARKET BY PRODUCT TYPE 2021-2031,($MILLION)
    TABLE 80. ITALY VEGAN COSMETICS MARKET BY PRICE POINT 2021-2031,($MILLION)
    TABLE 81. ITALY VEGAN COSMETICS MARKET BY GENDER 2021-2031,($MILLION)
    TABLE 82. ITALY VEGAN COSMETICS MARKET BY END USER 2021-2031,($MILLION)
    TABLE 83. ITALY VEGAN COSMETICS MARKET BY DISTRIBUTION CHANNEL 2021-2031,($MILLION)
    TABLE 84. SPAIN VEGAN COSMETICS MARKET BY PRODUCT TYPE 2021-2031,($MILLION)
    TABLE 85. SPAIN VEGAN COSMETICS MARKET BY PRICE POINT 2021-2031,($MILLION)
    TABLE 86. SPAIN VEGAN COSMETICS MARKET BY GENDER 2021-2031,($MILLION)
    TABLE 87. SPAIN VEGAN COSMETICS MARKET BY END USER 2021-2031,($MILLION)
    TABLE 88. SPAIN VEGAN COSMETICS MARKET BY DISTRIBUTION CHANNEL 2021-2031,($MILLION)
    TABLE 89. REST OF EUROPE VEGAN COSMETICS MARKET BY PRODUCT TYPE 2021-2031,($MILLION)
    TABLE 90. REST OF EUROPE VEGAN COSMETICS MARKET BY PRICE POINT 2021-2031,($MILLION)
    TABLE 91. REST OF EUROPE VEGAN COSMETICS MARKET BY GENDER 2021-2031,($MILLION)
    TABLE 92. REST OF EUROPE VEGAN COSMETICS MARKET BY END USER 2021-2031,($MILLION)
    TABLE 93. REST OF EUROPE VEGAN COSMETICS MARKET BY DISTRIBUTION CHANNEL 2021-2031,($MILLION)
    TABLE 94. ASIA-PACIFIC VEGAN COSMETICS MARKET, BY PRODUCT TYPE, 2021-2031,($MILLION)
    TABLE 95. ASIA-PACIFIC VEGAN COSMETICS MARKET, BY PRICE POINT, 2021-2031,($MILLION)
    TABLE 96. ASIA-PACIFIC VEGAN COSMETICS MARKET, BY GENDER, 2021-2031,($MILLION)
    TABLE 97. ASIA-PACIFIC VEGAN COSMETICS MARKET, BY END USER, 2021-2031,($MILLION)
    TABLE 109. JAPAN VEGAN COSMETICS MARKET BY DISTRIBUTION CHANNEL 2021-2031,($MILLION)
    TABLE 110. INDIA VEGAN COSMETICS MARKET BY PRODUCT TYPE 2021-2031,($MILLION)
    TABLE 111. INDIA VEGAN COSMETICSMARKET BY PRICE POINT 2021-2031,($MILLION)
    TABLE 112. INDIA VEGAN COSMETICS MARKET BY GENDER 2021-2031,($MILLION)
    TABLE 113. INDIA VEGAN COSMETICS MARKET BY END USER 2021-2031,($MILLION)
    TABLE 114. INDIA VEGAN COSMETICS MARKET BY DISTRIBUTION CHANNEL 2021-2031,($MILLION)
    TABLE 115. AUSTRALIA VEGAN COSMETICS MARKET BY PRODUCT TYPE 2021-2031,($MILLION)
    TABLE 116. AUSTRALIA VEGAN COSMETICS MARKET BY PRICE POINT 2021-2031,($MILLION)
    TABLE 117. AUSTRALIA VEGAN COSMETICS MARKET BY GENDER 2021-2031,($MILLION)
    TABLE 118. AUSTRALIA VEGAN COSMETICS MARKET BY END USER 2021-2031,($MILLION)
    TABLE 119. AUSTRALIA VEGAN COSMETICS MARKET BY DISTRIBUTION CHANNEL 2021-2031,($MILLION)
    TABLE 98. ASIA-PACIFIC VEGAN COSMETICS MARKET, BY DISTRIBUTION CHANNEL, 2021-2031,($MILLION)
    TABLE 99. ASIA-PACIFIC VEGAN COSMETICS MARKET, BY COUNTRY, 2021-2031,($MILLION)
    TABLE 100. CHINA VEGAN COSMETICS MARKET BY PRODUCT TYPE 2021-2031,($MILLION)
    TABLE 101. CHINA VEGAN COSMETICS MARKET BY PRICE POINT 2021-2031,($MILLION)
    TABLE 102. CHINA VEGAN COSMETICS MARKET BY GENDER 2021-2031,($MILLION)
    TABLE 103. CHINA VEGAN COSMETICS MARKET BY END USER 2021-2031,($MILLION)
    TABLE 104. CHINA VEGAN COSMETICS MARKET BY DISTRIBUTION CHANNEL 2021-2031,($MILLION)
    TABLE 105. JAPAN VEGAN COSMETICS MARKET BY PRODUCT TYPE 2021-2031,($MILLION)
    TABLE 106. JAPAN VEGAN COSMETICS MARKET BY PRICE POINT 2021-2031,($MILLION)
    TABLE 107. JAPAN VEGAN COSMETICS MARKET BY GENDER 2021-2031,($MILLION)
    TABLE 120. SOUTH KOREA VEGAN COSMETICS MARKET BY PRODUCT TYPE 2021-2031,($MILLION)
    TABLE 108. JAPAN VEGAN COSMETICS MARKET BY END USER 2021-2031,($MILLION)
    TABLE 121. SOUTH KOREA VEGAN COSMETICS MARKET BY PRICE POINT 2021-2031,($MILLION)
    TABLE 122. SOUTH KOREA VEGAN COSMETICS MARKET BY GENDER 2021-2031,($MILLION)
    TABLE 123. SOUTH KOREA VEGAN COSMETICS MARKET BY END USER 2021-2031,($MILLION)
    TABLE 124. SOUTH KOREA VEGAN COSMETICS MARKET BY DISTRIBUTION CHANNEL 2021-2031,($MILLION)
    TABLE 125. REST OF ASIA-PACIFIC VEGAN COSMETICS MARKET BY PRODUCT TYPE 2021-2031,($MILLION)
    TABLE 126. REST OF ASIA-PACIFIC VEGAN COSMETICS MARKET BY PRICE POINT 2021-2031,($MILLION)
    TABLE 127. REST OF ASIA-PACIFIC VEGAN COSMETICS MARKET BY GENDER 2021-2031,($MILLION)
    TABLE 128. REST OF ASIA-PACIFIC VEGAN COSMETICS MARKET BY END USER 2021-2031,($MILLION)
    TABLE 129. REST OF ASIA-PACIFIC VEGAN COSMETICS MARKET BY DISTRIBUTION CHANNEL 2021-2031,($MILLION)
    TABLE 130. LAMEA VEGAN COSMETICS MARKET, BY PRODUCT TYPE, 2021-2031,($MILLION)
    TABLE 131. LAMEA VEGAN COSMETICS MARKET, BY PRICE POINT, 2021-2031,($MILLION)
    TABLE 132. LAMEA VEGAN COSMETICS MARKET, BY GENDER, 2021-2031,($MILLION)
    TABLE 133. LAMEA VEGAN COSMETICS MARKET, BY END USER, 2021-2031,($MILLION)
    TABLE 134. LAMEA VEGAN COSMETICS MARKET, BY DISTRIBUTION CHANNEL, 2021-2031,($MILLION)
    TABLE 135. LAMEA VEGAN COSMETICS MARKET, BY COUNTRY, 2021-2031,($MILLION)
    TABLE 136. BRAZIL VEGAN COSMETICS MARKET BY PRODUCT TYPE 2021-2031,($MILLION)
    TABLE 137. BRAZIL VEGAN COSMETICS MARKET BY PRICE POINT 2021-2031,($MILLION)
    TABLE 138. BRAZIL VEGAN COSMETICS MARKET BY GENDER 2021-2031,($MILLION)
    TABLE 139. BRAZIL VEGAN COSMETICS MARKET BY END USER 2021-2031,($MILLION)
    TABLE 140. BRAZIL VEGAN COSMETICS MARKET BY DISTRIBUTION CHANNEL 2021-2031,($MILLION)
    TABLE 141. ARGENTINA VEGAN COSMETICS MARKET BY PRODUCT TYPE 2021-2031,($MILLION)
    TABLE 142. ARGENTINA VEGAN COSMETICS MARKET BY PRICE POINT 2021-2031,($MILLION)
    TABLE 143. ARGENTINA VEGAN COSMETICS MARKET BY GENDER 2021-2031,($MILLION)
    TABLE 144. ARGENTINA VEGAN COSMETICS MARKET BY END USER 2021-2031,($MILLION)
    TABLE 145. ARGENTINA VEGAN COSMETICS MARKET BY DISTRIBUTION CHANNEL 2021-2031,($MILLION)
    TABLE 160. REST OF LAMEA VEGAN COSMETICS MARKET BY DISTRIBUTION CHANNEL 2021-2031,($MILLION)
    TABLE 161.AMWAY CORPORATION: COMPANY SNAPSHOT
    TABLE 162.AMWAY CORPORATION: OPERATING SEGMENTS
    TABLE 163.AMWAY CORPORATION: PRODUCT PORTFOLIO
    TABLE 164.AMWAY CORPORATION: NET SALES,
    TABLE 165.AMWAY CORPORATION: KEY STRATERGIES
    TABLE 146. CHILE VEGAN COSMETICS MARKET BY PRODUCT TYPE 2021-2031,($MILLION)
    TABLE 147. CHILE VEGAN COSMETICS MARKET BY PRICE POINT 2021-2031,($MILLION)
    TABLE 148. CHILE VEGAN COSMETICS MARKET BY GENDER 2021-2031,($MILLION)
    TABLE 149. CHILE VEGAN COSMETICS MARKET BY END USER 2021-2031,($MILLION)
    TABLE 150. CHILE VEGAN COSMETICS MARKET BY DISTRIBUTION CHANNEL 2021-2031,($MILLION)
    TABLE 151. SOUTH AFRICA VEGAN COSMETICS MARKET BY PRODUCT TYPE 2021-2031,($MILLION)
    TABLE 152. SOUTH AFRICA VEGAN COSMETICS MARKET BY PRICE POINT 2021-2031,($MILLION)
    TABLE 153. SOUTH AFRICA VEGAN COSMETICS MARKET BY GENDER 2021-2031,($MILLION)
    TABLE 154. SOUTH AFRICA VEGAN COSMETICS MARKET BY END USER 2021-2031,($MILLION)
    TABLE 155. SOUTH AFRICA VEGAN COSMETICS MARKET BY DISTRIBUTION CHANNEL 2021-2031,($MILLION)
    TABLE 156. REST OF LAMEA VEGAN COSMETICS MARKET BY PRODUCT TYPE 2021-2031,($MILLION)
    TABLE 157. REST OF LAMEA VEGAN COSMETICS MARKET BY PRICE POINT 2021-2031,($MILLION)
    TABLE 158. REST OF LAMEA VEGAN COSMETICS MARKET BY GENDER 2021-2031,($MILLION)
    TABLE 166.ESTEE LAUDER COMPANIES INC.: COMPANY SNAPSHOT
    TABLE 167.ESTEE LAUDER COMPANIES INC.: OPERATING SEGMENTS
    TABLE 168.ESTEE LAUDER COMPANIES INC.: PRODUCT PORTFOLIO
    TABLE 159. REST OF LAMEA VEGAN COSMETIC MARKET BY END USER 2021-2031,($MILLION)
    TABLE 169.ESTEE LAUDER COMPANIES INC.: NET SALES,
    TABLE 170.ESTEE LAUDER COMPANIES INC.: KEY STRATERGIES
    TABLE 171.GROUPE ROCHER: COMPANY SNAPSHOT
    TABLE 172.GROUPE ROCHER: OPERATING SEGMENTS
    TABLE 173.GROUPE ROCHER: PRODUCT PORTFOLIO
    TABLE 174.GROUPE ROCHER: NET SALES,
    TABLE 175.GROUPE ROCHER: KEY STRATERGIES
    TABLE 176.L'OCCITANE GROUP: COMPANY SNAPSHOT
    TABLE 177.L'OCCITANE GROUP: OPERATING SEGMENTS
    TABLE 178.L'OCCITANE GROUP: PRODUCT PORTFOLIO
    TABLE 179.L'OCCITANE GROUP: NET SALES,
    TABLE 180.L'OCCITANE GROUP: KEY STRATERGIES
    TABLE 181.L'ORÉAL S.A.: COMPANY SNAPSHOT
    TABLE 182.L'ORÉAL S.A.: OPERATING SEGMENTS
    TABLE 183.L'ORÉAL S.A.: PRODUCT PORTFOLIO
    TABLE 184.L'ORÉAL S.A.: NET SALES,
    TABLE 185.L'ORÉAL S.A.: KEY STRATERGIES
    TABLE 186.LVMH GROUP: COMPANY SNAPSHOT
    TABLE 187.LVMH GROUP: OPERATING SEGMENTS
    TABLE 188.LVMH GROUP: PRODUCT PORTFOLIO
    TABLE 189.LVMH GROUP: NET SALES,
    TABLE 190.LVMH GROUP: KEY STRATERGIES
    TABLE 191.MULONDON: COMPANY SNAPSHOT
    TABLE 192.MULONDON: OPERATING SEGMENTS
    TABLE 193.MULONDON: PRODUCT PORTFOLIO
    TABLE 194.MULONDON: NET SALES,
    TABLE 195.MULONDON: KEY STRATERGIES
    TABLE 196.PACIFICA BEAUTY: COMPANY SNAPSHOT
    TABLE 197.PACIFICA BEAUTY: OPERATING SEGMENTS
    TABLE 198.PACIFICA BEAUTY: PRODUCT PORTFOLIO
    TABLE 199.PACIFICA BEAUTY: NET SALES,
    TABLE 204.UNILEVER PLC: NET SALES,
    TABLE 205.UNILEVER PLC: KEY STRATERGIES
    TABLE 206.WELEDA: COMPANY SNAPSHOT
    TABLE 207.WELEDA: OPERATING SEGMENTS
    TABLE 208.WELEDA: PRODUCT PORTFOLIO
    TABLE 200.PACIFICA BEAUTY: KEY STRATERGIES
    TABLE 201.UNILEVER PLC: COMPANY SNAPSHOT
    TABLE 202.UNILEVER PLC: OPERATING SEGMENTS
    TABLE 209.WELEDA: NET SALES,
    TABLE 210.WELEDA: KEY STRATERGIES
    TABLE 203.UNILEVER PLC: PRODUCT PORTFOLIO
  • LIST OF FIGURES

  • FIGURE 1.VEGAN COSMETICS MARKET SEGMENTATION
    FIGURE 2.VEGAN COSMETICS MARKET,2021-2031
    FIGURE 3.VEGAN COSMETICS MARKET,2021-2031
    FIGURE 4. TOP INVESTMENT POCKETS, BY REGION
    FIGURE 5.PORTER FIVE-1
    FIGURE 6.PORTER FIVE-2
    FIGURE 7.PORTER FIVE-3
    FIGURE 8.PORTER FIVE-4
    FIGURE 9.PORTER FIVE-5
    FIGURE 10.TOP PLAYER POSITIONING
    FIGURE 11.VEGAN COSMETIC MARKET:DRIVERS, RESTRAINTS AND OPPORTUNITIES
    FIGURE 12.VALUE CHAIN ANALYSIS
    FIGURE 13.MARKET SHARE ANALYSIS
    FIGURE 13.VEGAN COSMETICS MARKET,BY PRODUCT TYPE,2021(%)
    FIGURE 14.COMPARATIVE SHARE ANALYSIS OF SKINCARE VEGAN COSMETICS MARKET,2021-2031(%)
    FIGURE 15.COMPARATIVE SHARE ANALYSIS OF COSMETICS VEGAN COSMETICS MARKET,2021-2031(%)
    FIGURE 16.COMPARATIVE SHARE ANALYSIS OF HAIRCARE VEGAN COSMETICS MARKET,2021-2031(%)
    FIGURE 17.COMPARATIVE SHARE ANALYSIS OF OTHERS VEGAN COSMETICS MARKET,2021-2031(%)
    FIGURE 18.VEGAN COSMETICS MARKET,BY PRICE POINT,2021(%)
    FIGURE 19.COMPARATIVE SHARE ANALYSIS OF PREMIUM VEGAN COSMETICS MARKET,2021-2031(%)
    FIGURE 20.COMPARATIVE SHARE ANALYSIS OF ECONOMIC VEGAN COSMETICS MARKET,2021-2031(%)
    FIGURE 21.VEGAN COSMETICS MARKET,BY GENDER,2021(%)
    FIGURE 22.COMPARATIVE SHARE ANALYSIS OF WOMEN VEGAN COSMETICS MARKET,2021-2031(%)
    FIGURE 23.COMPARATIVE SHARE ANALYSIS OF MEN VEGAN COSMETICS MARKET,2021-2031(%)
    FIGURE 24.COMPARATIVE SHARE ANALYSIS OF CHILDREN VEGAN COSMETICS MARKET,2021-2031(%)
    FIGURE 25.VEGAN COSMETICS MARKET,BY END USER,2021(%)
    FIGURE 26.COMPARATIVE SHARE ANALYSIS OF PERSONAL VEGAN COSMETICS MARKET,2021-2031(%)
    FIGURE 27.COMPARATIVE SHARE ANALYSIS OF COMMERCIAL VEGAN COSMETICS MARKET,2021-2031(%)
    FIGURE 28.VEGAN COSMETICS MARKET,BY DISTRIBUTION CHANNEL,2021(%)
    FIGURE 29.COMPARATIVE SHARE ANALYSIS OF HYPERMARKETS/SUPERMARKETS VEGAN COSMETICS MARKET,2021-2031(%)
    FIGURE 30.COMPARATIVE SHARE ANALYSIS OF SPECIALTY STORES VEGAN COSMETICS MARKET,2021-2031(%)
    FIGURE 31.COMPARATIVE SHARE ANALYSIS OF ONLINE CHANNELS VEGAN COSMETICS MARKET,2021-2031(%)
    FIGURE 32.COMPARATIVE SHARE ANALYSIS OF OTHERS VEGAN COSMETICS MARKET,2021-2031(%)
    FIGURE 33.VEGAN COSMETICS MARKET BY REGION,2021
    FIGURE 34.U.S. VEGAN COSMETICS MARKET,2021-2031($MILLION)
    FIGURE 35.CANADA VEGAN COSMETICS MARKET,2021-2031($MILLION)
    FIGURE 36.MEXICO VEGAN COSMETICS MARKET,2021-2031($MILLION)
    FIGURE 37.GERMANY VEGAN COSMETICS MARKET,2021-2031($MILLION)
    FIGURE 38.FRANCE VEGAN COSMETICS MARKET,2021-2031($MILLION)
    FIGURE 39.U.K. VEGAN COSMETICS MARKET,2021-2031($MILLION)
    FIGURE 40.ITALY VEGAN COSMETICS MARKET,2021-2031($MILLION)
    FIGURE 41.SPAIN VEGAN COSMETICS MARKET,2021-2031($MILLION)
    FIGURE 42.REST OF EUROPE VEGAN COSMETICS MARKET,2021-2031($MILLION)
    FIGURE 43.CHINA VEGAN COSMETICS MARKET,2021-2031($MILLION)
    FIGURE 44.JAPAN VEGAN COSMETICS MARKET,2021-2031($MILLION)
    FIGURE 45.INDIA VEGAN COSMETICS MARKET,2021-2031($MILLION)
    FIGURE 46.AUSTRALIA VEGAN COSMETICS MARKET,2021-2031($MILLION)
    FIGURE 47.SOUTH KOREA VEGAN COSMETICS MARKET,2021-2031($MILLION)
    FIGURE 48.REST OF ASIA-PACIFIC VEGAN COSMETICS MARKET,2021-2031($MILLION)
    FIGURE 49.BRAZIL VEGAN COSMETICS MARKET,2021-2031($MILLION)
    FIGURE 50.ARGENTINA VEGAN COSMETICS MARKET,2021-2031($MILLION)
    FIGURE 51.CHILE VEGAN COSMETICS MARKET,2021-2031($MILLION)
    FIGURE 52.SOUTH AFRICA VEGAN COSMETICS MARKET,2021-2031($MILLION)
    FIGURE 53.REST OF LAMEA VEGAN COSMETICS MARKET,2021-2031($MILLION)
    FIGURE 54. TOP WINNING STRATEGIES, BY YEAR
    FIGURE 55. TOP WINNING STRATEGIES, BY DEVELOPMENT
    FIGURE 56. TOP WINNING STRATEGIES, BY COMPANY
    FIGURE 57.PRODUCT MAPPING OF TOP 10 PLAYERS
    FIGURE 58.COMPETITIVE DASHBOARD
    FIGURE 59.COMPETITIVE HEATMAP OF TOP 10 KEY PLAYERS
    FIGURE 60.AMWAY CORPORATION.: NET SALES ,($MILLION)
    FIGURE 61.ESTEE LAUDER COMPANIES INC..: NET SALES ,($MILLION)
    FIGURE 62.GROUPE ROCHER.: NET SALES ,($MILLION)
    FIGURE 63.L'OCCITANE GROUP.: NET SALES ,($MILLION)
    FIGURE 64.L'ORÉAL S.A..: NET SALES ,($MILLION)
    FIGURE 65.LVMH GROUP.: NET SALES ,($MILLION)
    FIGURE 66.MULONDON.: NET SALES ,($MILLION)
    FIGURE 67.PACIFICA BEAUTY.: NET SALES ,($MILLION)
    FIGURE 68.UNILEVER PLC.: NET SALES ,($MILLION)
    FIGURE 69.WELEDA.: NET SALES ,($MILLION)


In terms of value sales, top-level CXOs believe that innovation is the key to the success of the vegan cosmetics market. Customers' increased demand for vegan cosmetics goods has prompted producers to develop herbal or organic skincare products at reasonable rates and in environmentally friendly packaging.

CXOs also stated that the growing awareness of one's physical appearance among individuals and working-class professionals fuels the expansion of the cosmetics sector. The use of natural substances, such as aloevera, tea, and black sugar in cosmetics, decreases the adverse effects of goods, which drives the global expansion of the cosmetics industry. Men are increasingly adopting vegan cosmetic goods in their daily lives, and the use of cosmetics by males is predicted to expand in the future, supplementing the expansion of the global cosmetics business.

Furthermore, vegan cosmetics products have seen widespread popularity in emerging countries such as India, owing to rapid changes in consumer lifestyle and increase in demand for cosmetics produced from natural extracts. Furthermore, the increased penetration of various online portals globally, and the growth in various offers or discounts by manufacturers entice a huge customer base to acquire cosmetic products through online channels. Furthermore, the internet sales channel has expanded customer reach, making it a critical source of revenue for many businesses.

PURCHASE OPTIONS

Call or Email us

U.S.-Canada Toll-free: +1-800-792-5285
Int'l : +1-503-894-6022
Europe : +44-845-528-1300
Email : help@alliedmarketresearch.com
 
FREQUENTLY ASKED QUESTIONS?

A. The global vegan cosmetics market was valued at $16,674.4 million in 2021 and is projected to reach $28,461.0 million by 2031, registering a CAGR of 5.9% from 2022 to 2031.

A. The global vegan cosmetics market registered a CAGR of 5.9% from 2022 to 2031.

A. Raise the query and paste the link of the specific report and our sales executive will revert with the sample.

A. The forecast period in the vegan cosmetics market report is from 2022 to 2031.

A. The top companies that hold the market share in vegan cosmetics market include Estee Lauder Companies Inc., Groupe Rocher, L'Occitane Group, L'Oréal S.A., and Amway Corporation.

A. The vegan cosmetics market report has 5 segments. The segments are product type, price point, gender, end user and distribution channel.

A. The emerging countries in the vegan cosmetics market are likely to grow at a CAGR of more than 9.5% from 2022 to 2031.

A. Post COVID-19, the ease of lockdown had improved the supply chain for vegan cosmetics products and with the increasing population in Asia-Pacific region the demand for vegan cosmetics has improved.

A. North America will dominate the vegan cosmetics market by the end of 2031.

Looking for Customization?

 Customization Request

Have a Question?

 Speak with Analyst

Any Confusion?

 Inquire Before Buying

Have a glance of the Report

  Request Sample
RELATED TAGS

Purchase Full Report of
Vegan Cosmetics Market

Start reading instantly.
This Report and over 68,418+ more Reports, Available with Avenue Library. T&C*.

  • Online Only
  • $3,456
  • Online cloud access only
  • Restricted print, copy, paste & download
  • Read only
  • Free industry update
    (Within 180 days)
  • Free report update in next update cycle
    (May 2023 - May 2024)
  • Data Pack
  • $3,840
  • Restricted to one authorized user
  • One print only
  • Available in
    Excel
  • Free industry update
    (Within 180 days)
  •   Free report update in next update cycle
    (May 2023 - May 2024)
  • Single User
  • $5,769
  • Restricted to one authorized user
  • One print only
  • Available in
    PDF
  • Free industry update
    (Within 180 days)
  •   Free report update in next update cycle
    (May 2023 - May 2024)
  • Five Users
  • $6,450
  • Limited to five authorized users
  • Print upto five copies
  • Available in
    PDF
  • Free industry update
    (Within 180 days)
  •   Free report update in next update cycle
    (May 2023 - May 2024)
  • Enterprise
    License/PDF

  • $10,995
  • Unlimited
    within
    company/enterprise
  • Available in Excel & PDF
  • Free industry update
    (Within 180 days)
  •   Free report update in next update cycle
    (May 2023 - May 2024)
  • Library
    Membership

  • $999 $ 1,175
    Per User/ Per month/ Billed annually
  • Published Content
    E-access
  • Company Profiles
    E-access
  • Newly Added Content Access
  • 10 PDF
    Downloads
  • 5 Excel Data
    Pack Downloads
  • 250 Company Profiles PDF Downloads
  • Buy Now

*Taxes/Fees, if applicable will be added during checkout. All prices in USD

RELATED REPORTS
 

Why Allied Market Research?


Infallible Methodology

To ensure high-level data integrity, accurate analysis, and impeccable forecasts

Analyst Support

For complete satisfaction

Customization

On-demand customization of scope of the report to exactly meet your needs

TARGETED MARKET VIEW

Targeted market view to provide pertinent information and save time of readers

Get fresh content delivered

Get insights on topics that are crucial for your business. Stay abreast of your interest areas.

Get Industry Data Alerts

Why Allied Market Research?

Infallible Methodology

To ensure high-level data integrity, accurate analysis, and impeccable forecasts

Analyst Support

For complete satisfaction

Customization

On-demand customization of scope of the report to exactly meet your needs

TARGETED MARKET VIEW

Targeted market view to provide pertinent information and save time of readers