
Visual Analytics Market Overview
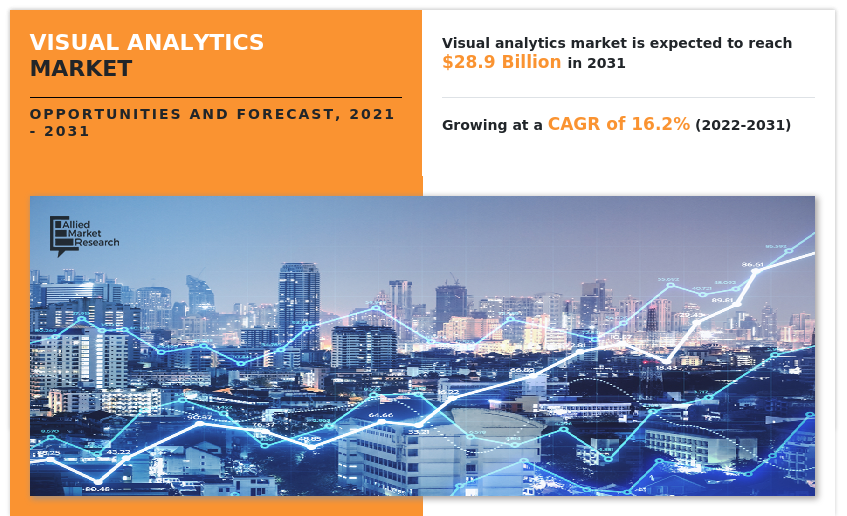
The global visual analytics market was valued at USD 6.5 billion in 2021, and is projected to reach USD 28.9 billion by 2031, growing at a CAGR of 16.2% from 2022 to 2031.
Rise in adoption of advance visualization technology by enterprises and growing demand for analytical tools among enterprises are driving the growth of the market. Moreover, rapid growth in volume and variety of business data are boosting the visual analytics market size. However, high cost of installation and security concern, lack of skilled professionals, and lack of awareness restrict the visual analytics market growth. On the contrary, increased usage of the internet of things (IoT) and the introduction of improved visual analytics are expected to offer remunerative opportunities for expansion of the market during the forecast period.
Key Market Insights
- By enterprise size, the SMEs segment is expected to witness growth at the highest rate during the forecast period.
- By region, Asia-Pacific is expected to witness significant growth during the forecast period.
- By offering, the service segment is expected to grow at the highest rate during the forecast period.
Market Size & Forecast
- 2031 Projected Market Size: USD 28.9 Billion
- 2021 Market Size: USD 6.5 Billion
- Compound Annual Growth Rate (CAGR) (2022-2031): 16.2%
How to Describe Visual Analytics
Visual analytics is the science of analytical reasoning supported by interactive visual interfaces. In addition, it can be seen as an integral approach combining visualization, human factors, and data analysis. Furthermore, visualizing the data in graphs, charts, and maps helps users identify patterns and thereby, develop actionable insights. These insights help organizations make better, data-driven decisions.
Visual Analytics Market Segment Review
The visual analytics market is segmented on the basis of by offering, deployment model, application, enterprise size, industry vertical, and region. On the basis of offering, the market is categorized into solutions and service. On the basis of deployment model, the market is classified into on-premise and cloud. On the basis of application, the market is classified into supply chain, sales and marketing, finance, human resources (HR), and others.
On the basis of enterprise size, the market is classified into large enterprise and SMEs. By industry vertical, it is classified into BFSI, manufacturing, healthcare, government, energy & utilities, transportation, retail & e-commerce, IT & telecom, education, media & entertainment, and others. By region, the market is analyzed across North America, Europe, Asia-Pacific, and LAMEA.
In terms of offering, the solution segment holds the largest visual analytics market share during the forecast period, as it allows end users to simplify the data entry process, data recording, and automation of reports and analysis. However, the service segment is expected to grow at the highest rate during the forecast period, as these services reduce the time and costs associated with optimizing systems in the initial phase of deployment.

Region-wise, the visual analytics market share was dominated by North America in 2021 and is expected to retain its position during the forecast period, owing to technological advancements and emergence of new business models sector and rapid rise of big data, business intelligence (BI), and other associated technologies within end users, which is positively impacting the growth of visual analytics market. However, Asia-Pacific is expected to witness significant growth during the forecast period, due to increase in adoption of internet of things (IoT) and smart technologies, and government initiatives.

What are the Top Impacting Factors in Market
Rise in adoption of advance visualization technology by enterprises
The amount of data generated through various technologies, such as internet of things (IoT) and other data sources is increasing across the globe, owing to better operation management and correct investments. Moreover, visual analytics helps analyze substantial data pool like structured and unstructured data that require additional services.
Furthermore, companies are preferring visual analytics software with advance technologies, such as artificial intelligence (AI), big data, machine learning (ML), and others to handle the amount of data and generate a better and knowledgeable interpretation of statistics. For instance, in July 2021, Atos acquired Visual BI to enhance its ability to address customers’ increasing need for BI and analytics in cloud environments. Such demands are driving the growth of the visual analytics industry.
Growing demand for analytical tools among enterprises
The demand for visual analytics tools is increasing among small enterprises owing to exponential growth of data volumes and analytical complexity in-database. In addition, increasing efficiency of tools and products specializing in data processing is a major reason behind the growth of the visual analytics market. Moreover, companies are beginning to develop in-house tools, designed for specific data analysis purposes.
Furthermore, many entities are using analytical technologies, such as AI, BI, and Hadoop analytics, which in turn is driving the market growth. For example, Hadoop technology is another widely used tool for analysis, which helps to store any kind of data, either structured or unstructured and run applications on clusters of commodity hardware. For instance, in April 2020, Census Day and Tableau Software, together launched U.S. Census Bureau’s 2020 Response Rate Map, to enhance customer experience and data transparency regarding census. Therefore, enterprises are enabling analytical tool to analyze data from multiple sources, which in turn is driving the growth of the visual analytics market.
Which are the Leading Companies in Visual Analytics
The following are the leading companies in the market. These players have adopted various strategies to increase their market penetration and strengthen their position in the industry.
Alteryx, Inc.
DataDeck
Data Clarity
Geckoboard Software
IBM Corporation
Locii Solutions Ltd.
Microsoft Corporation
MicroStrategy Incorporated
Nexidia Inc.
Oracle Corporation
Orbital Insight
Qlik
SAP SE
SAS Institute Inc.
Tableau Software Inc.
TIBCO Software Inc.
Ubiq.
Key Benefits for Stakeholders:
The study provides an in-depth analysis of the global visual analytics market forecast along with current & future trends to explain the imminent investment pockets.
Information about key drivers, restraints, and opportunities and their impact analysis on global visual analytics market trends is provided in the report.
The Porter’s five forces analysis illustrates the potency of the buyers and suppliers operating in the industry.
The visual analytics market analysis from 2022 to 2031 is provided to determine the market potential.
Visual Analytics Market Report Highlights
| Aspects | Details |
| By Offering |
|
| By Enterprise Size |
|
| By Deployment Model |
|
| By Application |
|
| By Industry Vertical |
|
| By Region |
|
| Key Market Players | IBM Corporation, Alteryx, Inc., Qlik, Data Clarity, DataDeck, Tableau Software Inc., Orbital Insight, MicroStrategy Incorporated, Microsoft Corporation, TIBCO Software Inc., Ubiq, Locii Solutions Ltd., Oracle Corporation, SAP SE, SAS Institute Inc., Nexidia Inc., Geckoboard Software |
Analyst Review
Visual analytics software enables a business user to gain a more personalized experience with the data. In addition, exploding data volumes compel the users to deep-dive into such data sets and further discover more insights related to their particular domain. Moreover, visual analytics has some technologies that are used in different industries, such as big data analytics, artificial intelligence (AI), business intelligence (BI), supply chain management, and others.
The global visual analytics market is expected to register high growth due to global attempt of various government agencies to systematize the data security protocols. Moreover, the field of logistics and supply chain is predicted to invest highly in information technology to improve data quality and availability and the supply chain observation provides demand patterns, quality, and customer requirements is expected to drive the market growth. With growth in requirement for visual analytics, various companies have established alliance to increase their capabilities. For instance, in February 2021, Rapid Miner, Inc. had partnership with Hivecell, an Edge-as-a-Service company. This is aimed at allowing users to rapidly generate and operate models with streaming data from the edge. Through the integration, Hivecell’s users would be able to use models built with the Rapid Miner platform to enable AI-optimized decision-making wherever needed.
In addition, with further growth in investment across the world, various companies have expanded their current product portfolio with increased diversification among customers. For instance, in February 2020, RapidMiner, a data science platform that creates and operates artificial intelligence (AI) solutions for maximum business impact, launched a product, RapidMiner 9.6. This update prioritizes people and not technology at the center of the enterprise AI journey, providing new, unique experiences to empower users of varying backgrounds and abilities. For instance, in November 2021, Tableau Software launched expansive visual BI and analytics platform, which helps users to visualize and share data with Tableau Public. These factors are set to accelerate the market growth towards visual analytics in the coming time.
Moreover, with increase in competition, major market players have started acquiring companies to expand their market penetration and reach. For instance, in October 2020, TIBCO Software acquired Information Builders, Inc. (ibi), to expand TIBCO Connected Intelligence with ibi’s broader range of innovative, data-driven solutions to support faster, smarter digital transformations.
The global visual analytics market was valued at USD 6.5 billion in 2021, and is projected to reach USD 28.9 billion by 2031
The global visual analytics market is projected to grow at a compound annual growth rate of 16.2% from 2022 to 2031 to reach USD 28.9 billion by 2031
The key players that operate in the visual analytics market are Alteryx, Inc., DataDeck, Data Clarity, Geckoboard Software, IBM Corporation, Locii Solutions Ltd., Microsoft Corporation, MicroStrategy Incorporated, Nexidia Inc., Oracle Corporation, Orbital Insight, Qlik, SAP SE, SAS Institute Inc., Tableau Software Inc., TIBCO Software Inc., and Ubiq.
North America is the largest regional market for visual analytics.
Rise in adoption of advanced visualization technology by enterprises and growing demand for analytical tools among enterprises are driving the growth of the visual analytics market.
Loading Table Of Content...

