Report Code: A04979 | Jun 2019 | Pages: 218 | ||
Tables: 109 | Charts: 58 |
|
Pandemic disrupted the entire world and affected many industries.
Get detailed COVID-19 impact analysis on the Warm Water Aquaculture Feed Market
Request Now !
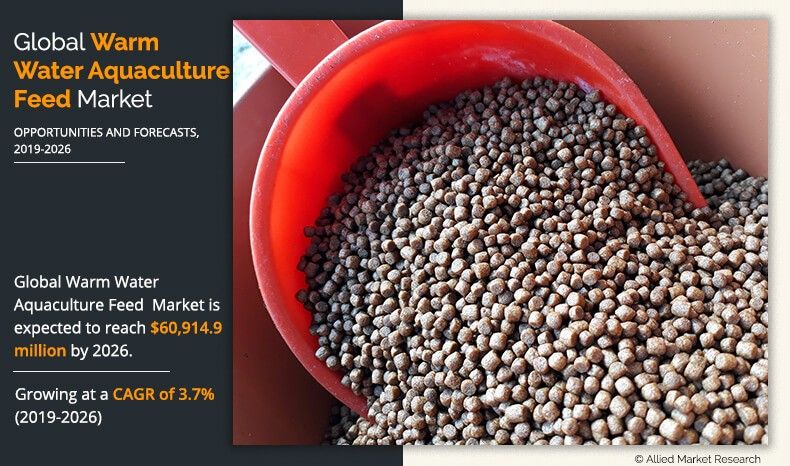
The warm water aquaculture feed market size was valued at $45,696.2 million in 2018, and is expected to reach $60,914.9 million by 2026, registering a CAGR of 3.7% from 2019 to 2026.
Aquatic livestock, such as fish, crustaceans, and shrimps, is a major source of protein in human diet. The major end use applications of warm water aquaculture feed include fish, crustaceans, and shrimps. Fishes and shrimps require specific dietary supplements based on energy, protein, fiber, minerals, vitamin needs, and body chemistry. Warm water aquaculture feed is crucial in stimulating growth, ingredient dispersion, and feed ingestion in diet.
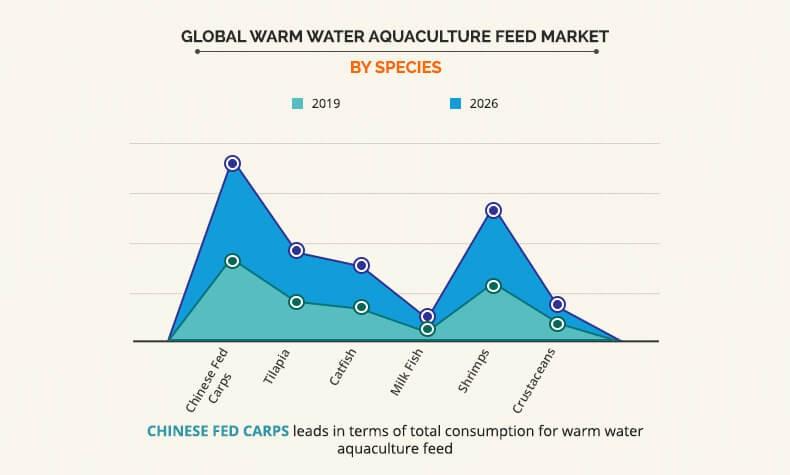
The Chinese fed carps segment dominated the overall warm water aquaculture feed market share in 2018 and is expected to remain dominant during the forecast period. Increase in Chinese fed carps consumption has been perpetual for decades partially due to increase in population along with technical developments in processing, preservation, logistics, and distribution channels. Furthermore, the hardiness and adaptability of carps have encouraged the domestication of this species across the region. In addition, high feed conversion ratio of carp has resulted in widespread adoption of Chinese fed carp for aquaculture which in turn resulting in growth of warm water aquaculture feed market.
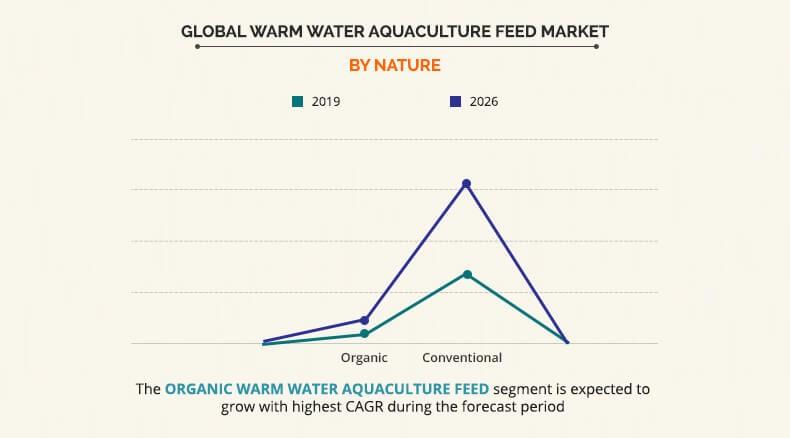
The organic food industry has witnessed significant growth over the past few years. As a result, considerable rise in demand of organic fish has been noticed over the period. Furthermore, consumers are adopting healthy eating practices, such as organic sea food, due to increase in health consciousness, which is expected to boost the market growth. Organic fish species such as black tiger shrimp, Pacific white shrimp, freshwater shrimp, Tilapia Pangasid catfish, and Carp have seen exponential growth in farmed organic fisheries. Therefore, the exponential increase in organic aquaculture attributed to the growing interest in organic farming, better return on investments, government initiatives, and sustainability. However, organic aquaculture still remains a niche segment and various initiates needs to be taken to revolutionize organic warm water aquaculture feed market.
The formulation of warm water aquaculture feed has seen new paradigm shift in the recent years. Function feeds have been developed to cater specific requirements of different fish species. They improve feed utilization, growth, and furthermore general health & stress resistance of fish. In addition, they enhance feed efficiency, disease resistance, growth performance and reduce the cost of production & medication. Therefore, introduction of such feed is expected to fuel the warm water aquaculture market growth in the coming years.
The report focuses on the growth prospects, restraints, and opportunities of the global warm water aquaculture feed market. The study provides Porter’s five forces analysis to understand the impact of various factors such as competitive intensity of competitors, bargaining power of suppliers, threat of substitutes, threat of new entrants, and bargaining power of buyers of the warm water aquaculture feed market.
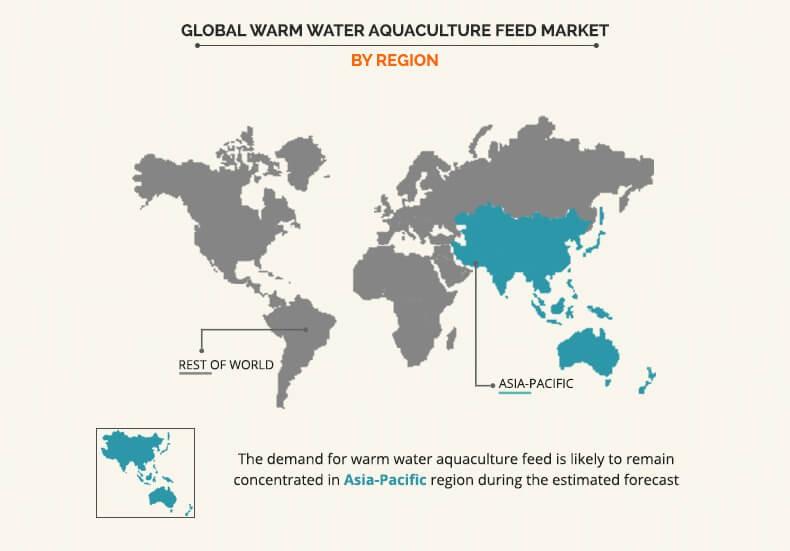
The global warm water aquaculture feed market is segmented based on species, nature, and region. Based on species, the market is classified into Chinese fed carps, tilapia, catfish, milk fish, shrimps, and crustaceans. Based on nature, the market is bifurcated into organic and conventional. Based on region, the market is studied across Asia-Pacific and rest of the World.
Some of the key players operating in the warm water aquaculture feed market include Aller Aqua A/S, Alltech Inc., Beneo, Cargill, Incorporated, Charoen Pokphand Foods PCL, Nutreco N.V., Avanti Feeds Ltd, Biomin Holding GmbH, Biomar Group, and Nutriad.
Top impacting factors
Current and future warm water aquaculture feed industry trends are outlined to determine the overall attractiveness of the warm water aquaculture feed market. Top impacting factors highlight opportunities during the forecast period. Factors such as growth in aquaculture and increase in per capita fish consumption drive the growth of the warm water aquaculture feed market. However, stringent government regulations and increase in raw material cost are anticipated to restrain the market growth.
Regional Outlook
China is dominating the demand for warm water aquaculture feed followed by Indonesia, Vietnam, Bangladesh, and others. The Chinese aquaculture industry holds the overall global leadership position in aquaculture production with total production amounting to more than 57% of the global production for 2016. Favorable government initiatives promoting implementation of "green" certification (eco-certification), better management, and providing professional training will lead improvisation of the Chinese aquaculture industry. Furthermore, development of marine aquaculture, paddy-fish culture, freshwater integrated farming, as well as implementation of participatory community extension services augment the demand for warm water aquaculture feed in the region.
Warm Water Aquaculture Feed Market Report Highlights
Aspects | Details |
---|---|
By SPECIES |
|
By NATURE |
|
By Region |
|
Key Market Players | ALLTECH INC, NUTRECO N.V, BIOMIN HOLDING GMBH, BIOMAR GROUP, CHAROEN POKPHAND FOODS PCL, CARGILL, INCORPORATED, NUTRIAD, ALLER AQUA A/S, AVANTI FEEDS LTD, BENEO |
CHAPTER 1:Â INTRODUCTION
             1.1.   REPORT DESCRIPTION
             1.2.   KEY MARKET SEGMENTS
             1.3.   KEY BENEFITS
             1.4.   RESEARCH METHODOLOGY
                        1.4.1.  Primary research
                        1.4.2.  Secondary research
                        1.4.3.  Analyst tools and models
CHAPTER 2:Â Â Â EXECUTIVE SUMMARY
             2.1.   CXO PERSPECTIVE
CHAPTER 3:Â Â Â MARKET LANDSCAPE
             3.1.   MARKET DEFINITION AND SCOPE
             3.2.   KEY FINDINGS
                        3.2.1.  Top investment pockets
                        3.2.2.  Top winning strategies
             3.3.   PORTER'S FIVE FORCES ANALYSIS
                        3.3.1.  Bargaining power of suppliers
                        3.3.2.  Threat of new entrants
                        3.3.3.  Threat of substitutes
                        3.3.4.  Competitive rivalry
                        3.3.5.  Bargaining power of buyers
             3.4.   MARKET SHARE ANALYSIS/TOP PLAYER POSITIONING
             3.5.   MARKET DYNAMICS
                      3.5.1.    Drivers
                      3.5.2.    Restraints
                      3.5.3.    Opportunities
CHAPTER 4:Â Â WARM WATER AQUACULTURE FEED MARKET BY SPECIES
             4.1.   OVERVIEW
             4.2.    CHINESE FED CARPS
                        4.2.1.  Key market trends, growth factors and opportunities
                        4.2.2.  Market size and forecast by region
                        4.2.3.  Market analysis by country
             4.3.    TILAPIA
                        4.3.1.  Key market trends, growth factors and opportunities
                        4.3.2.  Market size and forecast by region
                        4.3.3.  Market analysis by country
             4.4.    CATFISH
                        4.4.1.  Key market trends, growth factors and opportunities
                        4.4.2.  Market size and forecast by region
                        4.4.3.  Market analysis by country
             4.5.    MILK FISH
                        4.5.1.  Key market trends, growth factors and opportunities
                        4.5.2.  Market size and forecast by region
                        4.5.3.  Market analysis by country
             4.6.    SHRIMPS
                        4.6.1.  Key market trends, growth factors and opportunities
                        4.6.2.  Market size and forecast by region
                        4.6.3.  Market analysis by country
             4.7.    CRUSTACEANS
                        4.7.1.  Key market trends, growth factors and opportunities
                        4.7.2.  Market size and forecast by region
                        4.7.3.  Market analysis by country
CHAPTER 5:Â Â WARM WATER AQUACULTURE FEED MARKET BY NATURE
             5.1.   OVERVIEW
             5.2.    ORGANIC
                        5.2.1.  Key market trends, growth factors and opportunities
                        5.2.2.  Market size and forecast by region
                        5.2.3.  Market analysis by country
             5.3.    CONVENTIONAL
                        5.3.1.  Key market trends, growth factors and opportunities
                        5.3.2.  Market size and forecast by region
                        5.3.3.  Market analysis by country
CHAPTER 6:Â Â Â WARM WATER AQUACULTURE FEED MARKET BY REGION
             6.1.   OVERVIEW
             6.2.  ASIA-PACIFIC
                       6.2.1.  Key market trends and opportunities
                       6.2.2.  Market size and forecast by Species
                       6.2.3.  Market size and forecast by Nature
                       6.2.4.  Market size and forecast by Country
                       6.2.5.  CHINA WARM WATER AQUACULTURE FEED MARKET
                                     6.2.5.1.  Market size and forecast by Species
                                     6.2.5.2.  Market size and forecast by Nature
                       6.2.6.   INDONESIA WARM WATER AQUACULTURE FEED MARKET
                                     6.2.6.1.  Market size and forecast by Species
                                     6.2.6.2.  Market size and forecast by Nature
                       6.2.7.   VIETNAM WARM WATER AQUACULTURE FEED MARKET
                                     6.2.7.1.  Market size and forecast by Species
                                     6.2.7.2.  Market size and forecast by Nature
                       6.2.8.   BANGLADESH WARM WATER AQUACULTURE FEED MARKET
                                     6.2.8.1.  Market size and forecast by Species
                                     6.2.8.2.  Market size and forecast by Nature
                       6.2.9.   THAILAND WARM WATER AQUACULTURE FEED MARKET
                                     6.2.9.1.  Market size and forecast by Species
                                     6.2.9.2.  Market size and forecast by Nature
                       6.2.10.   PHILIPPINES WARM WATER AQUACULTURE FEED MARKET
                                     6.2.10.1.  Market size and forecast by Species
                                     6.2.10.2.  Market size and forecast by Nature
                       6.2.11.   INDIA WARM WATER AQUACULTURE FEED MARKET
                                     6.2.11.1.  Market size and forecast by Species
                                     6.2.11.2.  Market size and forecast by Nature
                       6.2.12.   REST OF ASIA-PACIFIC WARM WATER AQUACULTURE FEED MARKET
                                     6.2.12.1.  Market size and forecast by Species
                                     6.2.12.2.  Market size and forecast by Nature
             6.3.  REST OF WORLD
                       6.3.1.  Key market trends and opportunities
                       6.3.2.  Market size and forecast by Species
                       6.3.3.  Market size and forecast by Nature
                       6.3.4.  Market size and forecast by Country
                       6.3.5.  U.S. WARM WATER AQUACULTURE FEED MARKET
                                     6.3.5.1.  Market size and forecast by Species
                                     6.3.5.2.  Market size and forecast by Nature
                       6.3.6.   MEXICO WARM WATER AQUACULTURE FEED MARKET
                                     6.3.6.1.  Market size and forecast by Species
                                     6.3.6.2.  Market size and forecast by Nature
                       6.3.7.   RUSSIA WARM WATER AQUACULTURE FEED MARKET
                                     6.3.7.1.  Market size and forecast by Species
                                     6.3.7.2.  Market size and forecast by Nature
                       6.3.8.   AFRICA WARM WATER AQUACULTURE FEED MARKET
                                     6.3.8.1.  Market size and forecast by Species
                                     6.3.8.2.  Market size and forecast by Nature
                       6.3.9.   LATIN AMERICA WARM WATER AQUACULTURE FEED MARKET
                                     6.3.9.1.  Market size and forecast by Species
                                     6.3.9.2.  Market size and forecast by Nature
                       6.3.10.   ROW WARM WATER AQUACULTURE FEED MARKET
                                     6.3.10.1.  Market size and forecast by Species
                                     6.3.10.2.  Market size and forecast by Nature
CHAPTER 7:Â Â Â COMPANY PROFILES
             7.1.    ALLER AQUA A/S
                       7.1.1.   Company overview
                       7.1.2.   Business performance
                       7.1.3.   Key strategic moves and developments
             7.2.    ALLTECH INC.
                       7.2.1.   Company overview
                       7.2.2.   Business performance
                       7.2.3.   Key strategic moves and developments
             7.3.    BENEO
                       7.3.1.   Company overview
                       7.3.2.   Business performance
                       7.3.3.   Key strategic moves and developments
             7.4.    CARGILL, INCORPORATED
                       7.4.1.   Company overview
                       7.4.2.   Business performance
                       7.4.3.   Key strategic moves and developments
             7.5.    CHAROEN POKPHAND FOODS PCL
                       7.5.1.   Company overview
                       7.5.2.   Business performance
                       7.5.3.   Key strategic moves and developments
             7.6.    NUTRECO N.V.
                       7.6.1.   Company overview
                       7.6.2.   Business performance
                       7.6.3.   Key strategic moves and developments
             7.7.    AVANTI FEEDS LTD.
                       7.7.1.   Company overview
                       7.7.2.   Business performance
                       7.7.3.   Key strategic moves and developments
             7.8.    BIOMIN HOLDING GMBH
                       7.8.1.   Company overview
                       7.8.2.   Business performance
                       7.8.3.   Key strategic moves and developments
             7.9.    BIOMAR GROUP
                       7.9.1.   Company overview
                       7.9.2.   Business performance
                       7.9.3.   Key strategic moves and developments
             7.10.    NUTRIAD
                       7.10.1.   Company overview
                       7.10.2.   Business performance
                       7.10.3.   Key strategic moves and developments
LIST OF TABLES
TABLE 01. GLOBAL WARM WATER AQUACULTURE FEED MARKET, BY SPECIES, 2018–2026 ($MILLION)
TABLE 02. GLOBAL WARM WATER AQUACULTURE FEED MARKET, BY SPECIES, 2018–2026 (KT)
TABLE 03. CHINESE FED CARP WARM WATER AQUACULTURE FEED CONSUMPTION, BY REGION, 2018-2026 ($ MN)
TABLE 04. CHINESE FED CARP WARM WATER AQUACULTURE FEED CONSUMPTION, BY REGION, 2018-2026 (KT)
TABLE 05. TILAPIA WARM WATER AQUACULTURE FEED CONSUMPTION, BY REGION, 2018-2026 ($ MN)
TABLE 06. TILAPIA WARM WATER AQUACULTURE FEED CONSUMPTION, BY REGION, 2018-2026 KT)
TABLE 07. CATFISH WARM WATER AQUACULTURE FEED CONSUMPTION, BY REGION, 2018-2026 ($ MN)
TABLE 08. CATFISH WARM WATER AQUACULTURE FEED CONSUMPTION, BY REGION, 2018-2026 (KT)
TABLE 09. MILK FISH WARM WATER AQUACULTURE FEED CONSUMPTION, BY REGION, 2018-2026 ($ MN)
TABLE 10. MILK FISH WARM WATER AQUACULTURE FEED CONSUMPTION, BY REGION, 2018-2026 (KT)
TABLE 11. SHRIMPS WARM WATER AQUACULTURE FEED CONSUMPTION, BY REGION, 2018-2026 ($ MN)
TABLE 12. SHRIMPS WARM WATER AQUACULTURE FEED CONSUMPTION, BY REGION, 2018-2026 (KT)
TABLE 13. CRUSTACEANS WARM WATER AQUACULTURE FEED CONSUMPTION, BY REGION, 2018-2026 ($ MN)
TABLE 14. CRUSTACEANS WARM WATER AQUACULTURE FEED CONSUMPTION, BY REGION, 2018-2026 (KT)
TABLE 15. GLOBAL WARM WATER AQUACULTURE FEED MARKET, BY NATURE, 2018–2026 ($MILLION)
TABLE 16. ORGANIC WARM WATER AQUACULTURE FEED MARKET, BY REGION, 2018–2026 ($MILLION)
TABLE 17. CONVENTIONAL WARM WATER AQUACULTURE FEED MARKET, BY REGION, 2018–2026 ($MILLION)
TABLE 18. WARM WATER AQUACULTURE FEED MARKET, BY REGION, 2018–2026 ($MILLION)
TABLE 19. WARM WATER AQUACULTURE FEED MARKET, BY REGION, 2018–2026 (KT)
TABLE 20. ASIA-PACIFIC WARM WATER AQUACULTURE FEED MARKET, BY COUNTRY, 2018-2026 ($MILLION)
TABLE 21. ASIA-PACIFIC WARM WATER AQUACULTURE FEED MARKET, BY SPECIES, 2018–2026 ($MILLION)
TABLE 22. ASIA-PACIFIC WARM WATER AQUACULTURE FEED MARKET, BY SPECIES, 2018–2026 (KT)
TABLE 23. ASIA-PACIFIC WARM WATER AQUACULTURE FEED MARKET, BY NATURE, 2018–2026 ($MILLION)
TABLE 24. CHINA WARM WATER AQUACULTURE FEED MARKET, BY SPECIES, 2018–2026 ($MILLION)
TABLE 25. CHINA WARM WATER AQUACULTURE FEED MARKET, BY SPECIES, 2018–2026 (KT)
TABLE 26. CHINA WARM WATER AQUACULTURE FEED MARKET,BY NATURE 2018–2026 ($MILLION)
TABLE 27. INDONESIA WARM WATER AQUACULTURE FEED MARKET, BY SPECIES, 2018–2026 ($MILLION)
TABLE 28. INDONESIA WARM WATER AQUACULTURE FEED MARKET, BY SPECIES, 2018–2026 (KT)
TABLE 29. INDONESIA WARM WATER AQUACULTURE FEED MARKET,BY NATURE 2018–2026 ($MILLION)
TABLE 30. VIETNAM WARM WATER AQUACULTURE FEED MARKET, BY SPECIES, 2018–2026 ($MILLION)
TABLE 31. VIETNAM WARM WATER AQUACULTURE FEED MARKET, BY SPECIES, 2018–2026 (KT)
TABLE 32. VIETNAM WARM WATER AQUACULTURE FEED MARKET, BY NATURE, 2018–2026 ($MILLION)
TABLE 33. BANGLADESH WARM WATER AQUACULTURE FEED MARKET, BY SPECIES, 2018–2026 ($MILLION)
TABLE 34. BANGLADESH WARM WATER AQUACULTURE FEED MARKET, BY SPECIES, 2018–2026 (KT)
TABLE 35. BANGLADESH WARM WATER AQUACULTURE FEED MARKET, BY NATURE, 2018–2026 ($MILLION)
TABLE 36. THAILAND WARM WATER AQUACULTURE FEED MARKET, BY SPECIES, 2018–2026 ($MILLION)
TABLE 37. THAILAND WARM WATER AQUACULTURE FEED MARKET, BY SPECIES, 2018–2026 (KT)
TABLE 38. THAILAND WARM WATER AQUACULTURE FEED MARKET, BY NATURE, 2018–2026 ($MILLION)
TABLE 39. PHILIPPINES WARM WATER AQUACULTURE FEED MARKET, BY SPECIES, 2018–2026 ($MILLION)
TABLE 40. PHILIPPINES WARM WATER AQUACULTURE FEED MARKET, BY SPECIES, 2018–2026 (KT)
TABLE 41. PHILIPPINES WARM WATER AQUACULTURE FEED MARKET, BY NATURE, 2018–2026 ($MILLION)
TABLE 42. INDIA WARM WATER AQUACULTURE FEED MARKET, BY SPECIES, 2018–2026 ($MILLION)
TABLE 43. INDIA WARM WATER AQUACULTURE FEED MARKET, BY SPECIES, 2018–2026 (KT)
TABLE 44. INDIA WARM WATER AQUACULTURE FEED MARKET, BY NATURE, 2018–2026 ($MILLION)
TABLE 45. REST OF ASIA-PACIFIC WARM WATER AQUACULTURE FEED MARKET, BY SPECIES, 2018–2026 ($MILLION)
TABLE 46. REST OF ASIA-PACIFIC WARM WATER AQUACULTURE FEED MARKET, BY SPECIES, 2018–2026 (KT)
TABLE 47. REST OF ASIA-PACIFIC WARM WATER AQUACULTURE FEED MARKET, BY NATURE, 2018–2026 ($MILLION)
TABLE 48. REST OF WORLD WARM WATER AQUACULTURE FEED MARKET, BY COUNTRY, 2018-2026 ($MILLION)
TABLE 49. REST OF WORLD WARM WATER AQUACULTURE FEED MARKET, BY SPECIES, 2018–2026 ($MILLION)
TABLE 50. REST OF WORLD WARM WATER AQUACULTURE FEED MARKET, BY SPECIES, 2018–2026 (KT)
TABLE 51. REST OF WORLD WARM WATER AQUACULTURE FEED MARKET, BY NATURE, 2018–2026 ($MILLION)
TABLE 52. U.S. WARM WATER AQUACULTURE FEED MARKET, BY SPECIES, 2018–2026 ($MILLION)
TABLE 53. U.S. WARM WATER AQUACULTURE FEED MARKET, BY SPECIES, 2018–2026 (KT)
TABLE 54. U.S. WARM WATER AQUACULTURE FEED MARKET,BY NATURE, 2018–2026 ($MILLION)
TABLE 55. MEXICO WARM WATER AQUACULTURE FEED MARKET, BY SPECIES, 2018–2026 ($MILLION)
TABLE 56. MEXICO WARM WATER AQUACULTURE FEED MARKET, BY SPECIES, 2018–2026 (KT)
TABLE 57. MEXICO WARM WATER AQUACULTURE FEED MARKET,BY NATURE, 2018–2026 ($MILLION)
TABLE 58. RUSSIA WARM WATER AQUACULTURE FEED MARKET, BY SPECIES, 2018–2026 ($MILLION)
TABLE 59. RUSSIA WARM WATER AQUACULTURE FEED MARKET, BY SPECIES, 2018–2026 (KT)
TABLE 60. RUSSIA WARM WATER AQUACULTURE FEED MARKET,BY NATURE, 2018–2026 ($MILLION)
TABLE 61. AFRICA WARM WATER AQUACULTURE FEED MARKET, BY SPECIES, 2018–2026 ($MILLION)
TABLE 62. AFRICA WARM WATER AQUACULTURE FEED MARKET, BY SPECIES, 2018–2026 (KT)
TABLE 63. AFRICA WARM WATER AQUACULTURE FEED MARKET,BY NATURE, 2018–2026 ($MILLION)
TABLE 64. LATIN AMERICA WARM WATER AQUACULTURE FEED MARKET, BY SPECIES, 2018–2026 ($MILLION)
TABLE 65. LATIN AMERICA WARM WATER AQUACULTURE FEED MARKET, BY SPECIES, 2018–2026 (KT)
TABLE 66. LATIN AMERICA WARM WATER AQUACULTURE FEED MARKET,BY NATURE 2018–2026 ($MILLION)
TABLE 67. ROW WARM WATER AQUACULTURE FEED MARKET, BY SPECIES, 2018–2026 ($MILLION)
TABLE 68. ROW WARM WATER AQUACULTURE FEED MARKET, BY SPECIES, 2018–2026 (KT)
TABLE 69. ROW WARM WATER AQUACULTURE FEED MARKET,BY NATURE 2018–2026 ($MILLION)
TABLE 70. ALLER AQUA GROUP: KEY EXECUTIVES
TABLE 71. ALLER AQUA GROUP: COMPANY SNAPSHOT
TABLE 72. ALLER AQUA GROUP: PRODUCT PORTFOLIO
TABLE 73. ALLTECH, INC.: KEY EXECUTIVES
TABLE 74. ALLTECH, INC.: COMPANY SNAPSHOT
TABLE 75. ALLTECH, INC.: PRODUCT PORTFOLIO
TABLE 76. AVANTI FEEDS LIMITED: KEY EXECUTIVES
TABLE 77. AVANTI FEEDS LIMITED: COMPANY SNAPSHOT
TABLE 78. AVANTI FEEDS LIMITED: OPERATING SEGMENTS
TABLE 79. AVANTI FEEDS LIMITED: PRODUCT PORTFOLIO
TABLE 80. BENEO GMBH: COMPANY SNAPSHOT
TABLE 81. BENEO GMBH: PRODUCT PORTFOLIO
TABLE 82. BIOMAR GROUP: KEY EXECUTIVES
TABLE 83. BIOMAR GROUP: COMPANY SNAPSHOT
TABLE 84. BIOMAR GROUP: PRODUCT PORTFOLIO
TABLE 85. BIOMIN HOLDING GMBH: KEY EXECUTIVES
TABLE 86. BIOMIN HOLDING GMBH: COMPANY SNAPSHOT
TABLE 87. BIOMIN HOLDING GMBH: PRODUCT PORTFOLIO
TABLE 88. BLUESTAR ADISSEO CO., LTD.: KEY EXECUTIVES
TABLE 89. BLUESTAR ADISSEO CO., LTD.: COMPANY SNAPSHOT
TABLE 90. BLUESTAR ADISSEO CO., LTD.: OPERATING SEGMENTS
TABLE 91. BLUESTAR ADISSEO CO., LTD.: PRODUCT PORTFOLIO
TABLE 92. CARGILL INC.:KEY EXECUTIVES
TABLE 93. CARGILL INC.: COMPANY SNAPSHOT
TABLE 94. CARGILL INC.: OPERATING SEGMENTS
TABLE 95. CARGILL INC.: PRODUCT PORTFOLIO
TABLE 96. CPF: KEY EXECUTIVES
TABLE 97. CPF: COMPANY SNAPSHOT
TABLE 98. CPF: OPERATING SEGMENTS
TABLE 99. CPF: PRODUCT PORTFOLIO
TABLE 100. NUTRECO N.V.: KEY EXECUTIVES
TABLE 101. NUTRECO N.V.: COMPANY SNAPSHOT
TABLE 102. NUTRECO N.V.: PRODUCT PORTFOLIO
TABLE 103. DAINICHI CORPORATION: COMPANY SNAPSHOT
TABLE 104. DAINICHI CORPORATION: OPERATING SEGMENTS
TABLE 105. DAINICHI CORPORATION: PRODUCT PORTFOLIO
TABLE 106. BERNAQUA: COMPANY SNAPSHOT
TABLE 107. BERNAQUA: PRODUCT PORTFOLIO
TABLE 108. AQUA GARANT: COMPANY SNAPSHOT
TABLE 109. AQUA GARANT: PRODUCT PORTFOLIO
LIST OF FIGURES
FIGURE 01. GLOBAL WARM WATER AQUACULTURE FEED MARKET
FIGURE 02. TOP IMPACTING FACTORS
FIGURE 03. TOP INVESTMENT POCKETS
FIGURE 04. MODERATE BARGAINING POWER OF SUPPLIERS
FIGURE 05. MODERATE BARGAINING POWER OF BUYERS
FIGURE 06. LOW THREAT OF NEW ENTRANTS
FIGURE 07. LOW THREAT OF SUBSTITUTES
FIGURE 08. MODERATE INTENSITY OF COMPETITIVE RIVALRY
FIGURE 09. VALUE CHAIN ANALYSIS
FIGURE 10. GLOBAL WARM WATER AQUACULTURE FEED MARKET: DRIVERS, RESTRAINTS, AND OPPORTUNITIES, 2018–2026
FIGURE 11. GLOBAL WARM WATER AQUACULTURE FEED MARKET SHARE, BY SPECIES, 2018–2026
FIGURE 12. COMPARATIVE SHARE ANALYSIS OF CHINESE FED CARP WARM WATER AQUACULTURE FEED MARKET, BY COUNTRY, 2018 & 2026 (%)
FIGURE 13. COMPARATIVE SHARE ANALYSIS OF TILAPIA WARM WATER AQUACULTURE FEED MARKET, BY COUNTRY, Â 2018 & 2026 (%)
FIGURE 14. COMPARATIVE SHARE ANALYSIS OF CATFISH WARM WATER AQUACULTURE FEED MARKET, BY COUNTRY, Â 2018 & 2026 (%)
FIGURE 15. COMPARATIVE SHARE ANALYSIS OF MILK FISH WARM WATER AQUACULTURE FEED MARKET, BY COUNTRY, Â 2018 & 2026 (%)
FIGURE 16. COMPARATIVE SHARE ANALYSIS OF SHRIMPS WARM WATER AQUACULTURE FEED MARKET, BY COUNTRY, Â 2018 & 2026 (%)
FIGURE 17. COMPARATIVE SHARE ANALYSIS OF CRUSTACEANS WARM WATER AQUACULTURE FEED MARKET, BY COUNTRY, 2018 & 2026 (%)
FIGURE 18. GLOBAL WARM WATER AQUACULTURE FEED MARKET, BY NATURE, 2018–2026
FIGURE 19. COMPARATIVE SHARE ANALYSIS OF ORGANIC WARM WATER AQUACULTURE FEED MARKET BY COUNTRY, Â 2018 & 2026 (%)
FIGURE 20. COMPARATIVE SHARE ANALYSIS OF CONVENTIONAL WARM WATER AQUACULTURE FEED MARKET, BY COUNTRY, 2018 & 2026 (%)
FIGURE 21. WARM WATER AQUACULTURE FEED MARKET SHARE, BY REGION, 2018–2026
FIGURE 22. CHINA WARM WATER AQUACULTURE FEED MARKET REVENUE, 2018–2026 ($MILLION)
FIGURE 23. INDONESIA WARM WATER AQUACULTURE FEED MARKET REVENUE, 2018–2026 ($MILLION)
FIGURE 24. VIETNAM WARM WATER AQUACULTURE FEED MARKET REVENUE, 2018–2026 ($MILLION)
FIGURE 25. BANGLADESH WARM WATER AQUACULTURE FEED MARKET REVENUE, 2018–2026 ($MILLION)
FIGURE 26. THAILAND WARM WATER AQUACULTURE FEED MARKET REVENUE, 2018–2026 ($MILLION)
FIGURE 27. PHILIPPINES WARM WATER AQUACULTURE FEED MARKET REVENUE, 2018–2026 ($MILLION)
FIGURE 28. INDIA WARM WATER AQUACULTURE FEED MARKET REVENUE, 2018–2026 ($MILLION)
FIGURE 29. REST OF ASIA-PACIFIC WARM WATER AQUACULTURE FEED MARKET REVENUE, 2018–2026 ($MILLION)
FIGURE 30. U.S. WARM WATER AQUACULTURE FEED MARKET REVENUE, 2018–2026 ($MILLION)
FIGURE 31. MEXICO WARM WATER AQUACULTURE FEED MARKET REVENUE, 2018–2026 ($MILLION)
FIGURE 32. RUSSIA WARM WATER AQUACULTURE FEED MARKET REVENUE, 2018–2026 ($MILLION)
FIGURE 33. AFRICA WARM WATER AQUACULTURE FEED MARKET REVENUE, 2018–2026 ($MILLION)
FIGURE 34. LATIN AMERICA WARM WATER AQUACULTURE FEED MARKET REVENUE, 2018–2026 ($MILLION)
FIGURE 35. ROW WARM WATER AQUACULTURE FEED MARKET REVENUE, 2018–2026 ($MILLION)
FIGURE 36. MARKET PLAYER POSITIONING, 2018
FIGURE 37. TOP WINNING STRATEGIES, BY YEAR, 2016–2019
FIGURE 38. TOP WINNING STRATEGIES, BY DEVELOPMENT, 2016–2019 (%)
FIGURE 39. TOP WINNING STRATEGIES, BY COMPANY, 2016–2019
FIGURE 40. COMPETITIVE HEATMAP OF KEY PLAYERS
FIGURE 41. COMPETITIVE DASHBOARD
FIGURE 42. AVANTI FEEDS LIMITED: NET SALES, 2016–2018 ($MILLION)
FIGURE 43. AVANTI FEEDS LIMITED: REVENUE SHARE BY SEGMENT, 2018 (%)
FIGURE 44. BIOMAR GROUP: NET SALES, 2016–2018 ($MILLION)
FIGURE 45. BLUESTAR ADISSEO CO., LTD.: R&D EXPENDITURE, 2016–2018 ($MILLION)
FIGURE 46. BLUESTAR ADISSEO CO., LTD.: NET SALES, 2016–2018 ($MILLION)
FIGURE 47. BLUESTAR ADISSEO CO., LTD.: REVENUE SHARE BY PRODUCT CATEGORY, 2018 (%)
FIGURE 48. BLUESTAR ADISSEO CO., LTD.: REVENUE SHARE BY REGION, 2018 (%)
FIGURE 49. CARGILL INC.: NET SALES, 2016–2018 ($MILLION)
FIGURE 50. CARGILL INC.: REVENUE SHARE BY REGION, 2018 (%)
FIGURE 51. CPF: NET SALES, 2016–2018 ($MILLION)
FIGURE 52. CPF: REVENUE SHARE BY SEGMENT, 2018 (%)
FIGURE 53. CPF: REVENUE SHARE BY REGION, 2018 (%)
FIGURE 54. NUTRECO N.V.: NET SALES, 2016–2018 ($MILLION)
FIGURE 55. KEY EXECUTIVES
FIGURE 56. R&D EXPENDITURE, 2016–2018 ($MILLION)
FIGURE 57. DAINICHI CORPORATION: NET SALES, 2016–2018 ($MILLION)
FIGURE 58. KEY EXECUTIVES
The aquaculture production has witnessed considerable growth over the past few years. Similarly, there has been significant increase in the demand for aquaculture feed. The changing cost dynamics and shifting preferences from capturing fish to aquaculture will leave a significant global imprint, particularly on the aquaculture feed market.
Increase in disposable income and rise in popularity of warm water fish have resulted in widespread consumption of warm water fish and shrimps across the world, thereby boosting the market growth. Furthermore, expansion of the aquaculture industry, rise in per capita fish consumption, availability and flexibility in the usage of alternative raw materials drive the overall warm water aquaculture feed market. However, increase in cost of raw materials and regulatory framework & interference restrains the market growth.
The demand for warmwater aquaculture feed is highly concentrated in Asia-Pacific region. As a result, leading players are expanding their manufacturing in South East Asia. For instance, Cargill has expanded its production capacity of aquaculture feed to cater to domestic and regional demand for warmwater aquaculture feed species, such as tilapia and shrimp. Expansion of production capabilities is the top winning strategy adopted by stakeholders operating in the warm water aquaculture feed market.
Start reading instantly.
This Report and over 68,439+ more Reports, Available with Avenue Library. T&C*.
Enterprise
License/PDF
Library
Membership
*Taxes/Fees, if applicable will be added during checkout. All prices in USD
To ensure high-level data integrity, accurate analysis, and impeccable forecasts
For complete satisfaction
On-demand customization of scope of the report to exactly meet your needs
Targeted market view to provide pertinent information and save time of readers
Get insights on topics that are crucial for your business. Stay abreast of your interest areas.
Get Industry Data AlertsTo ensure high-level data integrity, accurate analysis, and impeccable forecasts
For complete satisfaction
On-demand customization of scope of the report to exactly meet your needs
Targeted market view to provide pertinent information and save time of readers