0
2022
Wearable Technology Market

Wearable Technology Market

by Device (Fitness, Smart Watches, Smart Glasses, Smart Clothing, Others), by Product Type (Wrist Wear, Eyewear, Hearables, Neckwear, Bodywear, Others), by Application (Lifestyle, Consumer Applications, Entertainment, Healthcare, Fitness And Sports, Defense, Enterprise): Global Opportunity Analysis and Industry Forecast, 2020-2031

✷  Report Code: A00264
Mar 2022 | Pages: 196
Tables: 167
Charts: 65
  • Formats*:

  • pdf

    Single User License, Five User
    License & Enterprise User License

  • xls

    Data Pack Excel License

  • ppt

    It comes with the additional cost
    of $2500.00 contact sales.


Wearable Technology Market Research, 2031

The global Wearable Technology Market Size was valued at $54,841.40 million in 2020, and is projected to reach $184,403.60 million by 2031, growing at a CAGR of 12.8% from 2022 to 2031.Wearable technology market witnesses increase in adoption owing to factors, such as ease of use, flexibility, and convenience. Moreover, it provides real time data monitoring, operational efficiency, and fitness tracking, which further supports the market growth.

The impact of COVID-19 on the wearable segment had a huge significant impact in 2020, majorly in the first half of the year. This is attributed to the supply chain disruption owing to the COVID-19 restrictions and governmental regulations. Furthermore, Asia-Pacific countries, such as India, China, Taiwan, South Korea, and Japan have substantial availability of manufacturers for raw materials utilized in wearable products. Manufacturing has foreseen lockdown, which have impacted their production schedules. Therefore, the sales dropped down amid the lockdown in major global economies, which has resulted in limited deliveries and drop in sales ratio.

Wearable Technology Market, Wearable Technology Market, Wearable Technology Market Size, Wearable Technology Market Share, Wearable Technology Market Growth, Wearable Technology Market Trends, Wearable Technology Market Analysis, Wearable Technology Market Forecast

The deployment of miniature sensors into fabrics, smart watches compatibility to interact with social media, in store merchandising, and ease of payment with wearable are some of the classic examples of advancement in wearable technology. The adoption of smart watches has revolutionized watches to possess the characteristic of being multifunctional. Soon, users are expected to prefer smart watches to their analog counterparts, due to technological advancements. Wearable devices companies invest heavily in R&D to devise optimum solutions to gain a higher market share. Growth in technological features and advancements is expected to drive the wearable technology market during the forecast period.

Factors affecting the wearable technology market include, entry of large players, portable and convenient usage, increase in healthcare awareness, and technological advancements. These major factors have boosted the adoption of wearable devices across various industries, such as healthcare, defense, entertainment, industries and enterprises, and others. Wearable devices, such as smart watches, activity trackers, and smart clothing are preferred among consumers, owing to their various benefits, including portable usage and latest technological advancements.

Wearable devices enable a user to check health-related content on their smart wearable. Obesity has become a major issue in many regions and therefore, people prefer wearable technology for checking health and fitness data.

The application for wearables is influenced by increased implementation across various verticals. Moreover, the technological advancements in software & hardware components, and their increased adoption in fitness, healthcare, and defense supports the Wearable Technology Market Growth. However, limited battery life and security concerns restrict the adoption of wearables in the wearable technology industry.

Wearables are used in various industries, such as defense, consumer applications, lifestyle, fitness and sports, enterprise and industrial, and others. Increase in awareness about the benefits of wearables and technological advancement is expected to drive the growth of the market.

Segment Overview

The wearable technology market is segmented on the basis of device, product type, application, and region. On the basis of product type the market is divided into wrist wear, eyewear, hearable, neckwear, body wear, and others. On the basis of device, the market is categorized into smart watches, fitness and wellness devices, smart glasses, smart clothing, and others. On the basis of application, the market is further classified into lifestyle, consumer applications, entertainment, healthcare, fitness and sports, defense, enterprise and industrial. On the basis of region, the market is divided into North America, Europe, Asia-Pacific, and LAMEA. Various countries covered under each region are studied and analyzed to identify the major trends demonstrated by these respective regions. North America dominated the market in 2020, followed by Europe. North America extensively uses wearable technology in various application areas. However, this technology is in their emerging state in developing countries.

On the basis of device fitness segment dominated the market owing to the growing consumer awareness towards health and wellbeing.

Wearable Technology Market

On the basis of product type the wrist wear segment has the major Wearable Technology Market Share in the year 2020 as it is easily accessible in nature and thus attracting more and more customers to buy wrist wear smart products. 

Wearable Technology Market

On the basis of application fitness & sports segment has domainted the market owing to the growing adoption of fitness products among the customers and also due to rise in customer interest towards sports and sports related products. 

Wearable Technology Market

Region wide North America has dominated the global market in the year 2020 however, Asia-Pacific is likely to be the fastest growing region during the Wearable Technology Market Forecast period owing to the rising standard of living, rapid urbanization and growing disposable income. 

Wearable Technology Market

Key players profiled in the report include Apple Inc., Fitbit, Inc., Garmin Ltd., Adidas AG., Nike Inc., Samsung Electronics Co., Ltd., Sony Corporation, Huawei Technologies Co., Ltd., LG Electronics Inc., and Motorola Solutions Inc.

Key Benefits For Stakeholders

  • This report provides a quantitative analysis of the market segments, current trends, estimations, and dynamics of the wearable technology market analysis from 2020 to 2031 to identify the prevailing wearable technology market opportunities.
  • The market research is offered along with information related to key drivers, restraints, and opportunities.
  • Porter's five forces analysis highlights the potency of buyers and suppliers to enable stakeholders make profit-oriented business decisions and strengthen their supplier-buyer network.
  • In-depth analysis of the wearable technology market segmentation assists to determine the prevailing market opportunities.
  • Major countries in each region are mapped according to their revenue contribution to the global market.
  • Market player positioning facilitates benchmarking and provides a clear understanding of the present position of the market players.
  • The report includes the analysis of the regional as well as global wearable technology market trends, key players, market segments, application areas, and market growth strategies.

Wearable Technology Market Report Highlights

Aspects Details
By Device
  • Fitness
  • Smart Watches
  • Smart Glasses
  • Smart Clothing
  • Others
By Product Type
  • Wrist Wear
  • Eyewear
  • Hearables
  • Neckwear
  • Bodywear
  • Others
By Application
  • Lifestyle
  • Consumer Applications
  • Entertainment
  • Healthcare
  • Fitness And Sports
  • Defense
  • Enterprise
By Region
  • North America  (U.S., Canada, Mexico)
  • Europe  (U.K., Germany, France, Italy, Spain, Rest of Europe)
  • Asia-Pacific  (China, Japan, India, Asean, Australia, Rest of Asia-Pacific)
  • LAMEA  (Brazil, South Africa,, Saudi Arabia, Turkey, Rest of LAMEA)
Key Market Players Nike Inc., Huawei Technologies Co., Ltd., Samsung Electronics Co., Ltd., Adidas AG., Apple Inc., Garmin Ltd., LG Electronics Inc., Motorola Solutions Inc, Fitbit, Inc., Sony Corporation
 
  • CHAPTER 1:INTRODUCTION

    • 1.1.Report description

    • 1.2.Key market segments

    • 1.3.Key benefits to the stakeholders

    • 1.4.Research Methodology

      • 1.4.1.Secondary research

      • 1.4.2.Primary research

      • 1.4.3.Analyst tools and models

  • CHAPTER 2:EXECUTIVE SUMMARY

    • 2.1.Key findings of the study

    • 2.2.CXO Perspective

  • CHAPTER 3:MARKET OVERVIEW

    • 3.1.Market definition and scope

    • 3.2.Key findings

      • 3.2.1.Top investment pockets

    • 3.3.Porter’s five forces analysis

    • 3.4.Top player positioning

    • 3.5.Market dynamics

      • 3.5.1.Drivers

      • 3.5.2.Restraints

      • 3.5.3.Opportunities

    • 3.6.COVID-19 Impact Analysis on the market

    • 3.7.Pricing Analysis

  • CHAPTER 4: WEARABLE TECHNOLOGY MARKET, BY DEVICE

    • 4.1 Overview

      • 4.1.1 Market size and forecast

    • 4.2 Fitness

      • 4.2.1 Key market trends, growth factors and opportunities

      • 4.2.2 Market size and forecast, by region

      • 4.2.3 Market analysis by country

    • 4.3 Smart Watches

      • 4.3.1 Key market trends, growth factors and opportunities

      • 4.3.2 Market size and forecast, by region

      • 4.3.3 Market analysis by country

    • 4.4 Smart Glasses

      • 4.4.1 Key market trends, growth factors and opportunities

      • 4.4.2 Market size and forecast, by region

      • 4.4.3 Market analysis by country

    • 4.5 Smart Clothing

      • 4.5.1 Key market trends, growth factors and opportunities

      • 4.5.2 Market size and forecast, by region

      • 4.5.3 Market analysis by country

    • 4.6 Others

      • 4.6.1 Key market trends, growth factors and opportunities

      • 4.6.2 Market size and forecast, by region

      • 4.6.3 Market analysis by country

  • CHAPTER 5: WEARABLE TECHNOLOGY MARKET, BY PRODUCT TYPE

    • 5.1 Overview

      • 5.1.1 Market size and forecast

    • 5.2 Wrist Wear

      • 5.2.1 Key market trends, growth factors and opportunities

      • 5.2.2 Market size and forecast, by region

      • 5.2.3 Market analysis by country

    • 5.3 Eyewear

      • 5.3.1 Key market trends, growth factors and opportunities

      • 5.3.2 Market size and forecast, by region

      • 5.3.3 Market analysis by country

    • 5.4 Hearables

      • 5.4.1 Key market trends, growth factors and opportunities

      • 5.4.2 Market size and forecast, by region

      • 5.4.3 Market analysis by country

    • 5.5 Neckwear

      • 5.5.1 Key market trends, growth factors and opportunities

      • 5.5.2 Market size and forecast, by region

      • 5.5.3 Market analysis by country

    • 5.6 Bodywear

      • 5.6.1 Key market trends, growth factors and opportunities

      • 5.6.2 Market size and forecast, by region

      • 5.6.3 Market analysis by country

    • 5.7 Others

      • 5.7.1 Key market trends, growth factors and opportunities

      • 5.7.2 Market size and forecast, by region

      • 5.7.3 Market analysis by country

  • CHAPTER 6: WEARABLE TECHNOLOGY MARKET, BY APPLICATION

    • 6.1 Overview

      • 6.1.1 Market size and forecast

    • 6.2 Lifestyle

      • 6.2.1 Key market trends, growth factors and opportunities

      • 6.2.2 Market size and forecast, by region

      • 6.2.3 Market analysis by country

    • 6.3 Consumer Applications

      • 6.3.1 Key market trends, growth factors and opportunities

      • 6.3.2 Market size and forecast, by region

      • 6.3.3 Market analysis by country

    • 6.4 Entertainment

      • 6.4.1 Key market trends, growth factors and opportunities

      • 6.4.2 Market size and forecast, by region

      • 6.4.3 Market analysis by country

    • 6.5 Healthcare

      • 6.5.1 Key market trends, growth factors and opportunities

      • 6.5.2 Market size and forecast, by region

      • 6.5.3 Market analysis by country

    • 6.6 Fitness And Sports

      • 6.6.1 Key market trends, growth factors and opportunities

      • 6.6.2 Market size and forecast, by region

      • 6.6.3 Market analysis by country

    • 6.7 Defense

      • 6.7.1 Key market trends, growth factors and opportunities

      • 6.7.2 Market size and forecast, by region

      • 6.7.3 Market analysis by country

    • 6.8 Enterprise

      • 6.8.1 Key market trends, growth factors and opportunities

      • 6.8.2 Market size and forecast, by region

      • 6.8.3 Market analysis by country

  • CHAPTER 7: WEARABLE TECHNOLOGY MARKET, BY REGION

    • 7.1 Overview

      • 7.1.1 Market size and forecast

    • 7.2 North America

      • 7.2.1 Key trends and opportunities

      • 7.2.2 North America Market size and forecast, by Device

      • 7.2.3 North America Market size and forecast, by Product Type

      • 7.2.4 North America Market size and forecast, by Application

      • 7.2.5 North America Market size and forecast, by country

        • 7.2.5.1 U.S.
          • 7.2.5.1.1 Market size and forecast, by Device
          • 7.2.5.1.2 Market size and forecast, by Product Type
          • 7.2.5.1.3 Market size and forecast, by Application
        • 7.2.5.2 Canada
          • 7.2.5.2.1 Market size and forecast, by Device
          • 7.2.5.2.2 Market size and forecast, by Product Type
          • 7.2.5.2.3 Market size and forecast, by Application
        • 7.2.5.3 Mexico
          • 7.2.5.3.1 Market size and forecast, by Device
          • 7.2.5.3.2 Market size and forecast, by Product Type
          • 7.2.5.3.3 Market size and forecast, by Application
    • 7.3 Europe

      • 7.3.1 Key trends and opportunities

      • 7.3.2 Europe Market size and forecast, by Device

      • 7.3.3 Europe Market size and forecast, by Product Type

      • 7.3.4 Europe Market size and forecast, by Application

      • 7.3.5 Europe Market size and forecast, by country

        • 7.3.5.1 U.K.
          • 7.3.5.1.1 Market size and forecast, by Device
          • 7.3.5.1.2 Market size and forecast, by Product Type
          • 7.3.5.1.3 Market size and forecast, by Application
        • 7.3.5.2 Germany
          • 7.3.5.2.1 Market size and forecast, by Device
          • 7.3.5.2.2 Market size and forecast, by Product Type
          • 7.3.5.2.3 Market size and forecast, by Application
        • 7.3.5.3 France
          • 7.3.5.3.1 Market size and forecast, by Device
          • 7.3.5.3.2 Market size and forecast, by Product Type
          • 7.3.5.3.3 Market size and forecast, by Application
        • 7.3.5.4 Italy
          • 7.3.5.4.1 Market size and forecast, by Device
          • 7.3.5.4.2 Market size and forecast, by Product Type
          • 7.3.5.4.3 Market size and forecast, by Application
        • 7.3.5.5 Spain
          • 7.3.5.5.1 Market size and forecast, by Device
          • 7.3.5.5.2 Market size and forecast, by Product Type
          • 7.3.5.5.3 Market size and forecast, by Application
        • 7.3.5.6 Rest of Europe
          • 7.3.5.6.1 Market size and forecast, by Device
          • 7.3.5.6.2 Market size and forecast, by Product Type
          • 7.3.5.6.3 Market size and forecast, by Application
    • 7.4 Asia-Pacific

      • 7.4.1 Key trends and opportunities

      • 7.4.2 Asia-Pacific Market size and forecast, by Device

      • 7.4.3 Asia-Pacific Market size and forecast, by Product Type

      • 7.4.4 Asia-Pacific Market size and forecast, by Application

      • 7.4.5 Asia-Pacific Market size and forecast, by country

        • 7.4.5.1 China
          • 7.4.5.1.1 Market size and forecast, by Device
          • 7.4.5.1.2 Market size and forecast, by Product Type
          • 7.4.5.1.3 Market size and forecast, by Application
        • 7.4.5.2 Japan
          • 7.4.5.2.1 Market size and forecast, by Device
          • 7.4.5.2.2 Market size and forecast, by Product Type
          • 7.4.5.2.3 Market size and forecast, by Application
        • 7.4.5.3 India
          • 7.4.5.3.1 Market size and forecast, by Device
          • 7.4.5.3.2 Market size and forecast, by Product Type
          • 7.4.5.3.3 Market size and forecast, by Application
        • 7.4.5.4 Asean
          • 7.4.5.4.1 Market size and forecast, by Device
          • 7.4.5.4.2 Market size and forecast, by Product Type
          • 7.4.5.4.3 Market size and forecast, by Application
        • 7.4.5.5 Australia
          • 7.4.5.5.1 Market size and forecast, by Device
          • 7.4.5.5.2 Market size and forecast, by Product Type
          • 7.4.5.5.3 Market size and forecast, by Application
        • 7.4.5.6 Rest of Asia-Pacific
          • 7.4.5.6.1 Market size and forecast, by Device
          • 7.4.5.6.2 Market size and forecast, by Product Type
          • 7.4.5.6.3 Market size and forecast, by Application
    • 7.5 LAMEA

      • 7.5.1 Key trends and opportunities

      • 7.5.2 LAMEA Market size and forecast, by Device

      • 7.5.3 LAMEA Market size and forecast, by Product Type

      • 7.5.4 LAMEA Market size and forecast, by Application

      • 7.5.5 LAMEA Market size and forecast, by country

        • 7.5.5.1 Brazil
          • 7.5.5.1.1 Market size and forecast, by Device
          • 7.5.5.1.2 Market size and forecast, by Product Type
          • 7.5.5.1.3 Market size and forecast, by Application
        • 7.5.5.2 South Africa,
          • 7.5.5.2.1 Market size and forecast, by Device
          • 7.5.5.2.2 Market size and forecast, by Product Type
          • 7.5.5.2.3 Market size and forecast, by Application
        • 7.5.5.3 Saudi Arabia
          • 7.5.5.3.1 Market size and forecast, by Device
          • 7.5.5.3.2 Market size and forecast, by Product Type
          • 7.5.5.3.3 Market size and forecast, by Application
        • 7.5.5.4 Turkey
          • 7.5.5.4.1 Market size and forecast, by Device
          • 7.5.5.4.2 Market size and forecast, by Product Type
          • 7.5.5.4.3 Market size and forecast, by Application
        • 7.5.5.5 Rest of LAMEA
          • 7.5.5.5.1 Market size and forecast, by Device
          • 7.5.5.5.2 Market size and forecast, by Product Type
          • 7.5.5.5.3 Market size and forecast, by Application
  • CHAPTER 8: COMPANY LANDSCAPE

    • 8.1. Introduction

    • 8.2. Top winning strategies

    • 8.3. Product Mapping of Top 10 Player

    • 8.4. Competitive Dashboard

    • 8.5. Competitive Heatmap

    • 8.6. Key developments

  • CHAPTER 9: COMPANY PROFILES

    • 9.1 Garmin Ltd.

      • 9.1.1 Company overview

      • 9.1.2 Company snapshot

      • 9.1.3 Operating business segments

      • 9.1.4 Product portfolio

      • 9.1.5 Business performance

      • 9.1.6 Key strategic moves and developments

    • 9.2 Adidas AG.

      • 9.2.1 Company overview

      • 9.2.2 Company snapshot

      • 9.2.3 Operating business segments

      • 9.2.4 Product portfolio

      • 9.2.5 Business performance

      • 9.2.6 Key strategic moves and developments

    • 9.3 Nike Inc.

      • 9.3.1 Company overview

      • 9.3.2 Company snapshot

      • 9.3.3 Operating business segments

      • 9.3.4 Product portfolio

      • 9.3.5 Business performance

      • 9.3.6 Key strategic moves and developments

    • 9.4 Samsung Electronics Co., Ltd.

      • 9.4.1 Company overview

      • 9.4.2 Company snapshot

      • 9.4.3 Operating business segments

      • 9.4.4 Product portfolio

      • 9.4.5 Business performance

      • 9.4.6 Key strategic moves and developments

    • 9.5 Sony Corporation

      • 9.5.1 Company overview

      • 9.5.2 Company snapshot

      • 9.5.3 Operating business segments

      • 9.5.4 Product portfolio

      • 9.5.5 Business performance

      • 9.5.6 Key strategic moves and developments

    • 9.6 Huawei Technologies Co., Ltd.

      • 9.6.1 Company overview

      • 9.6.2 Company snapshot

      • 9.6.3 Operating business segments

      • 9.6.4 Product portfolio

      • 9.6.5 Business performance

      • 9.6.6 Key strategic moves and developments

    • 9.7 LG Electronics Inc.

      • 9.7.1 Company overview

      • 9.7.2 Company snapshot

      • 9.7.3 Operating business segments

      • 9.7.4 Product portfolio

      • 9.7.5 Business performance

      • 9.7.6 Key strategic moves and developments

    • 9.8 Motorola Solutions Inc

      • 9.8.1 Company overview

      • 9.8.2 Company snapshot

      • 9.8.3 Operating business segments

      • 9.8.4 Product portfolio

      • 9.8.5 Business performance

      • 9.8.6 Key strategic moves and developments

    • 9.9 Apple Inc.

      • 9.9.1 Company overview

      • 9.9.2 Company snapshot

      • 9.9.3 Operating business segments

      • 9.9.4 Product portfolio

      • 9.9.5 Business performance

      • 9.9.6 Key strategic moves and developments

    • 9.10 Fitbit, Inc.

      • 9.10.1 Company overview

      • 9.10.2 Company snapshot

      • 9.10.3 Operating business segments

      • 9.10.4 Product portfolio

      • 9.10.5 Business performance

      • 9.10.6 Key strategic moves and developments

  • LIST OF TABLES

  • TABLE 1. GLOBAL WEARABLE TECHNOLOGY MARKET, BY DEVICE, 2020-2031,($MILLION)
    TABLE 2. WEARABLE TECHNOLOGY MARKET REVENUE, FOR FITNESS, BY REGION , 2020-2031,($MILLION)
    TABLE 3. WEARABLE TECHNOLOGY MARKET FOR FITNESS BY COUNTRY, 2020-2031,($MILLION)
    TABLE 4. WEARABLE TECHNOLOGY MARKET REVENUE, FOR SMART WATCHES, BY REGION , 2020-2031,($MILLION)
    TABLE 5. WEARABLE TECHNOLOGY MARKET FOR SMART WATCHES BY COUNTRY, 2020-2031,($MILLION)
    TABLE 6. WEARABLE TECHNOLOGY MARKET REVENUE, FOR SMART GLASSES, BY REGION , 2020-2031,($MILLION)
    TABLE 7. WEARABLE TECHNOLOGY MARKET FOR SMART GLASSES BY COUNTRY, 2020-2031,($MILLION)
    TABLE 8. WEARABLE TECHNOLOGY MARKET REVENUE, FOR SMART CLOTHING, BY REGION , 2020-2031,($MILLION)
    TABLE 9. WEARABLE TECHNOLOGY MARKET FOR SMART CLOTHING BY COUNTRY, 2020-2031,($MILLION)
    TABLE 10. WEARABLE TECHNOLOGY MARKET REVENUE, FOR OTHERS, BY REGION , 2020-2031,($MILLION)
    TABLE 11. WEARABLE TECHNOLOGY MARKET FOR OTHERS BY COUNTRY, 2020-2031,($MILLION)
    TABLE 12. GLOBAL WEARABLE TECHNOLOGY MARKET, BY PRODUCT TYPE, 2020-2031,($MILLION)
    TABLE 13. WEARABLE TECHNOLOGY MARKET REVENUE, FOR WRIST WEAR, BY REGION , 2020-2031,($MILLION)
    TABLE 14. WEARABLE TECHNOLOGY MARKET FOR WRIST WEAR BY COUNTRY, 2020-2031,($MILLION)
    TABLE 15. WEARABLE TECHNOLOGY MARKET REVENUE, FOR EYEWEAR, BY REGION , 2020-2031,($MILLION)
    TABLE 16. WEARABLE TECHNOLOGY MARKET FOR EYEWEAR BY COUNTRY, 2020-2031,($MILLION)
    TABLE 17. WEARABLE TECHNOLOGY MARKET REVENUE, FOR HEARABLES, BY REGION , 2020-2031,($MILLION)
    TABLE 18. WEARABLE TECHNOLOGY MARKET FOR HEARABLES BY COUNTRY, 2020-2031,($MILLION)
    TABLE 19. WEARABLE TECHNOLOGY MARKET REVENUE, FOR NECKWEAR, BY REGION , 2020-2031,($MILLION)
    TABLE 20. WEARABLE TECHNOLOGY MARKET FOR NECKWEAR BY COUNTRY, 2020-2031,($MILLION)
    TABLE 21. WEARABLE TECHNOLOGY MARKET REVENUE, FOR BODYWEAR, BY REGION , 2020-2031,($MILLION)
    TABLE 22. WEARABLE TECHNOLOGY MARKET FOR BODYWEAR BY COUNTRY, 2020-2031,($MILLION)
    TABLE 23. WEARABLE TECHNOLOGY MARKET REVENUE, FOR OTHERS, BY REGION , 2020-2031,($MILLION)
    TABLE 24. WEARABLE TECHNOLOGY MARKET FOR OTHERS BY COUNTRY, 2020-2031,($MILLION)
    TABLE 25. GLOBAL WEARABLE TECHNOLOGY MARKET, BY APPLICATION, 2020-2031,($MILLION)
    TABLE 26. WEARABLE TECHNOLOGY MARKET REVENUE, FOR LIFESTYLE, BY REGION , 2020-2031,($MILLION)
    TABLE 27. WEARABLE TECHNOLOGY MARKET FOR LIFESTYLE BY COUNTRY, 2020-2031,($MILLION)
    TABLE 28. WEARABLE TECHNOLOGY MARKET REVENUE, FOR CONSUMER APPLICATIONS, BY REGION , 2020-2031,($MILLION)
    TABLE 29. WEARABLE TECHNOLOGY MARKET FOR CONSUMER APPLICATIONS BY COUNTRY, 2020-2031,($MILLION)
    TABLE 30. WEARABLE TECHNOLOGY MARKET REVENUE, FOR ENTERTAINMENT, BY REGION , 2020-2031,($MILLION)
    TABLE 31. WEARABLE TECHNOLOGY MARKET FOR ENTERTAINMENT BY COUNTRY, 2020-2031,($MILLION)
    TABLE 32. WEARABLE TECHNOLOGY MARKET REVENUE, FOR HEALTHCARE, BY REGION , 2020-2031,($MILLION)
    TABLE 33. WEARABLE TECHNOLOGY MARKET FOR HEALTHCARE BY COUNTRY, 2020-2031,($MILLION)
    TABLE 34. WEARABLE TECHNOLOGY MARKET REVENUE, FOR FITNESS AND SPORTS, BY REGION , 2020-2031,($MILLION)
    TABLE 35. WEARABLE TECHNOLOGY MARKET FOR FITNESS AND SPORTS BY COUNTRY, 2020-2031,($MILLION)
    TABLE 36. WEARABLE TECHNOLOGY MARKET REVENUE, FOR DEFENSE, BY REGION , 2020-2031,($MILLION)
    TABLE 37. WEARABLE TECHNOLOGY MARKET FOR DEFENSE BY COUNTRY, 2020-2031,($MILLION)
    TABLE 38. WEARABLE TECHNOLOGY MARKET REVENUE, FOR ENTERPRISE, BY REGION , 2020-2031,($MILLION)
    TABLE 39. WEARABLE TECHNOLOGY MARKET FOR ENTERPRISE BY COUNTRY, 2020-2031,($MILLION)
    TABLE 40. WEARABLE TECHNOLOGY MARKET, BY REGION, 2020-2031,($MILLION)
    TABLE 41. NORTH AMERICA WEARABLE TECHNOLOGY MARKET, BY DEVICE, 2020-2031,($MILLION)
    TABLE 42. NORTH AMERICA WEARABLE TECHNOLOGY MARKET, BY PRODUCT TYPE, 2020-2031,($MILLION)
    TABLE 43. NORTH AMERICA WEARABLE TECHNOLOGY MARKET, BY APPLICATION, 2020-2031,($MILLION)
    TABLE 44. NORTH AMERICA WEARABLE TECHNOLOGY MARKET, BY COUNTRY, 2020-2031,($MILLION)
    TABLE 45. U.S. WEARABLE TECHNOLOGY MARKET, BY DEVICE, 2020-2031,($MILLION)
    TABLE 46. U.S. WEARABLE TECHNOLOGY MARKET, BY PRODUCT TYPE, 2020-2031,($MILLION)
    TABLE 47. U.S. WEARABLE TECHNOLOGY MARKET, BY APPLICATION, 2020-2031,($MILLION)
    TABLE 48. CANADA WEARABLE TECHNOLOGY MARKET, BY DEVICE, 2020-2031,($MILLION)
    TABLE 49. CANADA WEARABLE TECHNOLOGY MARKET, BY PRODUCT TYPE, 2020-2031,($MILLION)
    TABLE 50. CANADA WEARABLE TECHNOLOGY MARKET, BY APPLICATION, 2020-2031,($MILLION)
    TABLE 51. MEXICO WEARABLE TECHNOLOGY MARKET, BY DEVICE, 2020-2031,($MILLION)
    TABLE 52. MEXICO WEARABLE TECHNOLOGY MARKET, BY PRODUCT TYPE, 2020-2031,($MILLION)
    TABLE 53. MEXICO WEARABLE TECHNOLOGY MARKET, BY APPLICATION, 2020-2031,($MILLION)
    TABLE 54. EUROPE WEARABLE TECHNOLOGY MARKET, BY DEVICE, 2020-2031,($MILLION)
    TABLE 55. EUROPE WEARABLE TECHNOLOGY MARKET, BY PRODUCT TYPE, 2020-2031,($MILLION)
    TABLE 56. EUROPE WEARABLE TECHNOLOGY MARKET, BY APPLICATION, 2020-2031,($MILLION)
    TABLE 57. EUROPE WEARABLE TECHNOLOGY MARKET, BY COUNTRY, 2020-2031,($MILLION)
    TABLE 58. U.K. WEARABLE TECHNOLOGY MARKET, BY DEVICE, 2020-2031,($MILLION)
    TABLE 59. U.K. WEARABLE TECHNOLOGY MARKET, BY PRODUCT TYPE, 2020-2031,($MILLION)
    TABLE 60. U.K. WEARABLE TECHNOLOGY MARKET, BY APPLICATION, 2020-2031,($MILLION)
    TABLE 61. GERMANY WEARABLE TECHNOLOGY MARKET, BY DEVICE, 2020-2031,($MILLION)
    TABLE 62. GERMANY WEARABLE TECHNOLOGY MARKET, BY PRODUCT TYPE, 2020-2031,($MILLION)
    TABLE 63. GERMANY WEARABLE TECHNOLOGY MARKET, BY APPLICATION, 2020-2031,($MILLION)
    TABLE 64. FRANCE WEARABLE TECHNOLOGY MARKET, BY DEVICE, 2020-2031,($MILLION)
    TABLE 65. FRANCE WEARABLE TECHNOLOGY MARKET, BY PRODUCT TYPE, 2020-2031,($MILLION)
    TABLE 66. FRANCE WEARABLE TECHNOLOGY MARKET, BY APPLICATION, 2020-2031,($MILLION)
    TABLE 67. ITALY WEARABLE TECHNOLOGY MARKET, BY DEVICE, 2020-2031,($MILLION)
    TABLE 68. ITALY WEARABLE TECHNOLOGY MARKET, BY PRODUCT TYPE, 2020-2031,($MILLION)
    TABLE 69. ITALY WEARABLE TECHNOLOGY MARKET, BY APPLICATION, 2020-2031,($MILLION)
    TABLE 70. SPAIN WEARABLE TECHNOLOGY MARKET, BY DEVICE, 2020-2031,($MILLION)
    TABLE 71. SPAIN WEARABLE TECHNOLOGY MARKET, BY PRODUCT TYPE, 2020-2031,($MILLION)
    TABLE 72. SPAIN WEARABLE TECHNOLOGY MARKET, BY APPLICATION, 2020-2031,($MILLION)
    TABLE 73. REST OF EUROPE WEARABLE TECHNOLOGY MARKET, BY DEVICE, 2020-2031,($MILLION)
    TABLE 74. REST OF EUROPE WEARABLE TECHNOLOGY MARKET, BY PRODUCT TYPE, 2020-2031,($MILLION)
    TABLE 75. REST OF EUROPE WEARABLE TECHNOLOGY MARKET, BY APPLICATION, 2020-2031,($MILLION)
    TABLE 76. ASIA-PACIFIC WEARABLE TECHNOLOGY MARKET, BY DEVICE, 2020-2031,($MILLION)
    TABLE 77. ASIA-PACIFIC WEARABLE TECHNOLOGY MARKET, BY PRODUCT TYPE, 2020-2031,($MILLION)
    TABLE 78. ASIA-PACIFIC WEARABLE TECHNOLOGY MARKET, BY APPLICATION, 2020-2031,($MILLION)
    TABLE 79. ASIA-PACIFIC WEARABLE TECHNOLOGY MARKET, BY COUNTRY, 2020-2031,($MILLION)
    TABLE 80. CHINA WEARABLE TECHNOLOGY MARKET, BY DEVICE, 2020-2031,($MILLION)
    TABLE 81. CHINA WEARABLE TECHNOLOGY MARKET, BY PRODUCT TYPE, 2020-2031,($MILLION)
    TABLE 82. CHINA WEARABLE TECHNOLOGY MARKET, BY APPLICATION, 2020-2031,($MILLION)
    TABLE 83. JAPAN WEARABLE TECHNOLOGY MARKET, BY DEVICE, 2020-2031,($MILLION)
    TABLE 84. JAPAN WEARABLE TECHNOLOGY MARKET, BY PRODUCT TYPE, 2020-2031,($MILLION)
    TABLE 85. JAPAN WEARABLE TECHNOLOGY MARKET, BY APPLICATION, 2020-2031,($MILLION)
    TABLE 86. INDIA WEARABLE TECHNOLOGY MARKET, BY DEVICE, 2020-2031,($MILLION)
    TABLE 87. INDIA WEARABLE TECHNOLOGY MARKET, BY PRODUCT TYPE, 2020-2031,($MILLION)
    TABLE 88. INDIA WEARABLE TECHNOLOGY MARKET, BY APPLICATION, 2020-2031,($MILLION)
    TABLE 89. ASEAN WEARABLE TECHNOLOGY MARKET, BY DEVICE, 2020-2031,($MILLION)
    TABLE 90. ASEAN WEARABLE TECHNOLOGY MARKET, BY PRODUCT TYPE, 2020-2031,($MILLION)
    TABLE 91. ASEAN WEARABLE TECHNOLOGY MARKET, BY APPLICATION, 2020-2031,($MILLION)
    TABLE 92. AUSTRALIA WEARABLE TECHNOLOGY MARKET, BY DEVICE, 2020-2031,($MILLION)
    TABLE 93. AUSTRALIA WEARABLE TECHNOLOGY MARKET, BY PRODUCT TYPE, 2020-2031,($MILLION)
    TABLE 94. AUSTRALIA WEARABLE TECHNOLOGY MARKET, BY APPLICATION, 2020-2031,($MILLION)
    TABLE 95. REST OF ASIA-PACIFIC WEARABLE TECHNOLOGY MARKET, BY DEVICE, 2020-2031,($MILLION)
    TABLE 96. REST OF ASIA-PACIFIC WEARABLE TECHNOLOGY MARKET, BY PRODUCT TYPE, 2020-2031,($MILLION)
    TABLE 97. REST OF ASIA-PACIFIC WEARABLE TECHNOLOGY MARKET, BY APPLICATION, 2020-2031,($MILLION)
    TABLE 98. LAMEA WEARABLE TECHNOLOGY MARKET, BY DEVICE, 2020-2031,($MILLION)
    TABLE 99. LAMEA WEARABLE TECHNOLOGY MARKET, BY PRODUCT TYPE, 2020-2031,($MILLION)
    TABLE 100. LAMEA WEARABLE TECHNOLOGY MARKET, BY APPLICATION, 2020-2031,($MILLION)
    TABLE 101. LAMEA WEARABLE TECHNOLOGY MARKET, BY COUNTRY, 2020-2031,($MILLION)
    TABLE 102. BRAZIL WEARABLE TECHNOLOGY MARKET, BY DEVICE, 2020-2031,($MILLION)
    TABLE 103. BRAZIL WEARABLE TECHNOLOGY MARKET, BY PRODUCT TYPE, 2020-2031,($MILLION)
    TABLE 104. BRAZIL WEARABLE TECHNOLOGY MARKET, BY APPLICATION, 2020-2031,($MILLION)
    TABLE 105. SOUTH AFRICA, WEARABLE TECHNOLOGY MARKET, BY DEVICE, 2020-2031,($MILLION)
    TABLE 106. SOUTH AFRICA, WEARABLE TECHNOLOGY MARKET, BY PRODUCT TYPE, 2020-2031,($MILLION)
    TABLE 107. SOUTH AFRICA, WEARABLE TECHNOLOGY MARKET, BY APPLICATION, 2020-2031,($MILLION)
    TABLE 108. SAUDI ARABIA WEARABLE TECHNOLOGY MARKET, BY DEVICE, 2020-2031,($MILLION)
    TABLE 109. SAUDI ARABIA WEARABLE TECHNOLOGY MARKET, BY PRODUCT TYPE, 2020-2031,($MILLION)
    TABLE 110. SAUDI ARABIA WEARABLE TECHNOLOGY MARKET, BY APPLICATION, 2020-2031,($MILLION)
    TABLE 111. TURKEY WEARABLE TECHNOLOGY MARKET, BY DEVICE, 2020-2031,($MILLION)
    TABLE 112. TURKEY WEARABLE TECHNOLOGY MARKET, BY PRODUCT TYPE, 2020-2031,($MILLION)
    TABLE 113. TURKEY WEARABLE TECHNOLOGY MARKET, BY APPLICATION, 2020-2031,($MILLION)
    TABLE 114. REST OF LAMEA WEARABLE TECHNOLOGY MARKET, BY DEVICE, 2020-2031,($MILLION)
    TABLE 115. REST OF LAMEA WEARABLE TECHNOLOGY MARKET, BY PRODUCT TYPE, 2020-2031,($MILLION)
    TABLE 116. REST OF LAMEA WEARABLE TECHNOLOGY MARKET, BY APPLICATION, 2020-2031,($MILLION)
    TABLE 117.GARMIN LTD.: COMPANY SNAPSHOT
    TABLE 118.GARMIN LTD.: OPERATING SEGMENTS
    TABLE 119.GARMIN LTD.: PRODUCT PORTFOLIO
    TABLE 120.GARMIN LTD.: NET SALES,
    TABLE 121.GARMIN LTD.: KEY STRATERGIES
    TABLE 122.ADIDAS AG.: COMPANY SNAPSHOT
    TABLE 123.ADIDAS AG.: OPERATING SEGMENTS
    TABLE 124.ADIDAS AG.: PRODUCT PORTFOLIO
    TABLE 125.ADIDAS AG.: NET SALES,
    TABLE 126.ADIDAS AG.: KEY STRATERGIES
    TABLE 127.NIKE INC.: COMPANY SNAPSHOT
    TABLE 128.NIKE INC.: OPERATING SEGMENTS
    TABLE 129.NIKE INC.: PRODUCT PORTFOLIO
    TABLE 130.NIKE INC.: NET SALES,
    TABLE 131.NIKE INC.: KEY STRATERGIES
    TABLE 132.SAMSUNG ELECTRONICS CO., LTD.: COMPANY SNAPSHOT
    TABLE 133.SAMSUNG ELECTRONICS CO., LTD.: OPERATING SEGMENTS
    TABLE 134.SAMSUNG ELECTRONICS CO., LTD.: PRODUCT PORTFOLIO
    TABLE 135.SAMSUNG ELECTRONICS CO., LTD.: NET SALES,
    TABLE 136.SAMSUNG ELECTRONICS CO., LTD.: KEY STRATERGIES
    TABLE 137.SONY CORPORATION: COMPANY SNAPSHOT
    TABLE 138.SONY CORPORATION: OPERATING SEGMENTS
    TABLE 139.SONY CORPORATION: PRODUCT PORTFOLIO
    TABLE 140.SONY CORPORATION: NET SALES,
    TABLE 141.SONY CORPORATION: KEY STRATERGIES
    TABLE 142.HUAWEI TECHNOLOGIES CO., LTD.: COMPANY SNAPSHOT
    TABLE 143.HUAWEI TECHNOLOGIES CO., LTD.: OPERATING SEGMENTS
    TABLE 144.HUAWEI TECHNOLOGIES CO., LTD.: PRODUCT PORTFOLIO
    TABLE 145.HUAWEI TECHNOLOGIES CO., LTD.: NET SALES,
    TABLE 146.HUAWEI TECHNOLOGIES CO., LTD.: KEY STRATERGIES
    TABLE 147.LG ELECTRONICS INC.: COMPANY SNAPSHOT
    TABLE 148.LG ELECTRONICS INC.: OPERATING SEGMENTS
    TABLE 149.LG ELECTRONICS INC.: PRODUCT PORTFOLIO
    TABLE 150.LG ELECTRONICS INC.: NET SALES,
    TABLE 151.LG ELECTRONICS INC.: KEY STRATERGIES
    TABLE 152.MOTOROLA SOLUTIONS INC: COMPANY SNAPSHOT
    TABLE 153.MOTOROLA SOLUTIONS INC: OPERATING SEGMENTS
    TABLE 154.MOTOROLA SOLUTIONS INC: PRODUCT PORTFOLIO
    TABLE 155.MOTOROLA SOLUTIONS INC: NET SALES,
    TABLE 156.MOTOROLA SOLUTIONS INC: KEY STRATERGIES
    TABLE 157.APPLE INC.: COMPANY SNAPSHOT
    TABLE 158.APPLE INC.: OPERATING SEGMENTS
    TABLE 159.APPLE INC.: PRODUCT PORTFOLIO
    TABLE 160.APPLE INC.: NET SALES,
    TABLE 161.APPLE INC.: KEY STRATERGIES
    TABLE 162.FITBIT, INC.: COMPANY SNAPSHOT
    TABLE 163.FITBIT, INC.: OPERATING SEGMENTS
    TABLE 164.FITBIT, INC.: PRODUCT PORTFOLIO
    TABLE 165.FITBIT, INC.: NET SALES,
    TABLE 166.FITBIT, INC.: KEY STRATERGIES
  • LIST OF FIGURES

  • FIGURE 1. GLOBAL WEARABLE TECHNOLOGY MARKET SEGMENTATION
    FIGURE 2. GLOBAL WEARABLE TECHNOLOGY MARKET
    FIGURE 3. SEGMENTATION WEARABLE TECHNOLOGY MARKET
    FIGURE 4. TOP INVESTMENT POCKET IN WEARABLE TECHNOLOGY MARKET
    FIGURE 5. TOP WINNING STRATEGIES, 2019-2021*
    FIGURE 6. TOP WINNING STRATEGIES, BY DEVELOPMENT, 2019-2021(%)
    FIGURE 7. TOP WINNING STRATEGIES, BY COMPANY, 2019-2021*
    FIGURE 8. MODERATE BARGAINING POWER OF BUYERS
    FIGURE 9. MODERATE BARGAINING POWER OF SUPPLIERS
    FIGURE 10. MODERATE THREAT OF NEW ENTRANTS
    FIGURE 11. LOW THREAT OF SUBSTITUTION
    FIGURE 12. HIGH COMPETITIVE RIVALRY
    FIGURE 13. TOP PLAYER POSITIONING, 2020
    FIGURE 14. MARKET SHARE ANALYSIS, 2020
    FIGURE 15. RESTRAINTS AND DRIVERS: WEARABLE TECHNOLOGY MARKET
    FIGURE 16. WEARABLE TECHNOLOGY MARKET SEGMENTATION, BY PRODUCT TYPE
    FIGURE 17. WEARABLE TECHNOLOGY MARKET FOR BODY WEAR, BY COUNTRY, 2020-2031 ($MILLION)
    FIGURE 18. WEARABLE TECHNOLOGY MARKET FOR WRIST WEAR, BY COUNTRY, 2020-2031 ($MILLION)
    FIGURE 19. WEARABLE TECHNOLOGY MARKET FOR EYE WEAR, BY COUNTRY, 2020-2031 ($MILLION)
    FIGURE 20. WEARABLE TECHNOLOGY MARKET FOR HEARABLES, BY COUNTRY, 2020-2031 ($MILLION)
    FIGURE 21. WEARABLE TECHNOLOGY MARKET FOR NECK WEAR, BY COUNTRY, 2020-2031 ($MILLION)
    FIGURE 22. WEARABLE TECHNOLOGY MARKET SEGMENTATION, BY APPLICATION
    FIGURE 23. WEARABLE TECHNOLOGY MARKET FOR LIFESTYLE, BY COUNTRY, 2020-2031 ($MILLION)
    FIGURE 24. WEARABLE TECHNOLOGY MARKET FOR HEALTHCARE, BY COUNTRY, 2020-2031 ($MILLION)
    FIGURE 25. WEARABLE TECHNOLOGY MARKET FOR CONSUMER APPLICATIONS, BY COUNTRY, 2020-2031 ($MILLION)
    FIGURE 26. WEARABLE TECHNOLOGY MARKET FOR DEFENSE, BY COUNTRY, 2020-2031 ($MILLION)
    FIGURE 27. WEARABLE TECHNOLOGY MARKET FOR FITNESS AND SPORTS, BY COUNTRY, 2020-2031 ($MILLION)
    FIGURE 28. WEARABLE TECHNOLOGY MARKET FOR ENTERTAINMENT, BY COUNTRY, 2020-2031 ($MILLION)
    FIGURE 29. WEARABLE TECHNOLOGY MARKET FOR ENTERPRISE AND INDUSTRIAL, BY COUNTRY, 2020-2031 ($MILLION)
    FIGURE 30. WEARABLE TECHNOLOGY MARKET SEGMENTATION, BY DEVICE
    FIGURE 31. WEARABLE TECHNOLOGY MARKET FOR SMART WATCHES, BY COUNTRY, 2020-2031 ($MILLION)
    FIGURE 32. WEARABLE TECHNOLOGY MARKET FOR SMART GLASSES, BY COUNTRY, 2020-2031 ($MILLION)
    FIGURE 33. WEARABLE TECHNOLOGY MARKET FOR FITNESS AND WELLNESS DEVICES, BY COUNTRY, 2020-2031 ($MILLION)
    FIGURE 34. WEARABLE TECHNOLOGY MARKET FOR SMART CLOTHING, BY COUNTRY, 2020-2031 ($MILLION)
    FIGURE 35. WEARABLE TECHNOLOGY MARKET FOR OTHERS, BY COUNTRY, 2020-2031 ($MILLION)
    FIGURE 36. ADIDAS GROUP: NET SALES, 2018-2020 ($MILLION)
    FIGURE 37. ADIDAS GROUP: REVENUE SHARE, BY SEGMENT, 2020 (%)
    FIGURE 38. ADIDAS GROUP: REVENUE SHARE, BY REGION, 2020 (%)
    FIGURE 39. APPLE, INC.: NET SALES, 2018-2020 ($MILLION)
    FIGURE 40. APPLE, INC.: REVENUE SHARE, BY SEGMENT, 2020 (%)
    FIGURE 41. APPLE, INC.: REVENUE SHARE, BY REGION, 2020 (%)
    FIGURE 42. FITBIT INC: NET SALES, 2018-2020 ($MILLION)
    FIGURE 43. FITBIT INC: REVENUE SHARE, BY SEGMENT, 2020 (%)
    FIGURE 44. FITBIT INC: REVENUE SHARE, BY REGION, 2020 (%)
    FIGURE 45. GARMIN LTD.: NET SALES, 2018-2020 ($MILLION)
    FIGURE 46. GARMIN LTD.: REVENUE SHARE, BY SEGMENT, 2020 (%)
    FIGURE 47. GARMIN LTD.: REVENUE SHARE, BY REGION, 2020 (%)
    FIGURE 48. HUAWEI TECHNOLOGIES CO., LTD.: NET SALES, 2018-2020 ($MILLION)
    FIGURE 49. HUAWEI TECHNOLOGIES CO., LTD.: REVENUE SHARE, BY SEGMENT, 2020 (%)
    FIGURE 50. HUAWEI TECHNOLOGIES CO., LTD.: REVENUE SHARE, BY REGION, 2020 (%)
    FIGURE 51. LG ELECTRONICS INC.: NET SALES, 2018-2020 ($MILLION)
    FIGURE 52. LG ELECTRONICS INC.: REVENUE SHARE, BY SEGMENT, 2020 (%)
    FIGURE 53. LG ELECTRONICS INC.: REVENUE SHARE, BY REGION, 2020 (%)
    FIGURE 54. MOTOROLA SOLUTIONS, INC.: NET SALES, 2018-2020 ($MILLION)
    FIGURE 55. MOTOROLA SOLUTIONS, INC.: REVENUE SHARE, BY SEGMENT, 2020 (%)
    FIGURE 56. MOTOROLA SOLUTIONS, INC.: REVENUE SHARE, BY REGION, 2020 (%)
    FIGURE 57. NIKE INC: NET SALES, 2018-2020 ($MILLION)
    FIGURE 58. NIKE INC: REVENUE SHARE, BY SEGMENT, 2020 (%)
    FIGURE 59. NIKE INC: REVENUE SHARE, BY REGION, 2020 (%)
    FIGURE 60. SONY CORPORATION: NET SALES, 2018-2020 ($MILLION)
    FIGURE 61. SONY CORPORATION: REVENUE SHARE, BY SEGMENT, 2020 (%)
    FIGURE 62. SONY CORPORATION: REVENUE SHARE, BY REGION, 2020 (%)
    FIGURE 63. SAMSUNG ELECTRONICS CO., LTD.: NET SALES, 2018-2020 ($MILLION)
    FIGURE 64. SAMSUNG ELECTRONICS CO., LTD.: REVENUE SHARE, BY SEGMENT, 2020 (%)
    FIGURE 65. SAMSUNG ELECTRONICS CO., LTD.: REVENUE SHARE, BY REGION, 2020 (%)


Wearable technology market is projected to depict a prominent growth from 2020 to 2031 in Asia-Pacific owing to technological advancements, entry of large players, and increase in awareness of the benefits offered by wearable devices. Furthermore, the market possesses high growth potential due to rise in the trend of Internet of Things (Iot). However, the wearable technology market is at a nascent stage and some of the regions, such as Africa are still untapped.

Increase in health concerns, such as obesity and other health-related problems encourage people to adopt fitness devices, thus minimizing the hospital bills. Moreover, various other benefits offered by these devices, such as placing calls and viewing notifications at ease, supplement the growth of the global wearable technology market. Many enterprises use wearables to increase productivity of employees and to keep a track on their performance. Moreover, smart textiles are launched in the market with embedded sensors, thereby providing the user with whole body tracking. For instance, in 2015, Ralph Lauren launched sensor-laden shirts named “PoloTech”, which has attached biometric sensors to check heart rates, stress levels, and calories burnt. Such innovations by various companies accelerate the wearable technology market growth.
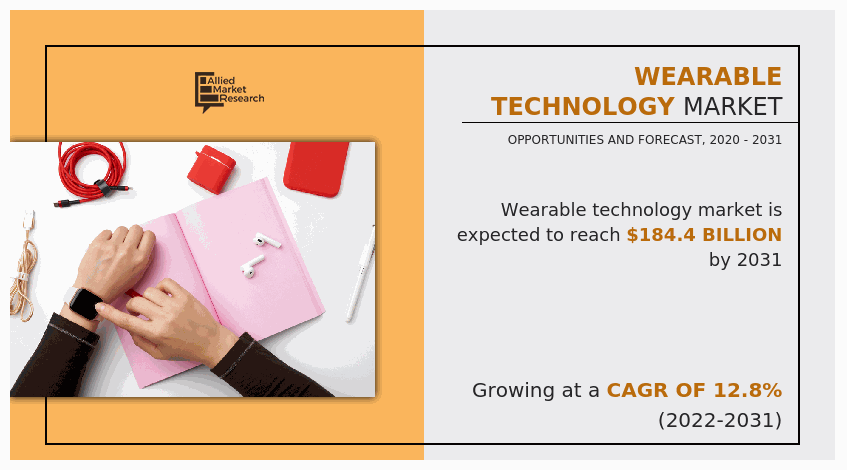
PURCHASE OPTIONS

Call or Email us

U.S.-Canada Toll-free: +1-800-792-5285
Int'l : +1-503-894-6022
Europe : +44-845-528-1300
Email : help@alliedmarketresearch.com
 
FREQUENTLY ASKED QUESTIONS?

A. $184.4 Bn is the total market value of wearable technology market report in 2031.

A. From 2022-2031 would be forecast period in the market report

A. $58.1 billion is the market value of wearable technology market in 2021

A. 2020 is base year calculated in the wearable technology market report

A. Apple Inc., Fitbit, Inc., Garmin Ltd., Adidas AG., Nike Inc., Samsung Electronics Co., Ltd., Sony Corporation are the top companies hold the market share in wearable technology market

A. Smart watched is the most influencing segment growing in the wearable technology market report

A. The smart watches compatibility to interact with social media, in store merchandising, and ease of payment with wearable are some of the key trends in wearable technology

A. 14.5% & 14.0% are the growth rate of the emerging countries.

Looking for Customization?

 Customization Request

Have a Question?

 Speak with Analyst

Any Confusion?

 Inquire Before Buying

Have a glance of the Report

  Request Sample
RELATED TAGS

Purchase Full Report of
Wearable Technology Market

Start reading instantly.
This Report and over 66,804+ more Reports, Available with Avenue Library. T&C*.

  • Online Only
  • $3,456
  • Online cloud access only
  • Restricted print, copy, paste & download
  • Read only
  • Free industry update
    (Within 180 days)
  • Free report update in next update cycle
    (Mar 2023 - Mar 2024)
  • Data Pack
  • $3,840
  • Restricted to one authorized user
  • One print only
  • Available in
    Excel
  • Free industry update
    (Within 180 days)
  •   Free report update in next update cycle
    (Mar 2023 - Mar 2024)
  • Single User
  • $5,769
  • Restricted to one authorized user
  • One print only
  • Available in
    PDF
  • Free industry update
    (Within 180 days)
  •   Free report update in next update cycle
    (Mar 2023 - Mar 2024)
  • Five Users
  • $6,450
  • Limited to five authorized users
  • Print upto five copies
  • Available in
    PDF
  • Free industry update
    (Within 180 days)
  •   Free report update in next update cycle
    (Mar 2023 - Mar 2024)
  • Enterprise
    License/PDF

  • $10,995
  • Unlimited
    within
    company/enterprise
  • Available in Excel & PDF
  • Free industry update
    (Within 180 days)
  •   Free report update in next update cycle
    (Mar 2023 - Mar 2024)
  • Library
    Membership

  • $999 $ 1,175
    Per User/ Per month/ Billed annually
  • Published Content
    E-access
  • Company Profiles
    E-access
  • Newly Added Content Access
  • 10 PDF
    Downloads
  • 5 Excel Data
    Pack Downloads
  • 250 Company Profiles PDF Downloads
  • Buy Now

*Taxes/Fees, if applicable will be added during checkout. All prices in USD

RELATED REPORTS
 

Why Allied Market Research?


Infallible Methodology

To ensure high-level data integrity, accurate analysis, and impeccable forecasts

Analyst Support

For complete satisfaction

Customization

On-demand customization of scope of the report to exactly meet your needs

TARGETED MARKET VIEW

Targeted market view to provide pertinent information and save time of readers

Get fresh content delivered

Get insights on topics that are crucial for your business. Stay abreast of your interest areas.

Get Industry Data Alerts

Why Allied Market Research?

Infallible Methodology

To ensure high-level data integrity, accurate analysis, and impeccable forecasts

Analyst Support

For complete satisfaction

Customization

On-demand customization of scope of the report to exactly meet your needs

TARGETED MARKET VIEW

Targeted market view to provide pertinent information and save time of readers