
Wireless Power Transmission Market Research, 2032
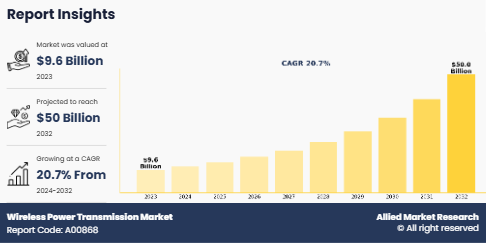
The global Wireless Power Transmission Market was valued at $9.6 billion in 2023, and is projected to reach $50.0 billion by 2032, growing at a CAGR of 20.7% from 2024 to 2032. Wireless power transmission refers to the process of transmitting electrical energy from a power source to an electrical load without using physical connectors such as wires or cables. This technology relies on electromagnetic fields to transfer energy through the air, enabling devices to be charged or powered remotely. There are several methods of wireless power transmission, including radio frequency (RF) energy transfer, microwave power transmission, and inductive power transfer (IPT). Inductive coupling, a form of IPT, is commonly used in applications such as wireless charging pads for smartphones and electric toothbrushes, while RF and microwave power transmission can transfer energy over greater distances. Wireless power transmission offers the potential for greater convenience and flexibility in powering electronic devices, reducing the need for cables and connectors.
Market Dynamics
The wireless power transmission market is significantly driven by factors such as a rise in consumer preference for wireless connectivity and the convenience it offers. The rise in the adoption of electric vehicles and the need for effective charging systems also contribute significantly to the wireless power transmission market growth. In addition, the rise in demand for efficient and safe power transfer solutions in industrial applications is boosting the market growth. Increasing integration of wireless power technology in consumer electronics, such as smartphones and wearable devices, further propels the market. However, the wireless power transmission market faces challenges such as the impact of uncertified and non-standardized products, which can lead to poor user experiences and safety concerns. The high cost of wireless power transmission technology as compared to traditional methods can also be a barrier to the widespread adoption of wireless power transmission technology. However, the market is expected to grow, driven by advancements in technology and an increase in demand for wireless power solutions in various applications, including healthcare, automotive, and consumer electronics. The ongoing research and development efforts aimed at improving efficiency and reducing costs are likely to drive the growth of the market.
Segment Overview
The wireless power transmission market share is segmented into Type, Technology, Application, and Region.
By type, the wireless power transmission market overview is segmented into devices with batteries and devices without batteries. In 2023, the device with battery segment dominated the market.

By technology, the wireless power transmission market demand is segmented into near-field technologies and far-field technologies. The near-field technologies segment accounted for a major share in 2023 and is expected to follow the same trend during the forecast period.

By application, the wireless power transmission market size is segmented into receiver applications and transmitter applications. The receiver application segment dominated the market in 2023.

Region-wise, the wireless power transmission market report is analyzed across North America (the U.S., Canada, and Mexico), Europe (the UK, Germany, France, Italy, and the rest of Europe), Asia-Pacific (China, Japan, India, South Korea, and rest of Asia-Pacific), and LAMEA (Latin America, Middle East and Africa). Asia-Pacific, particularly China, accounted for a major share of the wireless power transmission market in 2023. China leads in electronics manufacturing, including smartphones, laptops, and wearables that increasingly use wireless charging. Strong government support for smart technologies and the country's status as the largest electric vehicle (EV) market have driven demand for wireless charging solutions. Additionally, China's significant research and development efforts, combined with consumer demand for convenience and its dominance in manufacturing wireless charging components, further contribute to its wireless power transmission market leadership.

Competitive Analysis
The key players in the wireless power transmission market growth include Murata Manufacturing Co., Ltd., Renesas Electronics Corporation, Samsung Electronics Co., Ltd., Qualcomm Technologies, Inc., Powermat, Texas Instruments Incorporated, Energous Corporation, WiTricity Corporation, NXP Semiconductors, and TDK Corporation.
Recent Developments in the Wireless Power Transmission Industry
In October 2022, TDK Corporation launched a state-of-the-art, Qi-compliant planar wireless power coil. It utilizes a copper patterning technology that provides multiple end-user benefits. The Wireless Power Consortium [WPC] has designated this new coil as MP-A28, while the corresponding TDK part number is WCT38466-N0E0SST01. The pattern coil technology allows for intricate coil patterns that cannot be duplicated by the use of discrete wires and yields tight trace width and gap control normally associated with the finest etching processes and technologies.
In June 2024, Energous Corporation partnered with Anukin, Ecobyte, and Peak Technologies to accelerate the adoption of its solutions worldwide. Energous' wireless power transmitters deliver cable-free, battery-free energy to IoT devices, thus streamlining asset and inventory tracking and management.
In June 2023, Powermat partnered with Powercast to create long-range wireless power solutions with power ranging from SmartInductive to RF up to 120ft. Powermat's high-power SmartInductive hybrid inductive/resonance technology enables scalable wireless power applications capable of penetrating eight inches of walls and windows. Furthermore, Powercast's RF technology is designed for low-power consumer and industrial devices that need freedom of placement and often operate in hard-to-reach places such as IoT sensor networks.
In December 2021, Murata Manufacturing Co., Ltd. developed a wireless power transfer technology that receives higher power from an NFC reader terminal for electronic cards such as fingerprint authentication cards. Murata has already started to provide this technology as a technology solution. This technology enables a fingerprint authentication card to be used at a distance from NFC reader terminals, even if the card is not equipped with a battery, and also helps reduce the time required for fingerprint authentication.
In February 2023, Renesas Electronics Corporation developed a single-chip wireless power transmitter solution that measures AC and DC transmitter power for improved accuracy and safety for mobile devices. It comes with Zero-Voltage Switching (ZVS) that reduces electromagnetic interference (EMI) and higher power transmission efficiency. These technical capabilities enable wireless power transmission up to 15W with a Qi power receiver (PRx) and up to 40W with proprietary PRx solutions.
Key Benefits For Stakeholders
- This report provides a quantitative analysis of the wireless power transmission market segments, current trends, estimations, and dynamics of the wireless power transmission market from 2023 to 2032 to identify the prevailing wireless power transmission market opportunities.
- The market research is offered along with information related to key drivers, restraints, and opportunities.
- Porter's five forces analysis highlights the potency of buyers and suppliers to enable stakeholders to make profit-oriented business decisions and strengthen their supplier-buyer network.
- An in-depth analysis of the wireless power transmission market segmentation assists in determining the prevailing market opportunities.
- Major countries in each region are mapped according to their revenue contribution to the global market.
- Market player positioning facilitates benchmarking and provides a clear understanding of the present position of the market players.
- The report includes an analysis of the regional as well as global wireless power transmission market trends, key players, market segments, application areas, wireless power transmission market analysis, and market growth strategies.
Wireless Power Transmission Market Report Highlights
| Aspects | Details |
| Market Size By 2032 | USD 50 billion |
| Growth Rate | CAGR of 20.7% |
| Forecast period | 2023 - 2032 |
| Report Pages | 309 |
| By Type |
|
| By Application |
|
| By Technology |
|
| By Region |
|
| Key Market Players | Powermat, WiTricity Corporation, TDK Corporation, Renesas Electronics Corporation, Samsung Electronics Co. Ltd., Texas Instruments Incorporated, Qualcomm Technologies, Inc., Murata Manufacturing Co., Ltd., Energous Corporation, NXP Semiconductors |
Analyst Review
The wireless power transmission market is poised for significant growth and transformation in the coming years, driven by technological advancements and rise in consumer demand for convenience and efficiency.
The adoption of electric vehicles (EVs) is a major driver for wireless power transmission technology. The need for efficient and user-friendly charging solutions is paramount as the EV market expands. Wireless charging systems for EVs, such as those being developed by WiTricity and General Motors, are at the forefront to eliminate the hassle of plug-in charging, making EVs more appealing to a broader audience. This convenience factor is likely to accelerate the adoption of wireless charging infrastructure in public and private spaces.
In the consumer electronics sector, the integration of wireless charging technology into smartphones, wearables, and other devices is becoming increasingly common. Companies like Samsung and Apple are continuously innovating to enhance the efficiency and speed of wireless charging, making it a standard feature in their product ecosystems. This trend is expected to continue, with more devices supporting wireless power transmission, thereby driving the market growth.
Industrial applications also present significant opportunities for wireless power transmission. The ability to power sensors, robotics, and other equipment without the need for physical connectors can improve operational efficiency and safety in various settings. Innovations in this area, such as Ossia's new industrial wireless power systems, are likely to open new avenues for market expansion.
However, high cost of wireless power transmission technology as compared to traditional methods remains a barrier to widespread adoption. In addition, lack of standardization and presence of uncertified products can lead to safety concerns and hinder the market growth. Addressing these issues through regulatory frameworks and industry standards will be crucial for the market's long-term success.
Receiver application is the leading application of the wireless power transmission market.
The wireless power transmission market was valued at $9,642.0 million in 2023 and is estimated to reach $49,977.1 million by 2032, exhibiting a CAGR of 20.7% from 2024 to 2032.
The global wireless power transmission market is trending towards increased adoption in electric vehicle charging, consumer electronics, and industrial applications, driven by advancements in far-field and near-field technologies.
The Qualcomm Technologies, Inc, Texas Instruments Incorporated, WiTricity Corporation, Energous Corporation, and NXP Semiconductors.
Asia-Pacific is the largest region of the wireless power transmission market.
Loading Table Of Content...
Loading Research Methodology...

