
Yeast Extract Market Research, 2035
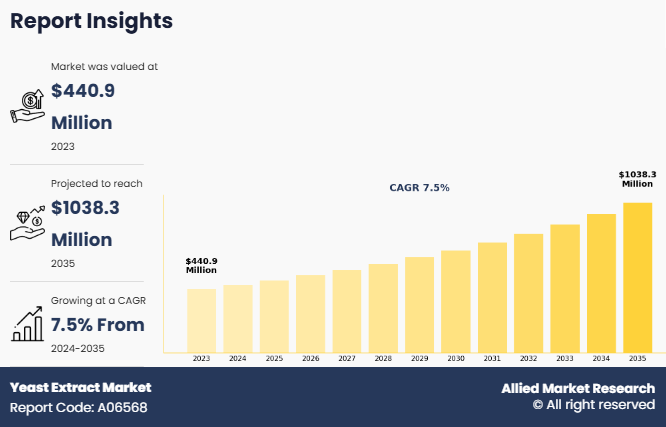
The global yeast extract market size was valued at $440.9 million in 2023, and is projected to reach $1 billion by 2035, growing at a CAGR of 7.5% from 2024 to 2035. The cell contents of yeast, usually Saccharomyces cerevisiae, are used to make yeast extract, a natural component. Since it is high in proteins, amino acids, vitamins, and minerals, it is used in different sector such as cosmetics and food & beverages sector. Yeast extract is a popular nutrient source for microbial and cell culture growth media in the biotechnology and pharmaceutical industries. The umami taste of this substance makes it useful as a flavor enhancer in the food and beverage sectors. Furthermore, yeast extract supports skin health and nutrition in animal feed and cosmetics. Both, liquid and dry versions are available for a variety of applications.
MARKET DYNAMICS
The yeast extract market growth is driven by a variety of uses in food, beverage, pharmaceutical, and biotechnology industries, highlighting its wide range of uses as a nutrient-dense and naturally occurring taste enhancer. The growing demand for natural and clean-label ingredients in the food and beverage sector is a major factor that is fueling the need for yeast extracts, as consumers place greater emphasis on their health and well-being. As a natural substitute for chemical additives and monosodium glutamate (MSG), yeast extract appeals to consumers who are health-conscious while still satisfying clean labeling regulations. Yeast extract is widely used in the biotechnology and pharmaceutical industries as a growth medium for microbial cultures and cell lines, which is crucial for biopharmaceutical research, vaccine manufacturing, and drug development. Its importance in these sectors has been further enhanced by rise in demand for biologics and developments in fermentation technology.
On the supply side, new developments in fermentation methods and yeast extraction techniques have improved product quality and broadened the product line to meet the unique requirements of different end-use sectors. However, the market faces challenges such as the reliance on agricultural inputs, which can affect production costs, and the volatility of raw material prices. Furthermore, yeast extract market expansion is threatened by competition from synthetic substitutes and other plant-based extracts, especially in cost-sensitive industries.
North America and Europe dominate the market owing to their well-established food processing industries as well as their sophisticated pharmaceutical and biotechnology sectors. In contrast, booming food industries, rise in health consciousness, and rising biopharmaceutical investments are propelling the rapid expansion of emerging markets in Asia-Pacific and Latin America. Due to their substantial populations and growing consumer expenditure on health-related products, China, India, and Brazil stand out as important growth markets.
Sustainability trends have an impact on the market as well; eco-friendly production methods and the usage of non-GMO yeast strains are becoming more and more important to comply with environmental standards and consumer preferences. The top companies for yeast extract are concentrating on strategic alliances, mergers, and acquisitions to increase their manufacturing capabilities and fortify their worldwide presence. Innovation in products, including the creation of yeast extracts with specialized flavors or nutritional benefits, is also essential for propelling market expansion.
In addition, the yeast extract market demand is further increased by the growing use of the extract in plant-based and alternative protein diets. The use of yeast extract in plant-based formulations due to its umami flavor and protein content is growing in popularity as global diets become more vegan and vegetarian.
As a result of its numerous applications, clean-label appeal, and contribution to the progress of biopharmaceutical and biotechnology research, the yeast extract market is poised for rapid expansion. Despite difficulties such as competition and cost fluctuations, the industry continues to develop as a result of innovation, environmental programs, and rising demand in new markets.
SEGMENT OVERVIEW
The yeast extract market is segmented on the basis of type, application, form, and region. By type, the market is divided into yeastolate, yeast extracts, and active dry yeast. By application, the market is bifurcated into pharmaceuticals and biotechnology. Further, the pharmaceuticals segment is divided into vaccine production, probiotics, antibiotic production, and biopharmaceuticals. The biotechnology segment is divided into cell culture media and enzyme production. By form, the market is bifurcated into liquid and dry. Region-wise, the market is analyzed across North America (the U.S., Canada, and Mexico), Europe (France, Germany, Italy, Spain, UK, Russia, and the rest of Europe), Asia-Pacific (China, Japan, India, South Korea, Australia, and the rest of Asia-Pacific), and LAMEA (Brazil, South Africa, Saudi Arabia, UAE, Argentina, and the rest of LAMEA).
BY TYPE

By type, the active dry yeast segment dominated the global yeast extract market in 2023 and is anticipated to maintain its dominance during the forecast period. The demand for active dry yeast, is driven by its crucial role in research, fermentation processes, and the manufacturing of biopharmaceuticals. Proteins, vitamins, and minerals found in active dry yeast, which is well-known for having a rich nutritional profile, promote microbial growth and the production of bioactive chemicals. It is widely employed in the synthesis of enzymes, vaccines, antibiotics, and other physiologically active compounds. Market expansion is facilitated by the growing pharmaceutical industry and rise in need for biotechnology developments. The use of active dry yeast in this industry is also being fueled by increase in biopharmaceutical research and development activities.
BY APPLICATION

By application, the pharmaceuticals segment dominated the global yeast extract market in 2023, owing to its widespread use as a natural component in medication formulations. The bioavailability of vital amino acids, vitamins, and minerals found in yeast extract is highly valued since it improves patient absorption and medication effectiveness. It is widely utilized in the manufacturing of probiotics, vaccines, and biopharmaceuticals. Yeast extract also acts as a growth medium for enzymes and antibiotics during fermentation operations. The growing need for natural and clean-label excipients in pharmaceutical products, as well as advancements in biotechnological applications that increase the usefulness of yeast extract in medication research, are further drive the market demand.
BY FORM

By form, the dry segment dominated the global yeast extract market in 2023 and is anticipated to maintain its dominance during the forecast period. The dry form segment is expanding significantly as it is widely used as a nutrient-rich medium in fermentation and cell culture procedures. Dry yeast extract, which has a long shelf life and great stability, is used extensively in the manufacturing of enzymes, vaccines, and antibiotics. Market is driven by rise in demand for biopharmaceuticals as well as developments in biotechnology. The focus of major players is on novel formulas and sustainable production. Furthermore, the need for premium yeast extract in the pharmaceutical industry is being further fueled by the increased focus on biotechnological research and development on a global scale.
BY REGION

Region-wise, Europe is predicted to dominate the market with the largest yeast extract market share during the yeast extract market forecast period. The yeast extract market in Europe is expanding significantly as a result of rising demand for functional and natural components in pharmaceutical formulations and biotechnology applications. The development of vaccines, enzymes, and medicinal proteins frequently uses yeast extracts as nutrient-rich additions. Regulatory clearances and rising biopharmaceutical research expenditures are propelling market growth in Europe. Leading companies in the area are concentrating on developing new products to provide yeast-based goods with improved functional qualities. The market for yeast extracts is further supported by the pharmaceutical industry's growing customer preference for clean-label and plant-based treatments.
COMPETITION ANALYSIS
The major players in the yeast extract industry include AngelYeast Co., Ltd., Associated British Foods PLC, CELLSECO LTD., FUJIFILM Irvine Scientific, Kerry Group, Lallemand Inc., LESAFFRE GROUP, Merck KGaA, Nu-Tek BioSciences, Thermo Fisher Scientific Inc., and VWR International, LLC.
SOME KEY DEVELOPMENTS IN THE MARKET
- In November 2021, Lesaffre ET Compagnie, SA opened a brand-new baking center in Dubai to expand its foothold in the Dubai market.
- In July 2021, Biospringer, a subsidiary of Lesaffre ET Compagnie, SA expanded its yeast production capacity in its factory in Cedar Rapids, Iowa to cater to the increase in demand.
Key Benefits For Stakeholders
- This report provides a quantitative analysis of the yeast extract market segments, current trends, estimations, and dynamics of the yeast extract market analysis from 2023 to 2035 to identify the prevailing yeast extract market opportunities.
- The market research is offered along with information related to key drivers, restraints, and opportunities.
- Porter's five forces analysis highlights the potency of buyers and suppliers to enable stakeholders make profit-oriented business decisions and strengthen their supplier-buyer network.
- In-depth analysis of the yeast extract market segmentation assists to determine the prevailing market opportunities.
- Major countries in each region are mapped according to their revenue contribution to the global market.
- Market player positioning facilitates benchmarking and provides a clear understanding of the present position of the market players.
- The report includes the analysis of the regional as well as global yeast extract market trends, key players, market segments, application areas, and market growth strategies.
Yeast Extract Market Report Highlights
| Aspects | Details |
| Market Size By 2035 | USD 1 billion |
| Growth Rate | CAGR of 7.5% |
| Forecast period | 2023 - 2035 |
| Report Pages | 250 |
| By Form |
|
| By Type |
|
| By Application |
|
| By Region |
|
| Key Market Players | FUJIFILM Irvine Scientific, Kerry Group, LESAFFRE GROUP, Thermo Fisher Scientific Inc., CELLSECO LTD., Nu-Tek BioSciences, Merck KGaA, AngelYeast Co., Ltd., VWR International, LLC., Associated British Foods PLC, Lallemand Inc. |
Analyst Review
The perspectives of the leading CXOs in the yeast extract industry are presented in this section. The yeast extract market is expanding significantly due to its multiple applications in the manufacturing of therapeutic proteins, vaccines, and biologics. Since it contains essential nutrients including vitamins, peptides, and amino acids that promote cell development and increase the output of biopharmaceutical products, yeast extract is frequently employed in cell culture media. Yeast extract is an essential component of fermentation methods used in biotechnology to produce recombinant proteins, enzymes, and monoclonal antibodies. It facilitates cell culture, ensuring maximum growth and yield, an essential component of drug development. The need for effective and reasonably priced culture media, such as yeast extract, is growing as the demand for biologics, especially monoclonal antibodies and gene treatments, rises.
The importance of yeast extract is further increased by the growing emphasis on personalized medicine, which involves customizing therapies based on each patient's unique genetic profile. It facilitates the development of tailored treatments and advances precision medicine research and development. Despite this, the market faces challenges such as high manufacturing costs and volatility in yeast extract quality levels. Growing applications in new countries, as well as strategic relationships between suppliers and biotechnology businesses, present opportunities for creating specialized yeast extracts owing to the growing need for novel medical solutions.
The global yeast extract market size was valued at USD 440.9 million in 2023, and is projected to reach USD 1 billion by 2035
The global yeast extract market is projected to grow at a compound annual growth rate of 7.5% from 2024-2035 to reach USD 1 billion by 2035
The key players profiled in the reports includes AngelYeast Co., Ltd., Associated British Foods PLC, CELLSECO LTD., FUJIFILM Irvine Scientific, Kerry Group, Lallemand Inc., LESAFFRE GROUP, Merck KGaA, Nu-Tek BioSciences, Thermo Fisher Scientific Inc., and VWR International, LLC.
Europe dominated in 2023 and is projected to maintain its leading position throughout the forecast period.
Consumer Demand for Natural and Clean-Label Ingredients, Advancements in Fermentation Technology, Growth in the Biotechnology and Pharmaceutical Industries, Plant-Based and Alternative Protein Diets majorly contribute toward the growth of the market.
Loading Table Of Content...
Loading Research Methodology...

