
Yerba Mate Market Research, 2032
The global Yerba Mate Market Size was valued at $1.8 billion in 2022, and is projected to reach $2.9 billion by 2032, growing at a CAGR of 5.2% from 2023 to 2032.
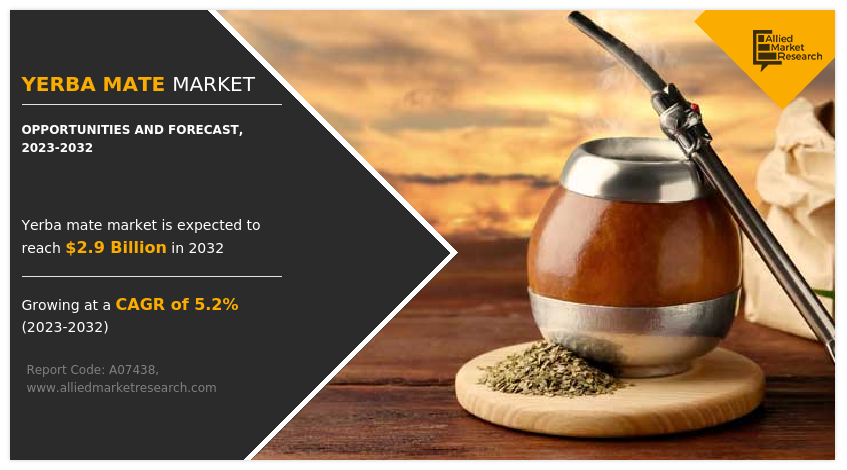
Yerba mate, commonly referred to as mate, stands as an herbal tea deeply rooted in Latin and South American traditions. Crafted by steeping dried leaves from the yerba mate plant in hot water, this versatile beverage can be enjoyed either hot or cold, offering a distinct flavor profile such as black or green tea. Yerba mate contains caffeine, providing consumers with a heightened sense of alertness and focus.
The production landscape of yerba mate tea is primarily concentrated in three key countries including Argentina, the largest producer, Brazil, and Paraguay with an estimated annual output of approximately 1.4 million tons. Interestingly, less than 5% of this production is earmarked for export, as the majority, constituting a national treasure, is intended for domestic consumption. Brazil consumes about 80% of the total production, highlighting the deeply ingrained cultural significance of yerba mate in the region. The dynamics of the industry reflect a balance between catering to local preferences and exploring international markets for this beloved herbal infusion.
The growth in beauty industry has driven an increased demand for yerba mate, particularly in the form of yerba mate powder or dry extract. The versatility of yerba mate is evident as it finds applications beyond traditional consumption, becoming a key ingredient in various personal care products. The yerba mate powder is utilized in the formulation of soaps, moisturizers, shampoos, conditioners, cologne, deodorant, hand and foot creams, as well as exfoliators. This trend is a testament to the diverse properties of the plant and its incorporation into an array of beauty and personal care items. yerba mate's The presence of yerba mate in the beauty sector is expected to expand further as consumer awareness of natural and beneficial ingredients continues to rise, creating opportunities for both the beauty industry and yerba mate producers.
Beyond its nutritional profile, yerba mate is embraced for its distinct flavor profile, offering a refreshing alternative to traditional teas and coffees. Its natural caffeine content provides an energy boost without the jitters often associated with other caffeinated beverages. The rise of specialty cafes and an increasing focus on mindful consumption contribute to yerba mate's popularity, creating a niche market for artisanal yerba mate blends and ready-to-drink products.
Moreover, the communal aspect of yerba mate consumption, often shared through a mate circle, adds a social dimension to the trend. As North American consumers seek unique and culturally diverse experiences, yerba mate stands out as an intriguing and socially engaging beverage option, indicative of a broader shift towards exploration and appreciation of global flavors and traditions.
The rising trend of wellness-focused lifestyles in North America positions yerba mate as a natural fit. With its abundance of antioxidants, vitamins, and minerals, yerba mate caters to health-conscious consumers looking for functional and nutritious drink options. The beverage industry has witnessed a surge in demand for culturally significant and socially shared experiences, and yerba mate's communal preparation using a shared gourd and bombilla fosters a sense of community and social connection.
Yerba mate powder boasts a delicate and captivating fragrance, making it a sought-after product for individuals aiming to enhance their physical well-being. Beyond its aromatic appeal, this product also contributes to improved blood circulation, making it particularly popular among those seeking to refine their body aesthetics by addressing concerns such as cellulite and localized fat. The dual benefits of the product, encompassing both sensory allure and potential health advantages, position it as an appealing choice for consumers conscious of both wellness and beauty. The yerba mate powder aligns with the preferences of individuals aspiring to enhance their overall health and appearance with its unique combination of fragrance and physiological benefits.
Yerba mate dry extract serves as a therapeutic and astringent solution, enriched with polyphenols that act as preventive agents against premature aging of both skin and hair. This extract effectively mitigates inflammation induced by ultraviolet rays, safeguarding collagen of the skin and crucial element for maintaining elasticity and firmness of tissues. The polyphenols present contribute to the overall health and resilience of the skin and hair. The yerba mate dry extract emerges as a versatile solution for skincare, offering protection against environmental stressors and promoting the preservation of essential components vital for skin health with their healing properties. Its multifaceted benefits make it a valuable ingredient in various skincare products, addressing concerns related to aging, inflammation, and collagen protection.
Long-term and excessive intake has been linked to an elevated risk of certain types of cancer despite the potential health benefits associated with moderate yerba mate consumption, such as those affecting the mouth, throat, and lungs. Studies indicate that individuals who regularly consume 1 to 2 liters (equivalent to 4 to 8 cups) of yerba mate daily may face an increased risk, particularly if they are also smokers or heavy alcohol consumers. Pregnant individuals are advised to consult with a healthcare provider before incorporating yerba mate into their routine, as its effects on pregnancy are not yet fully understood. It is crucial for consumers to be aware of these potential health risks and make informed decisions about their yerba mate consumption, taking into consideration individual health conditions and lifestyle choices.
Segmental overview
The yerba mate market is segmented on the basis of type, application, distribution channel and region. On the basis of type, the market is classified as powder, concentrate and others. On the basis of application, the market is classified into dietary supplements, functional food, food beverage, and cosmetics & personal care. On the basis of on distribution channel, the market is classified into retail store, hypermarkets/supermarkets, online stores and others. On the basis of region, the market is studied across North America, Europe, Asia-Pacific, and LAMEA.
By Type

Based on type, the powder segment dominated the global market in the year 2022 and is expected to remain dominant during the forecast period. Powdered yerba mate offers convenience and versatility in consumption, allowing consumers to easily incorporate it into various beverages and food products. The powder format provides a quick and efficient way to enjoy the nutritional benefits of yerba mate, aligning with the fast-paced lifestyles of modern consumers.
Moreover, the powdered form facilitates precise dosage control, enabling individuals to tailor their yerba mate intake according to personal preferences. The convenience of storage and transportation further enhances the appeal of powdered yerba mate for both manufacturers and consumers. In addition, the powder segment has witnessed continuous innovation, with companies introducing flavored and functional variants, expanding its usage beyond traditional tea preparations. Overall, the convenience of powder segment, adaptability, and ongoing product development initiatives have positioned it as the preferred choice, driving its dominance in the global yerba mate market.
By Application

Based on application, the food & beverage segment dominated the global market in the year 2022 and is expected to remain dominant during the forecast period. Distinct flavor profile of Yerba mate, coupled with its rich nutrient content, positions it as an ideal ingredient in various food & beverage products. In the beverage sector, yerba mate has gained traction as a healthier alternative to traditional caffeinated drinks, offering a natural energy boost without the drawbacks associated with some other beverages. In addition, the incorporation of yerba mate into ready-to-drink formulations, teas, and energy drinks has expanded its consumer base. In the food industry, unique taste of yerba mate makes it a desirable addition to snacks, confectionery, and functional food products, aligning with the growth in consumer preference for health-conscious and flavor-enhanced options. As a result, the food & beverage segment remains at the forefront, driving the global overall growth and prominence of yerba mate market.
By Distribution Channel

Based on distribution channel, retail stores dominated the global market in the year 2022 and is expected to remain dominant during the forecast period. The dominance of the retail stores segment in the global yerba mate market is attributed to the accessibility and convenience it offers to consumers. Retail stores, including supermarkets, hypermarkets, and specialty stores, serve as key distribution channels for yerba mate products, ensuring widespread availability. Consumers often prefer the physical shopping experience, allowing them to browse and compare different brands and product variants. Retail stores provide a direct point of contact, enabling consumers to make informed purchase decisions based on factors such as packaging, pricing, and product positioning. In addition, the retail environment facilitates promotional activities, enhancing product visibility and attracting a broader consumer base. The tangible presence of yerba mate in retail stores aligns with consumer habits, contributing to dominance of the segment in the market distribution channels.
By Region

Based on region, Asia-Pacific region dominated the global market in the year 2022 and is likely to remain dominant during the forecast period. The yerba mate market is witnessing rapid Yerba Mate Market Growth globally due to increased health awareness and a rising Yerba Mate Market Demand for healthy and nutritional products, particularly in the Asia-Pacific region. Additionally, the market in this region is fueled by a growing population with a penchant for health-conscious choices.
Furthermore, the yerba mate market in the Asia-Pacific region is characterized by dynamic economic factors and cultural preferences that favor the consumption of yerba mate products. As a result, the market in this region held a significant Yerba Mate Market Share in 2022 and is expected to continue its dominance during the Yerba Mate Market Forecast period from 2023 to 2032.
Competition Analysis
The players operating in the global Yerba Mate Industry have adopted various developmental strategies to increase their market share, gain profitability, and remain competitive in the market. The key players included in the yerba mate Yerba Mate Market Analysis are Amanda, La Hoja, Cruz de Malta, Canarias, Taragi, Playadito, Rosamonte, Nobleza Gaucha, Kraus Organica, Union, Aguantadora, Pipore, Pajarito, Colon, and Selecta
Key Benefits For Stakeholders
- This report provides a quantitative analysis of the market segments, current trends, estimations, and dynamics of the yerba mate market analysis from 2022 to 2032 to identify the prevailing yerba mate market opportunities.
- The market research is offered along with information related to key drivers, restraints, and opportunities.
- Porter's five forces analysis highlights the potency of buyers and suppliers to enable stakeholders make profit-oriented business decisions and strengthen their supplier-buyer network.
- In-depth analysis of the yerba mate market segmentation assists to determine the prevailing market opportunities.
- Major countries in each region are mapped according to their revenue contribution to the global market.
- Market player positioning facilitates benchmarking and provides a clear understanding of the present position of the market players.
- The report includes the analysis of the regional as well as global yerba mate market trends, key players, market segments, application areas, and market growth strategies.
Yerba Mate Market Report Highlights
| Aspects | Details |
| Forecast period | 2022 - 2032 |
| Report Pages | 300 |
| By Type |
|
| By Application |
|
| By Distribution Channel |
|
| By Region |
|
| Key Market Players | Rosamonte, Amanda, Playadito, Taragüi, La Hoja, Aguantadora, pajarito powder, llc, Cruz de Malta, Canarias |
Analyst Review
The global yerba mate market has experienced a surge in popularity, driven by a confluence of factors that cater to the evolving preferences of health-conscious consumers. Derived from the leaves of the Ilex paraguariensis plant, yerba mate has deep cultural roots in South America, particularly in countries such as Argentina, Brazil, and Uruguay. However, its appeal has transcended regional boundaries, making it a sought-after beverage worldwide.
One of the primary drivers propelling the yerba mate market is the increase in global focus on health and wellness. Yerba mate is renowned for its rich antioxidant content, vitamins, and minerals. Yerba mate stands out for its potential health benefits as consumers seek natural alternatives to traditional caffeinated beverages, including improved mental focus and energy without the jitters often associated with coffee.
The versatility of yerba mate contributes significantly to its market growth. Traditionally consumed as a hot or cold beverage, yerba mate has expanded its presence in the market through innovative product formulations. Ready-to-drink yerba mate beverages, mate-infused energy drinks, and yerba mate blends with various flavors cater to diverse consumer preferences, thereby broadening its market reach.
The association of yerba mate with South American cultural practices adds to its allure. Brands have capitalized on this cultural appeal to position yerba mate as a trendy and socially conscious beverage choice. Furthermore, the sustainable cultivation practices associated with yerba mate production align with the growth in consumer Yerba Mate Market Demandfor ethically sourced and eco-friendly products.
The yerba mate market has witnessed heightened competition, with both traditional and new players vying for market share. Product innovation remains a key strategy, with companies introducing novel yerba mate-infused products to capture consumer interest. Collaborations with other beverage industries and strategic marketing efforts have further intensified the competitive landscape.
The global Yerba Mate Market Size was valued at $1.8 billion in 2022, and is projected to reach $2.9 billion by 2032
The global Yerba Mate market is projected to grow at a compound annual growth rate of
The key players included in the yerba mate Yerba Mate Market Analysis are Amanda, La Hoja, Cruz de Malta, Canarias, Taragi, Playadito, Rosamonte, Nobleza Gaucha, Kraus Organica, Union, Aguantadora, Pipore, Pajarito, Colon, and Selecta
Based on region, Asia-Pacific region dominated the global market in the year 2022 and is likely to remain dominant during the forecast period.
Rise in Interest in Functional Beverages, Cultural and Social Influences
Loading Table Of Content...
Loading Research Methodology...

