0
New
New
2023
Zero Liquid Discharge System Market

Zero Liquid Discharge System Market

by System Type (Conventional ZLD systems, Hybrid ZLD systems), by Process Type (Pretreatment, Evaporation and Crystallization), by End User (Chemicals and Petrochemicals, Food and beverages, Textiles, Pharmaceuticals, Others): Global Opportunity Analysis and Industry Forecast, 2023-2032

Report Code: A12228
May 2023 | Pages: 260
Tables: 117
Charts: 54
  • Formats*:

  • pdf

    Single User License, Five User
    License & Enterprise User License

  • xls

    Data Pack Excel License

  • ppt

    It comes with the additional cost
    of $2500.00 contact sales.


Zero Liquid Discharge System Market Research, 2032

The global zero liquid discharge system market size was valued at $6.1 billion in 2022, and is projected to reach $11.2 billion by 2032, growing at a CAGR of 6.2% from 2023 to 2032. Zero Liquid Discharge (ZLD) is an industrial wastewater treatment method that processes liquid discharge and produces solid waste. The process involves using a combination of processes to treat the waste solids and recover clean water for reuse.
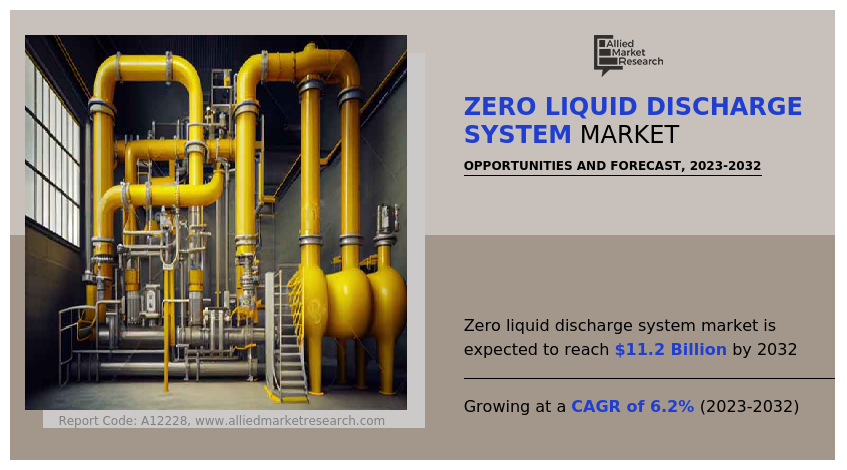
The growth of the global manufacturing industry gives rise to increased generation of industrial wastewater. Furthermore, governments across the globe are introducing new rules and regulations for the disposal of industrial wastewater, in order to reduce its negative environmental impact. These factors create a demand for more efficient industrial wastewater treatment systems, thereby, positively influencing the zero liquid discharge system market.

Zero Liquid Discharge System Market

Market dynamics

The textile industry is one of the largest water-consuming industries globally and generates significant amounts of wastewater during the manufacturing process. With rise in concerns about water scarcity and environmental regulations, textile manufacturers are increasingly adopting zero liquid discharge (ZLD) systems to treat and recycle their wastewater. ZLD systems allow textile manufacturers to recover & reuse water, reduce freshwater consumption, and eliminate wastewater discharge into the environment. As a result, the demand for ZLD systems in the textile industry has increased, driving the zero liquid discharge system market growth.

The growth of the food and beverage industry has led to a corresponding increase in demand for zero liquid discharge systems, as companies seek to reduce their environmental footprint and improve their sustainability credentials. This trend is expected to continue in the coming years, with the global zero liquid discharge system market projected to grow at a significant rate.

Moreover, the high capital costs involved in setting up zero liquid discharge systems can be a major obstacle for many industries, especially those that are already dealing with other significant investments. In addition, the operating costs associated with zero liquid discharge systems can be high due to the need for specialized equipment, chemicals, and maintenance.

The demand for zero liquid discharge system decreased in the year 2020, owing to low demand from different industries due to lockdowns imposed by the government of many countries. The COVID-19 pandemic had shut down the production of various industries, mainly owing to prolonged lockdowns in major global countries. This hampered the growth of the zero liquid discharge system market significantly during the pandemic. The major demand for zero liquid discharge system was previously noticed from giant manufacturing countries including the U.S., Germany, Italy, the UK, and China, which was severely affected by the spread of coronavirus, thereby halting demand for zero liquid discharge system. Moreover, the market has recovered due to the launch of COVID-19 vaccine due to which the government has relaxed the lockdown norms.

Advancements in technology have created an opportunity for the Zero Liquid Discharge (ZLD) system market to provide more efficient and sustainable solutions for industries facing water scarcity and pollution challenges. The development of improved membrane technologies, automation & monitoring systems, advanced analytics & machine learning, and the use of renewable energy sources such as solar and wind have made ZLD systems more efficient and cost-effective. The integration of ZLD with other water treatment technologies such as reverse osmosis and thermal treatment can improve overall water quality and reduce costs. Such trends are expected to offer lots of opportunities in emerging countries for the growth of the zero liquid discharge system market.

Segmental Overview

The zero liquid discharge system market is segmented into System Type, Process Type, End User, and region. By system type, the market is divided into conventional ZLD systems, and hybrid ZLD systems. By process type, the market is classified into pretreatment and evaporation & crystallization. By end user, the market is categorized into chemicals & petrochemicals, food & beverages, textiles, pharmaceuticals, and others. Region wise, the market is analyzed across North America (the U.S., Canada, and Mexico), Europe (the UK, France, Germany, Italy, and rest of Europe), Asia-Pacific (China, Japan, India, and rest of Asia-Pacific), and LAMEA (Latin America, the Middle East, and Africa).
Zero Liquid Discharge System Market

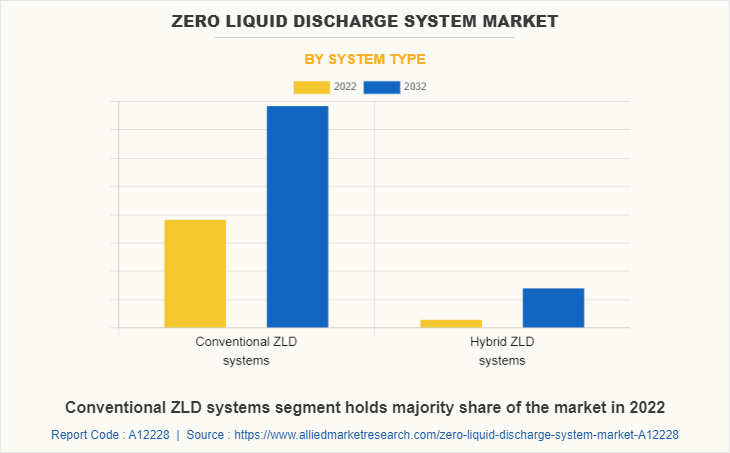
By system type: The zero liquid discharge system market is categorized into conventional ZLD systems, and hybrid ZLD systems. Conventional Zero Liquid Discharge (ZLD) systems are wastewater treatment systems that aim to eliminate the discharge of liquid waste from industrial processes. These systems typically use a combination of pre-treatment processes, such as filtration and sedimentation, and advanced separation technologies, such as reverse osmosis and evaporation, to treat the wastewater and recover clean water for reuse, while producing a solid waste stream that can be safely disposed of. Conventional ZLD systems are widely used in industries such as power generation, chemical manufacturing, and textile production. Hybrid Zero Liquid Discharge (ZLD) systems are wastewater treatment systems that combine multiple technologies, such as conventional ZLD systems and thermal treatment, to achieve a higher level of wastewater treatment and resource recovery.
Zero Liquid Discharge System Market

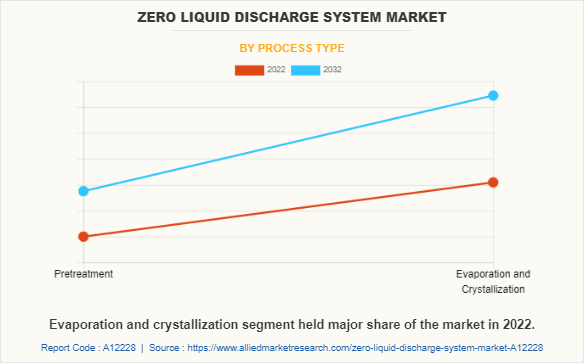
By process type: The zero liquid discharge system market is classified into pretreatment and evaporation & crystallization. Pretreatment for zero liquid discharge (ZLD) systems involves removing solids, oils, and other contaminants from wastewater before it enters the main ZLD system. This ensures that the ZLD system operates efficiently and prolongs the lifespan of its components. Evaporation and crystallization are two processes used in Zero Liquid Discharge (ZLD) systems to remove water from the wastewater stream. In the evaporation process, wastewater is heated and the water is vaporized and separated from the solids. In crystallization, the concentrated wastewater is further processed to produce solid salts or crystals that can be safely disposed of, while recovering clean water for reuse.
Zero Liquid Discharge System Market

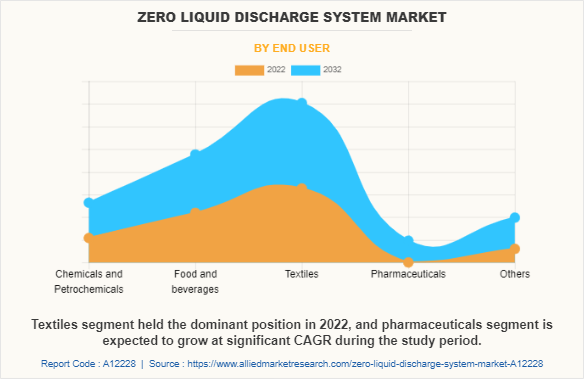
By end user: The zero liquid discharge system market is divided into chemicals & petrochemicals, food & beverages, textiles, pharmaceuticals, and others. The food & beverages industry includes processing of raw agricultural produce into processed food & beverages. ZLD system in food & beverages processing are used for recovering from wastewater stream, reducing water consumption and discharge while leaving behind solid waste for disposal. Petrochemicals are produced using a variety of chemical substances, primarily hydrocarbons. Crude oil and natural gas are the sources of these hydrocarbons. Naphtha, kerosene, and petrol oil are the three main feedstocks for the petrochemical sector among the many fractions produced by distillation of crude oil. Pharmaceuticals include spirits, elixirs, and tinctures. In addition, Ointments are one of numerous semisolid remedies, along with creams, pastes, and jellies. Pills, tablets, lozenges, and suppositories are examples of solid medications. Production plants in pharmaceuticals requires Zero Liquid Discharge (ZLD) systems for removing waste from water. The other industries include energy & power, oil and gas, metallurgy and mining, which utilize zero liquid discharge (ZLD) on a considerable scale. These industries mainly utilize zero liquid discharge (ZLD) for wastewater management. The textiles segment is expected to exhibit the largest revenue share during the forecast period. The pharmaceuticals segment is expected to exhibit the highest CAGR during the forecast period.
Zero Liquid Discharge System Market

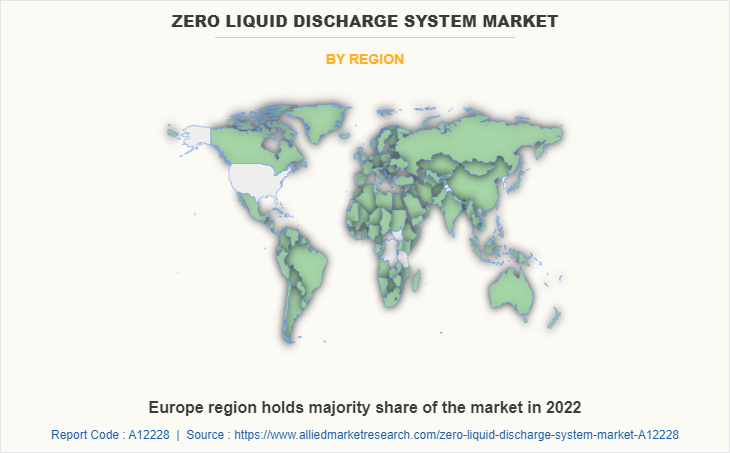
By region: The zero liquid discharge system market is analyzed across North America, Europe, Asia-Pacific, and LAMEA. In 2022, Europe held the highest revenue in zero liquid discharge system market share. And Asia-Pacific is expected to exhibit the highest CAGR during the forecast period.

Competition analysis 

The major players profiled in the zero liquid discharge system market forecast report include Aquarion AG, Aquatech International LLC,Condorchem Envitec., Lenntech B.V., Gea Group, H2O GmbH, Oasys Water, Inc., Praj Industries Ltd., Veolia Water Technologies, and SafBon Water Technology.

Major companies in the market have adopted several key developmental strategies such as product launch, and business expansion to offer better products and services to customers and maintain their market share in the zero liquid discharge system industry.

Some examples of instances that support the market growth.

In March 2023, Aquatech International LLC., a leading water purification solutions provider, and Fluid Technology Solutions, Inc., which is a manufacturer of separation technologies and advanced membranes, formed a partnership to provide innovative water treatment technology and process solutions in significant sectors such as brine mining, inland desalination, and zero liquid discharge systems.

In February 2023, SunOpta Inc., a renowned manufacturer of food & beverages products, announced the opening of its brand-new plant-based beverage manufacturing facility in Midlothian, Texas. This new production facility is 285,000 square feet in size and has the ability to be expanded to 400,000 square feet to accommodate future development. Such factors are expected to play a crucial role in the growth of the zero liquid discharge systems market.

In October 2022, BASF SE, which is a leading manufacturer of chemical products, invested in Neopentyl Glycol (NPG) plant, which has an 80 thousands metric tons annual manufacturing capability at its newly built Zhanjiang Verbund plant in China.

In August 2022, Unilever invested in two Mexican food factories to boost production capacity and meet demand for both the domestic and international markets. Such instances are expected to increase the demand of zero liquid discharge systems.

Key Benefits For Stakeholders

  • This report provides a quantitative analysis of the market segments, current trends, estimations, and dynamics of the zero liquid discharge system market analysis from 2022 to 2032 to identify the prevailing zero liquid discharge system market opportunities.
  • The market research is offered along with information related to zero liquid discharge system market overview, key drivers, restraints, and opportunities.
  • Porter's five forces analysis highlights the potency of buyers and suppliers to enable stakeholders make profit-oriented business decisions and strengthen their supplier-buyer network.
  • In-depth analysis of the zero liquid discharge system market segmentation assists to determine the prevailing market opportunities.
  • Major countries in each region are mapped according to their revenue contribution to the global market.
  • Market player positioning facilitates benchmarking and provides a clear understanding of the present position of the market players.
  • The report includes the analysis of the regional as well as global zero liquid discharge system market trends, key players, market segments, application areas, market growth strategies, and overall zero liquid discharge system market outlook.

Zero Liquid Discharge System Market Report Highlights

Aspects Details
Market Size By 2032 USD 11.2 billion
Growth Rate CAGR of 6.2%
Forecast period 2022 - 2032
Report Pages 260
By System Type
  • Conventional ZLD systems
  • Hybrid ZLD systems
By Process Type
  • Pretreatment
  • Evaporation and Crystallization
By End User
  • Chemicals and Petrochemicals
  • Food and beverages
  • Textiles
  • Pharmaceuticals
  • Others
By Region
  • North America  (U.S., Canada, Mexico)
  • Europe  (Germany, UK, France, Italy, Rest of Europe)
  • Asia-Pacific  (China, Japan, India, South Korea, Rest of Asia-Pacific)
  • LAMEA  (Latin America, Middle East, Africa)
Key Market Players Veolia, Lenntech B.V., Aquarion AG, SafBon Water Technology, H2O GmbH, GEA Group Aktiengesellschaft, Aquatech International LLC., Oasys Water, Inc., Praj Industries Ltd., Condorchem Envitech

Analyst Review

The zero liquid discharge system is used to eliminate liquid discharge and produce solid waste in industrial wastewater. The market for ZLD systems is expected to witness significant growth in the coming years as the textile industry continues to expand and adopt sustainable manufacturing practices. In addition, the rise in adoption of ZLD systems in other industries such as power generation, chemicals, and pharmaceuticals is anticipated to contribute to the growth of the ZLD system market. In addition, ZLD system market has seen significant growth as a result of these regulations, with industries such as power generation, oil & gas, and chemicals leading the way. ZLD systems not only comply with government regulations, and, also provide and environmental benefits by reducing water consumption and minimizing the discharge of pollutants. However, the high initial and operating costs associated with these systems can be a significant restraint for the ZLD system market growth. In addition, the use of nanomaterials, advanced sensors & control systems, AI, and data analytics can optimize ZLD system operation and minimize energy consumption and waste generation. Overall, advancements in technology provide an opportunity for the ZLD system market.

 
  • CHAPTER 1: INTRODUCTION

    • 1.1. Report description

    • 1.2. Key market segments

    • 1.3. Key benefits to the stakeholders

    • 1.4. Research Methodology

      • 1.4.1. Primary research

      • 1.4.2. Secondary research

      • 1.4.3. Analyst tools and models

  • CHAPTER 2: EXECUTIVE SUMMARY

    • 2.1. CXO Perspective

  • CHAPTER 3: MARKET OVERVIEW

    • 3.1. Market definition and scope

    • 3.2. Key findings

      • 3.2.1. Top impacting factors

      • 3.2.2. Top investment pockets

    • 3.3. Porter’s five forces analysis

      • 3.3.1. Bargaining power of suppliers

      • 3.3.2. Bargaining power of buyers

      • 3.3.3. Threat of substitutes

      • 3.3.4. Threat of new entrants

      • 3.3.5. Intensity of rivalry

    • 3.4. Market dynamics

      • 3.4.1. Drivers

        • 3.4.1.1. Growth of textile industry
        • 3.4.1.2. Growth of food & beverage industry
        • 3.4.1.3. Government regulations for industrial waste disposal

      • 3.4.2. Restraints

        • 3.4.2.1. High initial and operating cost

      • 3.4.3. Opportunities

        • 3.4.3.1. Advancements in technology

    • 3.5. COVID-19 Impact Analysis on the market

  • CHAPTER 4: ZERO LIQUID DISCHARGE SYSTEM MARKET, BY SYSTEM TYPE

    • 4.1. Overview

      • 4.1.1. Market size and forecast

    • 4.2. Conventional ZLD systems

      • 4.2.1. Key market trends, growth factors and opportunities

      • 4.2.2. Market size and forecast, by region

      • 4.2.3. Market share analysis by country

    • 4.3. Hybrid ZLD systems

      • 4.3.1. Key market trends, growth factors and opportunities

      • 4.3.2. Market size and forecast, by region

      • 4.3.3. Market share analysis by country

  • CHAPTER 5: ZERO LIQUID DISCHARGE SYSTEM MARKET, BY PROCESS TYPE

    • 5.1. Overview

      • 5.1.1. Market size and forecast

    • 5.2. Pretreatment

      • 5.2.1. Key market trends, growth factors and opportunities

      • 5.2.2. Market size and forecast, by region

      • 5.2.3. Market share analysis by country

    • 5.3. Evaporation and Crystallization

      • 5.3.1. Key market trends, growth factors and opportunities

      • 5.3.2. Market size and forecast, by region

      • 5.3.3. Market share analysis by country

  • CHAPTER 6: ZERO LIQUID DISCHARGE SYSTEM MARKET, BY END USER

    • 6.1. Overview

      • 6.1.1. Market size and forecast

    • 6.2. Chemicals and Petrochemicals

      • 6.2.1. Key market trends, growth factors and opportunities

      • 6.2.2. Market size and forecast, by region

      • 6.2.3. Market share analysis by country

    • 6.3. Food and beverages

      • 6.3.1. Key market trends, growth factors and opportunities

      • 6.3.2. Market size and forecast, by region

      • 6.3.3. Market share analysis by country

    • 6.4. Textiles

      • 6.4.1. Key market trends, growth factors and opportunities

      • 6.4.2. Market size and forecast, by region

      • 6.4.3. Market share analysis by country

    • 6.5. Pharmaceuticals

      • 6.5.1. Key market trends, growth factors and opportunities

      • 6.5.2. Market size and forecast, by region

      • 6.5.3. Market share analysis by country

    • 6.6. Others

      • 6.6.1. Key market trends, growth factors and opportunities

      • 6.6.2. Market size and forecast, by region

      • 6.6.3. Market share analysis by country

  • CHAPTER 7: ZERO LIQUID DISCHARGE SYSTEM MARKET, BY REGION

    • 7.1. Overview

      • 7.1.1. Market size and forecast By Region

    • 7.2. North America

      • 7.2.1. Key trends and opportunities

      • 7.2.2. Market size and forecast, by System Type

      • 7.2.3. Market size and forecast, by Process Type

      • 7.2.4. Market size and forecast, by End User

      • 7.2.5. Market size and forecast, by country

        • 7.2.5.1. U.S.
          • 7.2.5.1.1. Key market trends, growth factors and opportunities
          • 7.2.5.1.2. Market size and forecast, by System Type
          • 7.2.5.1.3. Market size and forecast, by Process Type
          • 7.2.5.1.4. Market size and forecast, by End User
        • 7.2.5.2. Canada
          • 7.2.5.2.1. Key market trends, growth factors and opportunities
          • 7.2.5.2.2. Market size and forecast, by System Type
          • 7.2.5.2.3. Market size and forecast, by Process Type
          • 7.2.5.2.4. Market size and forecast, by End User
        • 7.2.5.3. Mexico
          • 7.2.5.3.1. Key market trends, growth factors and opportunities
          • 7.2.5.3.2. Market size and forecast, by System Type
          • 7.2.5.3.3. Market size and forecast, by Process Type
          • 7.2.5.3.4. Market size and forecast, by End User
    • 7.3. Europe

      • 7.3.1. Key trends and opportunities

      • 7.3.2. Market size and forecast, by System Type

      • 7.3.3. Market size and forecast, by Process Type

      • 7.3.4. Market size and forecast, by End User

      • 7.3.5. Market size and forecast, by country

        • 7.3.5.1. Germany
          • 7.3.5.1.1. Key market trends, growth factors and opportunities
          • 7.3.5.1.2. Market size and forecast, by System Type
          • 7.3.5.1.3. Market size and forecast, by Process Type
          • 7.3.5.1.4. Market size and forecast, by End User
        • 7.3.5.2. UK
          • 7.3.5.2.1. Key market trends, growth factors and opportunities
          • 7.3.5.2.2. Market size and forecast, by System Type
          • 7.3.5.2.3. Market size and forecast, by Process Type
          • 7.3.5.2.4. Market size and forecast, by End User
        • 7.3.5.3. France
          • 7.3.5.3.1. Key market trends, growth factors and opportunities
          • 7.3.5.3.2. Market size and forecast, by System Type
          • 7.3.5.3.3. Market size and forecast, by Process Type
          • 7.3.5.3.4. Market size and forecast, by End User
        • 7.3.5.4. Italy
          • 7.3.5.4.1. Key market trends, growth factors and opportunities
          • 7.3.5.4.2. Market size and forecast, by System Type
          • 7.3.5.4.3. Market size and forecast, by Process Type
          • 7.3.5.4.4. Market size and forecast, by End User
        • 7.3.5.5. Rest of Europe
          • 7.3.5.5.1. Key market trends, growth factors and opportunities
          • 7.3.5.5.2. Market size and forecast, by System Type
          • 7.3.5.5.3. Market size and forecast, by Process Type
          • 7.3.5.5.4. Market size and forecast, by End User
    • 7.4. Asia-Pacific

      • 7.4.1. Key trends and opportunities

      • 7.4.2. Market size and forecast, by System Type

      • 7.4.3. Market size and forecast, by Process Type

      • 7.4.4. Market size and forecast, by End User

      • 7.4.5. Market size and forecast, by country

        • 7.4.5.1. China
          • 7.4.5.1.1. Key market trends, growth factors and opportunities
          • 7.4.5.1.2. Market size and forecast, by System Type
          • 7.4.5.1.3. Market size and forecast, by Process Type
          • 7.4.5.1.4. Market size and forecast, by End User
        • 7.4.5.2. Japan
          • 7.4.5.2.1. Key market trends, growth factors and opportunities
          • 7.4.5.2.2. Market size and forecast, by System Type
          • 7.4.5.2.3. Market size and forecast, by Process Type
          • 7.4.5.2.4. Market size and forecast, by End User
        • 7.4.5.3. India
          • 7.4.5.3.1. Key market trends, growth factors and opportunities
          • 7.4.5.3.2. Market size and forecast, by System Type
          • 7.4.5.3.3. Market size and forecast, by Process Type
          • 7.4.5.3.4. Market size and forecast, by End User
        • 7.4.5.4. South Korea
          • 7.4.5.4.1. Key market trends, growth factors and opportunities
          • 7.4.5.4.2. Market size and forecast, by System Type
          • 7.4.5.4.3. Market size and forecast, by Process Type
          • 7.4.5.4.4. Market size and forecast, by End User
        • 7.4.5.5. Rest of Asia-Pacific
          • 7.4.5.5.1. Key market trends, growth factors and opportunities
          • 7.4.5.5.2. Market size and forecast, by System Type
          • 7.4.5.5.3. Market size and forecast, by Process Type
          • 7.4.5.5.4. Market size and forecast, by End User
    • 7.5. LAMEA

      • 7.5.1. Key trends and opportunities

      • 7.5.2. Market size and forecast, by System Type

      • 7.5.3. Market size and forecast, by Process Type

      • 7.5.4. Market size and forecast, by End User

      • 7.5.5. Market size and forecast, by country

        • 7.5.5.1. Latin America
          • 7.5.5.1.1. Key market trends, growth factors and opportunities
          • 7.5.5.1.2. Market size and forecast, by System Type
          • 7.5.5.1.3. Market size and forecast, by Process Type
          • 7.5.5.1.4. Market size and forecast, by End User
        • 7.5.5.2. Middle East
          • 7.5.5.2.1. Key market trends, growth factors and opportunities
          • 7.5.5.2.2. Market size and forecast, by System Type
          • 7.5.5.2.3. Market size and forecast, by Process Type
          • 7.5.5.2.4. Market size and forecast, by End User
        • 7.5.5.3. Africa
          • 7.5.5.3.1. Key market trends, growth factors and opportunities
          • 7.5.5.3.2. Market size and forecast, by System Type
          • 7.5.5.3.3. Market size and forecast, by Process Type
          • 7.5.5.3.4. Market size and forecast, by End User
  • CHAPTER 8: COMPETITIVE LANDSCAPE

    • 8.1. Introduction

    • 8.2. Top winning strategies

    • 8.3. Product Mapping of Top 10 Player

    • 8.4. Competitive Dashboard

    • 8.5. Competitive Heatmap

    • 8.6. Top player positioning, 2022

  • CHAPTER 9: COMPANY PROFILES

    • 9.1. Aquarion AG

      • 9.1.1. Company overview

      • 9.1.2. Key Executives

      • 9.1.3. Company snapshot

      • 9.1.4. Operating business segments

      • 9.1.5. Product portfolio

    • 9.2. Aquatech International LLC.

      • 9.2.1. Company overview

      • 9.2.2. Key Executives

      • 9.2.3. Company snapshot

      • 9.2.4. Operating business segments

      • 9.2.5. Product portfolio

    • 9.3. Condorchem Envitech

      • 9.3.1. Company overview

      • 9.3.2. Key Executives

      • 9.3.3. Company snapshot

      • 9.3.4. Operating business segments

      • 9.3.5. Product portfolio

    • 9.4. SafBon Water Technology

      • 9.4.1. Company overview

      • 9.4.2. Key Executives

      • 9.4.3. Company snapshot

      • 9.4.4. Operating business segments

      • 9.4.5. Product portfolio

    • 9.5. GEA Group Aktiengesellschaft

      • 9.5.1. Company overview

      • 9.5.2. Key Executives

      • 9.5.3. Company snapshot

      • 9.5.4. Operating business segments

      • 9.5.5. Product portfolio

      • 9.5.6. Business performance

    • 9.6. H2O GmbH

      • 9.6.1. Company overview

      • 9.6.2. Key Executives

      • 9.6.3. Company snapshot

      • 9.6.4. Operating business segments

      • 9.6.5. Product portfolio

    • 9.7. Oasys Water, Inc.

      • 9.7.1. Company overview

      • 9.7.2. Key Executives

      • 9.7.3. Company snapshot

      • 9.7.4. Operating business segments

      • 9.7.5. Product portfolio

    • 9.8. Praj Industries Ltd.

      • 9.8.1. Company overview

      • 9.8.2. Key Executives

      • 9.8.3. Company snapshot

      • 9.8.4. Operating business segments

      • 9.8.5. Product portfolio

      • 9.8.6. Business performance

    • 9.9. Veolia

      • 9.9.1. Company overview

      • 9.9.2. Key Executives

      • 9.9.3. Company snapshot

      • 9.9.4. Operating business segments

      • 9.9.5. Product portfolio

      • 9.9.6. Business performance

    • 9.10. Lenntech B.V.

      • 9.10.1. Company overview

      • 9.10.2. Key Executives

      • 9.10.3. Company snapshot

      • 9.10.4. Operating business segments

      • 9.10.5. Product portfolio

  • LIST OF TABLES

  • TABLE 01. GLOBAL ZERO LIQUID DISCHARGE SYSTEM MARKET, BY SYSTEM TYPE, 2022-2032 ($MILLION)
    TABLE 02. ZERO LIQUID DISCHARGE SYSTEM MARKET FOR CONVENTIONAL ZLD SYSTEMS, BY REGION, 2022-2032 ($MILLION)
    TABLE 03. ZERO LIQUID DISCHARGE SYSTEM MARKET FOR HYBRID ZLD SYSTEMS, BY REGION, 2022-2032 ($MILLION)
    TABLE 04. GLOBAL ZERO LIQUID DISCHARGE SYSTEM MARKET, BY PROCESS TYPE, 2022-2032 ($MILLION)
    TABLE 05. ZERO LIQUID DISCHARGE SYSTEM MARKET FOR PRETREATMENT, BY REGION, 2022-2032 ($MILLION)
    TABLE 06. ZERO LIQUID DISCHARGE SYSTEM MARKET FOR EVAPORATION AND CRYSTALLIZATION, BY REGION, 2022-2032 ($MILLION)
    TABLE 07. GLOBAL ZERO LIQUID DISCHARGE SYSTEM MARKET, BY END USER, 2022-2032 ($MILLION)
    TABLE 08. ZERO LIQUID DISCHARGE SYSTEM MARKET FOR CHEMICALS AND PETROCHEMICALS, BY REGION, 2022-2032 ($MILLION)
    TABLE 09. ZERO LIQUID DISCHARGE SYSTEM MARKET FOR FOOD AND BEVERAGES, BY REGION, 2022-2032 ($MILLION)
    TABLE 10. ZERO LIQUID DISCHARGE SYSTEM MARKET FOR TEXTILES, BY REGION, 2022-2032 ($MILLION)
    TABLE 11. ZERO LIQUID DISCHARGE SYSTEM MARKET FOR PHARMACEUTICALS, BY REGION, 2022-2032 ($MILLION)
    TABLE 12. ZERO LIQUID DISCHARGE SYSTEM MARKET FOR OTHERS, BY REGION, 2022-2032 ($MILLION)
    TABLE 13. ZERO LIQUID DISCHARGE SYSTEM MARKET, BY REGION, 2022-2032 ($MILLION)
    TABLE 14. NORTH AMERICA ZERO LIQUID DISCHARGE SYSTEM MARKET, BY SYSTEM TYPE, 2022-2032 ($MILLION)
    TABLE 15. NORTH AMERICA ZERO LIQUID DISCHARGE SYSTEM MARKET, BY PROCESS TYPE, 2022-2032 ($MILLION)
    TABLE 16. NORTH AMERICA ZERO LIQUID DISCHARGE SYSTEM MARKET, BY END USER, 2022-2032 ($MILLION)
    TABLE 17. NORTH AMERICA ZERO LIQUID DISCHARGE SYSTEM MARKET, BY COUNTRY, 2022-2032 ($MILLION)
    TABLE 18. U.S. ZERO LIQUID DISCHARGE SYSTEM MARKET, BY SYSTEM TYPE, 2022-2032 ($MILLION)
    TABLE 19. U.S. ZERO LIQUID DISCHARGE SYSTEM MARKET, BY PROCESS TYPE, 2022-2032 ($MILLION)
    TABLE 20. U.S. ZERO LIQUID DISCHARGE SYSTEM MARKET, BY END USER, 2022-2032 ($MILLION)
    TABLE 21. CANADA ZERO LIQUID DISCHARGE SYSTEM MARKET, BY SYSTEM TYPE, 2022-2032 ($MILLION)
    TABLE 22. CANADA ZERO LIQUID DISCHARGE SYSTEM MARKET, BY PROCESS TYPE, 2022-2032 ($MILLION)
    TABLE 23. CANADA ZERO LIQUID DISCHARGE SYSTEM MARKET, BY END USER, 2022-2032 ($MILLION)
    TABLE 24. MEXICO ZERO LIQUID DISCHARGE SYSTEM MARKET, BY SYSTEM TYPE, 2022-2032 ($MILLION)
    TABLE 25. MEXICO ZERO LIQUID DISCHARGE SYSTEM MARKET, BY PROCESS TYPE, 2022-2032 ($MILLION)
    TABLE 26. MEXICO ZERO LIQUID DISCHARGE SYSTEM MARKET, BY END USER, 2022-2032 ($MILLION)
    TABLE 27. EUROPE ZERO LIQUID DISCHARGE SYSTEM MARKET, BY SYSTEM TYPE, 2022-2032 ($MILLION)
    TABLE 28. EUROPE ZERO LIQUID DISCHARGE SYSTEM MARKET, BY PROCESS TYPE, 2022-2032 ($MILLION)
    TABLE 29. EUROPE ZERO LIQUID DISCHARGE SYSTEM MARKET, BY END USER, 2022-2032 ($MILLION)
    TABLE 30. EUROPE ZERO LIQUID DISCHARGE SYSTEM MARKET, BY COUNTRY, 2022-2032 ($MILLION)
    TABLE 31. GERMANY ZERO LIQUID DISCHARGE SYSTEM MARKET, BY SYSTEM TYPE, 2022-2032 ($MILLION)
    TABLE 32. GERMANY ZERO LIQUID DISCHARGE SYSTEM MARKET, BY PROCESS TYPE, 2022-2032 ($MILLION)
    TABLE 33. GERMANY ZERO LIQUID DISCHARGE SYSTEM MARKET, BY END USER, 2022-2032 ($MILLION)
    TABLE 34. UK ZERO LIQUID DISCHARGE SYSTEM MARKET, BY SYSTEM TYPE, 2022-2032 ($MILLION)
    TABLE 35. UK ZERO LIQUID DISCHARGE SYSTEM MARKET, BY PROCESS TYPE, 2022-2032 ($MILLION)
    TABLE 36. UK ZERO LIQUID DISCHARGE SYSTEM MARKET, BY END USER, 2022-2032 ($MILLION)
    TABLE 37. FRANCE ZERO LIQUID DISCHARGE SYSTEM MARKET, BY SYSTEM TYPE, 2022-2032 ($MILLION)
    TABLE 38. FRANCE ZERO LIQUID DISCHARGE SYSTEM MARKET, BY PROCESS TYPE, 2022-2032 ($MILLION)
    TABLE 39. FRANCE ZERO LIQUID DISCHARGE SYSTEM MARKET, BY END USER, 2022-2032 ($MILLION)
    TABLE 40. ITALY ZERO LIQUID DISCHARGE SYSTEM MARKET, BY SYSTEM TYPE, 2022-2032 ($MILLION)
    TABLE 41. ITALY ZERO LIQUID DISCHARGE SYSTEM MARKET, BY PROCESS TYPE, 2022-2032 ($MILLION)
    TABLE 42. ITALY ZERO LIQUID DISCHARGE SYSTEM MARKET, BY END USER, 2022-2032 ($MILLION)
    TABLE 43. REST OF EUROPE ZERO LIQUID DISCHARGE SYSTEM MARKET, BY SYSTEM TYPE, 2022-2032 ($MILLION)
    TABLE 44. REST OF EUROPE ZERO LIQUID DISCHARGE SYSTEM MARKET, BY PROCESS TYPE, 2022-2032 ($MILLION)
    TABLE 45. REST OF EUROPE ZERO LIQUID DISCHARGE SYSTEM MARKET, BY END USER, 2022-2032 ($MILLION)
    TABLE 46. ASIA-PACIFIC ZERO LIQUID DISCHARGE SYSTEM MARKET, BY SYSTEM TYPE, 2022-2032 ($MILLION)
    TABLE 47. ASIA-PACIFIC ZERO LIQUID DISCHARGE SYSTEM MARKET, BY PROCESS TYPE, 2022-2032 ($MILLION)
    TABLE 48. ASIA-PACIFIC ZERO LIQUID DISCHARGE SYSTEM MARKET, BY END USER, 2022-2032 ($MILLION)
    TABLE 49. ASIA-PACIFIC ZERO LIQUID DISCHARGE SYSTEM MARKET, BY COUNTRY, 2022-2032 ($MILLION)
    TABLE 50. CHINA ZERO LIQUID DISCHARGE SYSTEM MARKET, BY SYSTEM TYPE, 2022-2032 ($MILLION)
    TABLE 51. CHINA ZERO LIQUID DISCHARGE SYSTEM MARKET, BY PROCESS TYPE, 2022-2032 ($MILLION)
    TABLE 52. CHINA ZERO LIQUID DISCHARGE SYSTEM MARKET, BY END USER, 2022-2032 ($MILLION)
    TABLE 53. JAPAN ZERO LIQUID DISCHARGE SYSTEM MARKET, BY SYSTEM TYPE, 2022-2032 ($MILLION)
    TABLE 54. JAPAN ZERO LIQUID DISCHARGE SYSTEM MARKET, BY PROCESS TYPE, 2022-2032 ($MILLION)
    TABLE 55. JAPAN ZERO LIQUID DISCHARGE SYSTEM MARKET, BY END USER, 2022-2032 ($MILLION)
    TABLE 56. INDIA ZERO LIQUID DISCHARGE SYSTEM MARKET, BY SYSTEM TYPE, 2022-2032 ($MILLION)
    TABLE 57. INDIA ZERO LIQUID DISCHARGE SYSTEM MARKET, BY PROCESS TYPE, 2022-2032 ($MILLION)
    TABLE 58. INDIA ZERO LIQUID DISCHARGE SYSTEM MARKET, BY END USER, 2022-2032 ($MILLION)
    TABLE 59. SOUTH KOREA ZERO LIQUID DISCHARGE SYSTEM MARKET, BY SYSTEM TYPE, 2022-2032 ($MILLION)
    TABLE 60. SOUTH KOREA ZERO LIQUID DISCHARGE SYSTEM MARKET, BY PROCESS TYPE, 2022-2032 ($MILLION)
    TABLE 61. SOUTH KOREA ZERO LIQUID DISCHARGE SYSTEM MARKET, BY END USER, 2022-2032 ($MILLION)
    TABLE 62. REST OF ASIA-PACIFIC ZERO LIQUID DISCHARGE SYSTEM MARKET, BY SYSTEM TYPE, 2022-2032 ($MILLION)
    TABLE 63. REST OF ASIA-PACIFIC ZERO LIQUID DISCHARGE SYSTEM MARKET, BY PROCESS TYPE, 2022-2032 ($MILLION)
    TABLE 64. REST OF ASIA-PACIFIC ZERO LIQUID DISCHARGE SYSTEM MARKET, BY END USER, 2022-2032 ($MILLION)
    TABLE 65. LAMEA ZERO LIQUID DISCHARGE SYSTEM MARKET, BY SYSTEM TYPE, 2022-2032 ($MILLION)
    TABLE 66. LAMEA ZERO LIQUID DISCHARGE SYSTEM MARKET, BY PROCESS TYPE, 2022-2032 ($MILLION)
    TABLE 67. LAMEA ZERO LIQUID DISCHARGE SYSTEM MARKET, BY END USER, 2022-2032 ($MILLION)
    TABLE 68. LAMEA ZERO LIQUID DISCHARGE SYSTEM MARKET, BY COUNTRY, 2022-2032 ($MILLION)
    TABLE 69. LATIN AMERICA ZERO LIQUID DISCHARGE SYSTEM MARKET, BY SYSTEM TYPE, 2022-2032 ($MILLION)
    TABLE 70. LATIN AMERICA ZERO LIQUID DISCHARGE SYSTEM MARKET, BY PROCESS TYPE, 2022-2032 ($MILLION)
    TABLE 71. LATIN AMERICA ZERO LIQUID DISCHARGE SYSTEM MARKET, BY END USER, 2022-2032 ($MILLION)
    TABLE 72. MIDDLE EAST ZERO LIQUID DISCHARGE SYSTEM MARKET, BY SYSTEM TYPE, 2022-2032 ($MILLION)
    TABLE 73. MIDDLE EAST ZERO LIQUID DISCHARGE SYSTEM MARKET, BY PROCESS TYPE, 2022-2032 ($MILLION)
    TABLE 74. MIDDLE EAST ZERO LIQUID DISCHARGE SYSTEM MARKET, BY END USER, 2022-2032 ($MILLION)
    TABLE 75. AFRICA ZERO LIQUID DISCHARGE SYSTEM MARKET, BY SYSTEM TYPE, 2022-2032 ($MILLION)
    TABLE 76. AFRICA ZERO LIQUID DISCHARGE SYSTEM MARKET, BY PROCESS TYPE, 2022-2032 ($MILLION)
    TABLE 77. AFRICA ZERO LIQUID DISCHARGE SYSTEM MARKET, BY END USER, 2022-2032 ($MILLION)
    TABLE 78. AQUARION AG: KEY EXECUTIVES
    TABLE 79. AQUARION AG: COMPANY SNAPSHOT
    TABLE 80. AQUARION AG: PRODUCT SEGMENTS
    TABLE 81. AQUARION AG: PRODUCT PORTFOLIO
    TABLE 82. AQUATECH INTERNATIONAL LLC.: KEY EXECUTIVES
    TABLE 83. AQUATECH INTERNATIONAL LLC.: COMPANY SNAPSHOT
    TABLE 84. AQUATECH INTERNATIONAL LLC.: SERVICE SEGMENTS
    TABLE 85. AQUATECH INTERNATIONAL LLC.: PRODUCT PORTFOLIO
    TABLE 86. CONDORCHEM ENVITECH: KEY EXECUTIVES
    TABLE 87. CONDORCHEM ENVITECH: COMPANY SNAPSHOT
    TABLE 88. CONDORCHEM ENVITECH: PRODUCT SEGMENTS
    TABLE 89. CONDORCHEM ENVITECH: PRODUCT PORTFOLIO
    TABLE 90. SAFBON WATER TECHNOLOGY: KEY EXECUTIVES
    TABLE 91. SAFBON WATER TECHNOLOGY: COMPANY SNAPSHOT
    TABLE 92. SAFBON WATER TECHNOLOGY: PRODUCT SEGMENTS
    TABLE 93. SAFBON WATER TECHNOLOGY: PRODUCT PORTFOLIO
    TABLE 94. GEA GROUP AKTIENGESELLSCHAFT: KEY EXECUTIVES
    TABLE 95. GEA GROUP AKTIENGESELLSCHAFT: COMPANY SNAPSHOT
    TABLE 96. GEA GROUP AKTIENGESELLSCHAFT: PRODUCT SEGMENTS
    TABLE 97. GEA GROUP AKTIENGESELLSCHAFT: PRODUCT PORTFOLIO
    TABLE 98. H2O GMBH: KEY EXECUTIVES
    TABLE 99. H2O GMBH: COMPANY SNAPSHOT
    TABLE 100. H2O GMBH: PRODUCT SEGMENTS
    TABLE 101. H2O GMBH: PRODUCT PORTFOLIO
    TABLE 102. OASYS WATER, INC.: KEY EXECUTIVES
    TABLE 103. OASYS WATER, INC.: COMPANY SNAPSHOT
    TABLE 104. OASYS WATER, INC.: PRODUCT SEGMENTS
    TABLE 105. OASYS WATER, INC.: PRODUCT PORTFOLIO
    TABLE 106. PRAJ INDUSTRIES LTD.: KEY EXECUTIVES
    TABLE 107. PRAJ INDUSTRIES LTD.: COMPANY SNAPSHOT
    TABLE 108. PRAJ INDUSTRIES LTD.: PRODUCT SEGMENTS
    TABLE 109. PRAJ INDUSTRIES LTD.: PRODUCT PORTFOLIO
    TABLE 110. VEOLIA: KEY EXECUTIVES
    TABLE 111. VEOLIA: COMPANY SNAPSHOT
    TABLE 112. VEOLIA: PRODUCT SEGMENTS
    TABLE 113. VEOLIA: PRODUCT PORTFOLIO
    TABLE 114. LENNTECH B.V.: KEY EXECUTIVES
    TABLE 115. LENNTECH B.V.: COMPANY SNAPSHOT
    TABLE 116. LENNTECH B.V.: PRODUCT SEGMENTS
    TABLE 117. LENNTECH B.V.: PRODUCT PORTFOLIO
  • LIST OF FIGURES

  • FIGURE 01. ZERO LIQUID DISCHARGE SYSTEM MARKET, 2022-2032
    FIGURE 02. SEGMENTATION OF ZERO LIQUID DISCHARGE SYSTEM MARKET, 2022-2032
    FIGURE 03. TOP INVESTMENT POCKETS IN ZERO LIQUID DISCHARGE SYSTEM MARKET (2023-2032)
    FIGURE 04. LOW BARGAINING POWER OF SUPPLIERS
    FIGURE 05. LOW BARGAINING POWER OF BUYERS
    FIGURE 06. LOW THREAT OF SUBSTITUTES
    FIGURE 07. LOW THREAT OF NEW ENTRANTS
    FIGURE 08. LOW INTENSITY OF RIVALRY
    FIGURE 09. DRIVERS, RESTRAINTS AND OPPORTUNITIES: GLOBALZERO LIQUID DISCHARGE SYSTEM MARKET
    FIGURE 10. ZERO LIQUID DISCHARGE SYSTEM MARKET, BY SYSTEM TYPE, 2022(%)
    FIGURE 11. COMPARATIVE SHARE ANALYSIS OF ZERO LIQUID DISCHARGE SYSTEM MARKET FOR CONVENTIONAL ZLD SYSTEMS, BY COUNTRY 2022 AND 2032(%)
    FIGURE 12. COMPARATIVE SHARE ANALYSIS OF ZERO LIQUID DISCHARGE SYSTEM MARKET FOR HYBRID ZLD SYSTEMS, BY COUNTRY 2022 AND 2032(%)
    FIGURE 13. ZERO LIQUID DISCHARGE SYSTEM MARKET, BY PROCESS TYPE, 2022(%)
    FIGURE 14. COMPARATIVE SHARE ANALYSIS OF ZERO LIQUID DISCHARGE SYSTEM MARKET FOR PRETREATMENT, BY COUNTRY 2022 AND 2032(%)
    FIGURE 15. COMPARATIVE SHARE ANALYSIS OF ZERO LIQUID DISCHARGE SYSTEM MARKET FOR EVAPORATION AND CRYSTALLIZATION, BY COUNTRY 2022 AND 2032(%)
    FIGURE 16. ZERO LIQUID DISCHARGE SYSTEM MARKET, BY END USER, 2022(%)
    FIGURE 17. COMPARATIVE SHARE ANALYSIS OF ZERO LIQUID DISCHARGE SYSTEM MARKET FOR CHEMICALS AND PETROCHEMICALS, BY COUNTRY 2022 AND 2032(%)
    FIGURE 18. COMPARATIVE SHARE ANALYSIS OF ZERO LIQUID DISCHARGE SYSTEM MARKET FOR FOOD AND BEVERAGES, BY COUNTRY 2022 AND 2032(%)
    FIGURE 19. COMPARATIVE SHARE ANALYSIS OF ZERO LIQUID DISCHARGE SYSTEM MARKET FOR TEXTILES, BY COUNTRY 2022 AND 2032(%)
    FIGURE 20. COMPARATIVE SHARE ANALYSIS OF ZERO LIQUID DISCHARGE SYSTEM MARKET FOR PHARMACEUTICALS, BY COUNTRY 2022 AND 2032(%)
    FIGURE 21. COMPARATIVE SHARE ANALYSIS OF ZERO LIQUID DISCHARGE SYSTEM MARKET FOR OTHERS, BY COUNTRY 2022 AND 2032(%)
    FIGURE 22. ZERO LIQUID DISCHARGE SYSTEM MARKET BY REGION, 2022
    FIGURE 23. U.S. ZERO LIQUID DISCHARGE SYSTEM MARKET, 2022-2032 ($MILLION)
    FIGURE 24. CANADA ZERO LIQUID DISCHARGE SYSTEM MARKET, 2022-2032 ($MILLION)
    FIGURE 25. MEXICO ZERO LIQUID DISCHARGE SYSTEM MARKET, 2022-2032 ($MILLION)
    FIGURE 26. GERMANY ZERO LIQUID DISCHARGE SYSTEM MARKET, 2022-2032 ($MILLION)
    FIGURE 27. UK ZERO LIQUID DISCHARGE SYSTEM MARKET, 2022-2032 ($MILLION)
    FIGURE 28. FRANCE ZERO LIQUID DISCHARGE SYSTEM MARKET, 2022-2032 ($MILLION)
    FIGURE 29. ITALY ZERO LIQUID DISCHARGE SYSTEM MARKET, 2022-2032 ($MILLION)
    FIGURE 30. REST OF EUROPE ZERO LIQUID DISCHARGE SYSTEM MARKET, 2022-2032 ($MILLION)
    FIGURE 31. CHINA ZERO LIQUID DISCHARGE SYSTEM MARKET, 2022-2032 ($MILLION)
    FIGURE 32. JAPAN ZERO LIQUID DISCHARGE SYSTEM MARKET, 2022-2032 ($MILLION)
    FIGURE 33. INDIA ZERO LIQUID DISCHARGE SYSTEM MARKET, 2022-2032 ($MILLION)
    FIGURE 34. SOUTH KOREA ZERO LIQUID DISCHARGE SYSTEM MARKET, 2022-2032 ($MILLION)
    FIGURE 35. REST OF ASIA-PACIFIC ZERO LIQUID DISCHARGE SYSTEM MARKET, 2022-2032 ($MILLION)
    FIGURE 36. LATIN AMERICA ZERO LIQUID DISCHARGE SYSTEM MARKET, 2022-2032 ($MILLION)
    FIGURE 37. MIDDLE EAST ZERO LIQUID DISCHARGE SYSTEM MARKET, 2022-2032 ($MILLION)
    FIGURE 38. AFRICA ZERO LIQUID DISCHARGE SYSTEM MARKET, 2022-2032 ($MILLION)
    FIGURE 39. TOP WINNING STRATEGIES, BY YEAR
    FIGURE 40. TOP WINNING STRATEGIES, BY DEVELOPMENT
    FIGURE 41. TOP WINNING STRATEGIES, BY COMPANY
    FIGURE 42. PRODUCT MAPPING OF TOP 10 PLAYERS
    FIGURE 43. COMPETITIVE DASHBOARD
    FIGURE 44. COMPETITIVE HEATMAP: ZERO LIQUID DISCHARGE SYSTEM MARKET
    FIGURE 45. TOP PLAYER POSITIONING, 2022
    FIGURE 46. GEA GROUP AKTIENGESELLSCHAFT: NET REVENUE, 2020-2022 ($MILLION)
    FIGURE 47. GEA GROUP AKTIENGESELLSCHAFT: REVENUE SHARE BY SEGMENT, 2022 (%)
    FIGURE 48. GEA GROUP AKTIENGESELLSCHAFT: REVENUE SHARE BY REGION, 2022 (%)
    FIGURE 49. PRAJ INDUSTRIES LTD.: NET REVENUE, 2020-2022 ($MILLION)
    FIGURE 50. PRAJ INDUSTRIES LTD.: RESEARCH & DEVELOPMENT EXPENDITURE, 2020-2022 ($MILLION)
    FIGURE 51. PRAJ INDUSTRIES LTD.: REVENUE SHARE BY REGION, 2022 (%)
    FIGURE 52. VEOLIA: NET REVENUE, 2020-2022 ($MILLION)
    FIGURE 53. VEOLIA: REVENUE SHARE BY REGION, 2022 (%)
    FIGURE 54. VEOLIA: REVENUE SHARE BY SEGMENT, 2022 (%)


PURCHASE OPTIONS

Call or Email us

U.S.-Canada Toll-free: +1-800-792-5285
Int'l : +1-503-894-6022
Europe : +44-845-528-1300
Email : help@alliedmarketresearch.com
 
FREQUENTLY ASKED QUESTIONS?

A. Growth of the manufacturing industry and increasing government rules and regulations for the safe disposal of industrial wastewater are some of the major trends influencing the zero liquid discharge system market.

A. Zero liquid discharge systems are extensively used for processing wastewater in the textile, chemical, and pulp and paper industry.

A. Europe is the largest regional market for Zero Liquid Discharge System,

A. $6068.5 Million is the estimated industry size of Zero Liquid Discharge System.

A. Aquarion AG, Aquatech International LLC, Condorchem Envitec., Lenntech B.V., Gea Group, Praj Industries Ltd., Veolia Water Technologies, and SafBon Water Technology. are some of the top companies to hold the market share in Zero Liquid Discharge System.

A. The Zero Liquid Discharge System market is projected to reach $11,187.3 million by 2032.

A. The company profile has been selected on factors such as geographical presence, market dominance (in terms of revenue and volume sales), various strategies and recent developments.

A. Latest version of global Zero Liquid Discharge System market report can be obtained on demand from the website.

Looking for Customization?

 Customization Request

Have a Question?

 Speak with Analyst

Any Confusion?

 Inquire Before Buying

Have a glance of the Report

  Request Sample
RELATED TAGS

Purchase Full Report of
Zero Liquid Discharge System Market

Start reading instantly.
This Report and over 67,132+ more Reports, Available with Avenue Library. T&C*.

  • Online Only
  • $3,570
  • Online cloud access only
  • Restricted print, copy, paste & download
  • Read only
  • Free industry update
    (Within 180 days)
  • Free report update in next update cycle
    (May 2024 - May 2025)
  • Data Pack
  • $3,840
  • Restricted to one authorized user
  • One print only
  • Available in
    Excel
  • Free industry update
    (Within 180 days)
  •   Free report update in next update cycle
    (May 2024 - May 2025)
  • Single User
  • $5,730
  • Restricted to one authorized user
  • One print only
  • Available in
    PDF
  • Free industry update
    (Within 180 days)
  •   Free report update in next update cycle
    (May 2024 - May 2025)
  • Five Users
  • $6,450
  • Limited to five authorized users
  • Print upto five copies
  • Available in
    PDF
  • Free industry update
    (Within 180 days)
  •   Free report update in next update cycle
    (May 2024 - May 2025)
  • Enterprise
    License/PDF

  • $9,600
  • Unlimited
    within
    company/enterprise
  • Available in Excel & PDF
  • Free industry update
    (Within 180 days)
  •   Free report update in next update cycle
    (May 2024 - May 2025)
  • Library
    Membership

  • $999 $ 1,175
    Per User/ Per month/ Billed annually
  • Published Content
    E-access
  • Company Profiles
    E-access
  • Newly Added Content Access
  • 10 PDF
    Downloads
  • 5 Excel Data
    Pack Downloads
  • 250 Company Profiles PDF Downloads
  • Buy Now

*Taxes/Fees, if applicable will be added during checkout. All prices in USD

RELATED REPORTS
 

Why Allied Market Research?


Infallible Methodology

To ensure high-level data integrity, accurate analysis, and impeccable forecasts

Analyst Support

For complete satisfaction

Customization

On-demand customization of scope of the report to exactly meet your needs

TARGETED MARKET VIEW

Targeted market view to provide pertinent information and save time of readers

Get fresh content delivered

Get insights on topics that are crucial for your business. Stay abreast of your interest areas.

Get Industry Data Alerts

Why Allied Market Research?

Infallible Methodology

To ensure high-level data integrity, accurate analysis, and impeccable forecasts

Analyst Support

For complete satisfaction

Customization

On-demand customization of scope of the report to exactly meet your needs

TARGETED MARKET VIEW

Targeted market view to provide pertinent information and save time of readers