0
New
New
2023
Ai In Genomics Market

AI in Genomics Market

by Offering (Hardware, Software, Services), by Technology (Machine Learning, Computer Vision), by Application (Drug Discovery and Development, Precision Medicine, Diagnostics, Others), by End User (Pharmaceutical and Biotech Companies, Healthcare Providers, Research Centers): Global Opportunity Analysis and Industry Forecast, 2021-2031

Report Code: A11556
Mar 2023 | Pages: 420
Tables: 160
Charts: 73
  • Formats*:

  • pdf

    Single User License, Five User
    License & Enterprise User License

  • xls

    Data Pack Excel License

  • ppt

    It comes with the additional cost
    of $2500.00 contact sales.


AI In Genomics Market Research, 2031

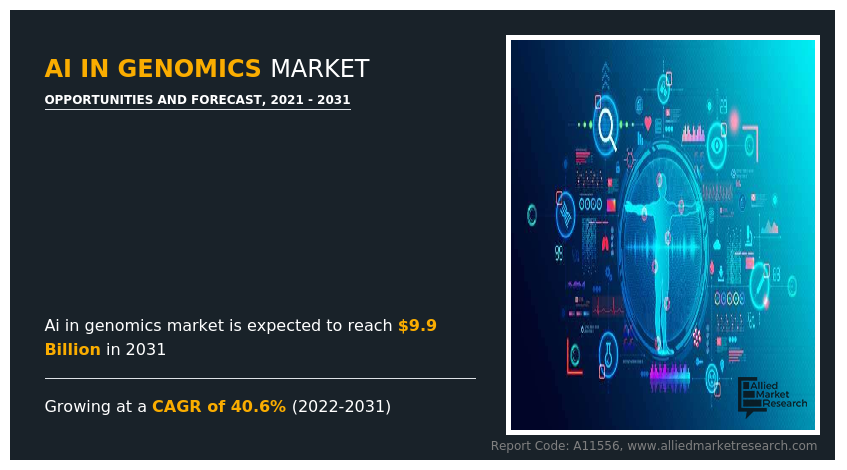
The AI in genomics market size was valued at $346.3 million in 2021 and is projected to reach $9,859.7 million by 2031, registering a CAGR of 40.6% from 2022 to 2031.  Genomics is a field of biology that studies the structure, function, and evolution of genomes, which are the complete sets of genetic information present in the DNA of an organism. Artificial intelligence (AI) has been making significant contributions to the field of genomics in recent years. Genomics is the study of an organism's genetic material, including the DNA sequences and their variations. AI techniques such as machine learning and deep learning are being applied to genomic data to make predictions about an individual's health, identify potential disease-causing mutations, and develop personalized treatments.
The outbreak of COVID-19 has disrupted workflows in the healthcare sector around the world. The disease has forced several industries to shut down temporarily, including several sub-domains of the healthcare sector. The pandemic reduced accessibility to research centers and offices which delayed the development in AI programs. However AI-driven diagnostics emerged as great solution for quick diagnosis of the disease.

AI in Genomics Market

Market dynamics 

Advancements in AI technology have the potential to act as a major driver for Artificial Intelligence in Genomics Market. AI is a powerful tool that can analyze vast amounts of genomic data quickly and accurately, helping to unlock the secrets of the human genome and revolutionize the field of genomics. With the ability to process large amounts of data, AI algorithms can help identify patterns, trends, and anomalies that may not be easily recognizable by human researchers. This can lead to new discoveries and insights into the underlying biology of diseases, as well as the development of more targeted and personalized treatments. According to the 2019 report of Biomed central, Advances in AI software and hardware, especially deep learning algorithms and the graphics processing units (GPUs) that power their training, have led to a recent and rapidly increasing interest in medical AI applications 

Artificial intelligence (AI) has made significant strides in the field of drug discovery and disease diagnosis. In drug discovery, AI has the potential to significantly reduce the time and cost required to develop new drugs. This is accomplished through the use of machine learning algorithms to predict the properties of molecules and identify those with potential therapeutic benefits. AI-based drug discovery platforms can also aid in the optimization of existing drugs and identify new targets for drug development. Furthermore, in the field of disease diagnosis, AI has shown great promise in improving the accuracy and efficiency of diagnosis. Machine learning algorithms can analyze large amounts of medical data to identify patterns and predict disease outcomes. This can lead to earlier diagnosis and more personalized treatment plans for patients. AI-powered diagnostic tools can also aid in the detection of rare diseases and improve the accuracy of medical imaging. 

Artificial intelligence (AI) is revolutionizing the field of personalized medicine by enabling physicians to provide individualized treatment plans to patients based on their unique genomic, clinical, and environmental data. One application of AI in personalized medicine is in disease diagnosis. By analyzing patient data, AI algorithms can identify patterns and provide physicians with accurate diagnoses. This helps doctors develop personalized treatment plans that target the specific needs of each patient. Furthermore, AI algorithms can identify potential drug targets and predict how different drugs will interact with a patient's genetic makeup. This can lead to the development of more effective and personalized treatments 

However, limited availability of skilled professionals and data quality issues are key factors anticipated to hamper the market growth. 

The outbreak of COVID-19 has disrupted workflows in the healthcare sector around the world. The disease has forced several industries to shut down temporarily, including several sub-domains of the healthcare sector. The pandemic reduced accessibility to the research centers and offices which delayed the development in AI programs. However AI-driven diagnostics emerged as great solution for quick diagnosis of the disease.  

Segmental Overview 

The AI in genomics market size is segmented into offering, technology, application, end user and region. Based on offering, the market is segmented into software, services and hardware. By technology, the market is segmented into machine learning and computer vision. By application, the market is segmented into drug discovery & development, precision medicine, diagnostics, and others. By end user, the market is segmented into pharmaceutical and biotech companies, healthcare providers, and research centers. Region wise, the market is analyzed across North America (the U.S., Canada, and Mexico), Europe (Germany, France, the UK, Italy, Spain, and rest of Europe), Asia-Pacific (Japan, China, Australia, India, South Korea, and rest of Asia-Pacific), and LAMEA (Brazil, South Africa, Saudi Arabia, and rest of LAMEA). 

By Offering:   

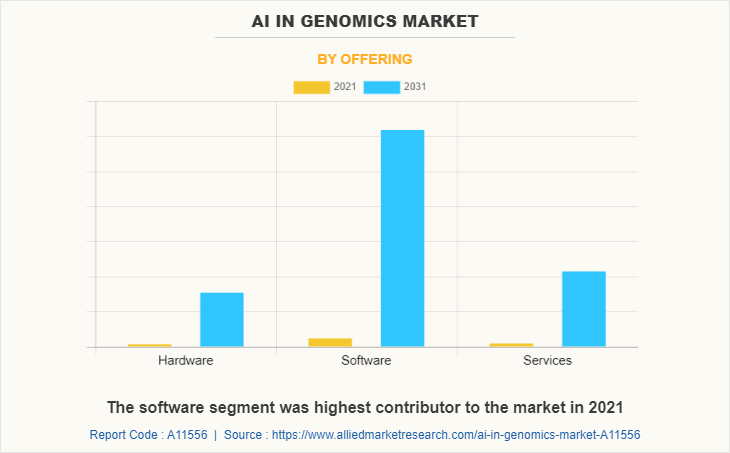
On the basis of offering, the market is segmented into software, services and hardware. the software segment was highest contributor to the AI in Genomics Market Sizein 2021. However, the hardware segment is anticipated to grow at the highest CAGR during the forecasted. AI hardware has been increasingly used in genomic analysis owing to the reason that AI enables the processing of vast amounts of data generated by genomic sequencing technologies.
AI in Genomics Market

By Technology:   

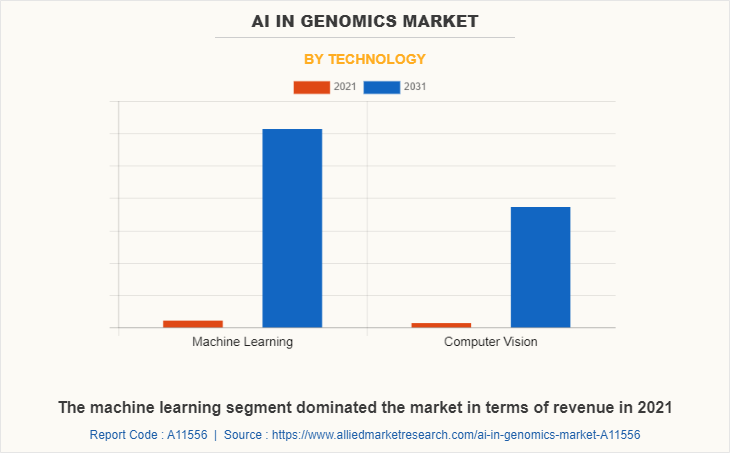
On the basis of technology, the market is segmented into machine learning and computer vision. the machine learning segment dominated the market in terms of revenue in 2021 and is expected to grow with a faster CAGR during the forecast period. This is attributed to the preference of large number of applications in genomic data analysis, drug discovery, and precision medicine. 
AI in Genomics Market

By Applications: 

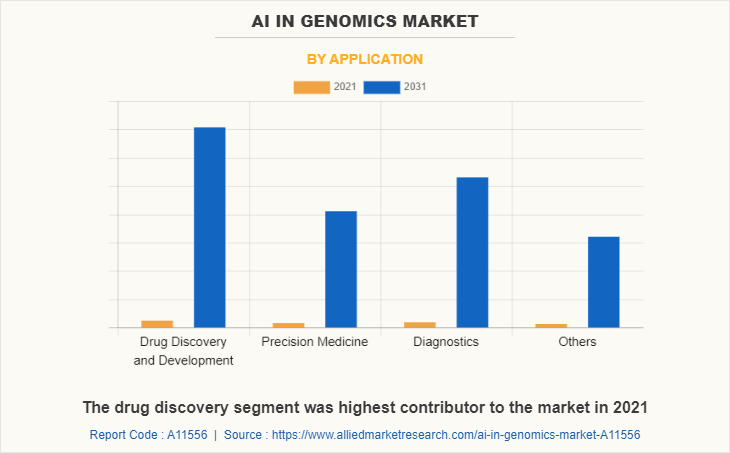
On the basis of application, the market is segmented into drug discovery & development, precision medicine, diagnostics, and others. The drug discovery segment was highest contributor to the market in 2021 owing to streamline the drug discovery process by reducing the time and cost required to develop new drugs, while also improving the success rate. However, the diagnostics segment is anticipated to grow at the highest CAGR during the forecasted period owing to the reason that application of AI in genomics has greatly enhanced the accuracy and speed of diagnostic tests.
AI in Genomics Market

By End User:  

On the basis of end user, the market is segmented into pharmaceutical and biotech companies, healthcare providers, and research centers. The pharmaceutical and biotech companies' segment was highest contributor to the market in 2021. However, the healthcare providers segment is anticipated to grow at the highest CAGR during the forecasted period owing to the significant increase in use of AI for disease diagnosis in hospitals by healthcare providers.

AI in Genomics Market
By End User

Your browser does not support the canvas element.

Healthcare providers segment is anticipated to grow at the highest CAGR during the forecast period

Get more information on this report : Request Sample Pages

By Region:  

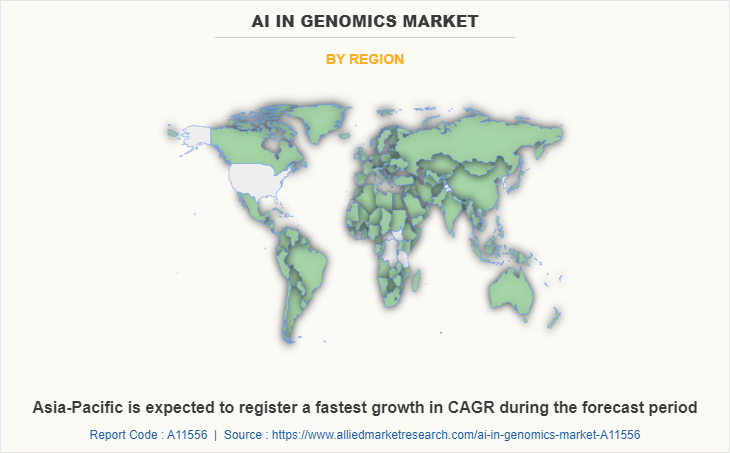
By region, the AI in genomics market share is analyzed across North America, Europe, Asia-Pacific, and LAMEA.  North America was the highest revenue contributor to the market in 2021. This is attributed to a large number of universities and research institutions that are at the forefront of AI research, including Stanford, MIT, Carnegie Mellon University, and the University of California, Berkeley. These institutions attract top talent from around the world and conduct cutting-edge research. Furthermore, The U.S. government and private industry have invested heavily in AI research and development.  

However, Asia-Pacific is expected to register a fastest growth in CAGR during the AI in Genomics Market forecast period, owing to an increase in investments for development of AI and an increase in the number of key players developing AI drives the growth of the market during the forecast period. Furthermore, Asian countries, India, China, the Philippines, and Thailand possess a large patient pool that suffers from cancer. For instance, according to WHO cancer is one of the leading causes of death worldwide with nearly 10 million deaths reported in 2020. The WHO South-East Asia Region reported an estimated 2.2 million new cases and 1.4 million cancer related deaths the same year - which accounted for more than 1 in 10 deaths in the region. This provides opportunities for entry of manufacturers that provide personalized medicines made using AI and drive the AI in genomics market growth. 
AI in Genomics Market

Competition Analysis 

Competitive analysis and profiles of the major key players that operate in the AI in genomics market share are Microsoft, IBM, NVIDIA Corporation, Deep Genomics, DATA4CURE, INC, Freenome holdings, Inc, Thermo fisher scientific, Illumina, Inc., Sophia Genetics, and BenevolentAI. are provided in the report. Major players have adopted acquisition, and product launch as key developmental strategies to improve the product portfolio of the invisible orthodontics market. 

Some Examples of Collaboration in The Artificial Intelligence in Genomics Market

  • In November 2020, BioMarin Pharmaceutical Inc. and Deep Genomics announced that the companies have entered into a preclinical collaboration that will use Deep Genomics' artificial intelligence drug discovery platform (The AI Workbench) to identify oligonucleotide drug candidates in four rare disease indications with high unmet need. 
  • In September 2021, Deep Genomics announced the start of a collaboration with Mila, the Quebec Artificial Intelligence Institute. This collaboration will allow the company to join Mila's community and to take advantage of the recruitment activities offered by the research institute. 

Some Examples of Partnership In The Artificial Intelligence in Genomics Market

  • In October 2020, NVIDIA announced a partnership with GSK and its AI group, which is applying computation to the drug and vaccine discovery process. 
  • In March 2022, IBM and Genomics England announced a strategic partnership. Genomics England provides researchers access to genomic datasets to enable scientific discovery. The partnership allows IBM to support the rapid expansion of Genomic England by enabling the consumption of cloud services through its AI capabilities 
  • Some Examples of Acquisition In The Artificial Intelligence in Genomics Market
  •  In June 2020, Illumina Inc announced the acquisition of BlueBee, a cloud-based software company that provides genomics analysis solutions for research and clinical customers 

Key Benefits For Stakeholders

  • This report provides a quantitative analysis of the market segments, current trends, estimations, and dynamics of the ai in genomics market analysis from 2021 to 2031 to identify the prevailing ai in genomics market opportunity.
  • The market research is offered along with information related to key drivers, restraints, and opportunities.
  • Porter's five forces analysis highlights the potency of buyers and suppliers to enable stakeholders make profit-oriented business decisions and strengthen their supplier-buyer network.
  • In-depth analysis of the ai in genomics industry segmentation assists to determine the prevailing market opportunities.
  • Major countries in each region are mapped according to their revenue contribution to the global market.
  • Market player positioning facilitates benchmarking and provides a clear understanding of the present position of the market players.
  • The report includes the analysis of the regional as well as global ai in genomics market trends, key players, market segments, application areas, and market growth strategies.

AI in Genomics Market Report Highlights

Aspects Details
Market Size By 2031 USD 9.9 billion
Growth Rate CAGR of 40.6%
Forecast period 2021 - 2031
Report Pages 420
By Technology
  • Machine Learning
  • Computer Vision
By Offering
  • Hardware
  • Software
  • Services
By Application
  • Drug Discovery and Development
  • Precision Medicine
  • Diagnostics
  • Others
By End User
  • Pharmaceutical and Biotech Companies
  • Healthcare Providers
  • Research Centers
By Region
  • North America  (U.S., Canada, Mexico)
  • Europe  (Germany, France, UK, Italy, Spain, Rest of Europe)
  • Asia-Pacific  (Japan, China, Australia, India, South Korea, Rest of Asia-Pacific)
  • LAMEA  (Brazil, Saudi Arabia, South Africa, Rest of LAMEA)
Key Market Players IBM Corporation, Thermo Fisher Scientific Inc., Illumina, Inc., NVIDIA Corporation (Mellanox Technologies), Data4Cure, Inc, Sophia Genetics, BenevolentAI, Microsoft Corporation, Deep Genomics, Freenome Holdings, Inc

Analyst Review

The analyst’s review section provides various opinions of top-level CXOs in the global AI in the genomics market. According to the insights of CXOs, an increase in demand for AI and a rise in investments for research and development to explore more applications of AI in genomics are expected to offer profitable opportunities for the expansion of the AI in Genomics Market Size. In addition, favorable government initiatives and higher spending for AI development, have piqued the interest of several companies to develop AI software and services for genomic applications. 

CXOs further added that AI is increasingly being used in drug design, drug discovery, and drug development to speed up the process of identifying potential drug candidates and bring new therapies to market more quickly, thereby driving the growth of the market. By analyzing large datasets of biological and chemical information, AI can be used to identify new drug targets. Researchers can identify potential drug targets by predicting which proteins or other molecules are expected to be involved in a specific disease. AI algorithms can be used to sift through large databases of chemical compounds and predict which ones will be most effective as drugs. Reducing the number of compounds that must be tested in the lab, can speed up the drug discovery process. Furthermore, AI has the potential to revolutionize disease diagnosis by enabling faster and more accurate disease identification, improving patient outcomes, and lowering healthcare costs. However, it is critical that AI is developed and deployed responsibly, with appropriate consideration given to issues such as data privacy and algorithm bias. It is also important to note that AI should be viewed as an aid to clinical decision-making rather than a replacement for human clinicians. These are two of the major drivers of AI in the genomics market 

Furthermore, North America is expected to witness the highest growth, in terms of revenue, owing to the increase in the adoption of AI for drug development by pharmaceutical and biotechnological companies and the rise in the healthcare and IT industry driving the growth of AI in genomics. The upsurge in healthcare expenditure in emerging economies is anticipated to offer lucrative opportunities for market expansion. However, Asia-Pacific is anticipated to witness notable growth, owing to an increase in investments for the development of AI and an increase in the number of key players developing AI, driving the growth of the market during the forecast period. 

 
  • CHAPTER 1: INTRODUCTION

    • 1.1. Report description

    • 1.2. Key market segments

    • 1.3. Key benefits to the stakeholders

    • 1.4. Research Methodology

      • 1.4.1. Primary research

      • 1.4.2. Secondary research

      • 1.4.3. Analyst tools and models

  • CHAPTER 2: EXECUTIVE SUMMARY

    • 2.1. CXO Perspective

  • CHAPTER 3: MARKET OVERVIEW

    • 3.1. Market definition and scope

    • 3.2. Key findings

      • 3.2.1. Top impacting factors

      • 3.2.2. Top investment pockets

    • 3.3. Porter’s five forces analysis

      • 3.3.1. Bargaining power of suppliers

      • 3.3.2. Bargaining power of buyers

      • 3.3.3. Threat of substitutes

      • 3.3.4. Threat of new entrants

      • 3.3.5. Intensity of rivalry

    • 3.4. Market dynamics

      • 3.4.1. Drivers

        • 3.4.1.1. Advancements in AI technologies
        • 3.4.1.2. Rising adoption of genomics in research and healthcare
        • 3.4.1.3. Increase ing demand for personalized medicine

      • 3.4.2. Restraints

        • 3.4.2.1. Limited availability of skilled professionals
        • 3.4.2.2. Data quality issues

      • 3.4.3. Opportunities

        • 3.4.3.1. Development of human aware AI

    • 3.5. COVID-19 Impact Analysis on the market

  • CHAPTER 4: AI IN GENOMICS MARKET, BY OFFERING

    • 4.1. Overview

      • 4.1.1. Market size and forecast

    • 4.2. Hardware

      • 4.2.1. Key market trends, growth factors and opportunities

      • 4.2.2. Market size and forecast, by region

      • 4.2.3. Market share analysis by country

    • 4.3. Software

      • 4.3.1. Key market trends, growth factors and opportunities

      • 4.3.2. Market size and forecast, by region

      • 4.3.3. Market share analysis by country

    • 4.4. Services

      • 4.4.1. Key market trends, growth factors and opportunities

      • 4.4.2. Market size and forecast, by region

      • 4.4.3. Market share analysis by country

  • CHAPTER 5: AI IN GENOMICS MARKET, BY TECHNOLOGY

    • 5.1. Overview

      • 5.1.1. Market size and forecast

    • 5.2. Machine Learning

      • 5.2.1. Key market trends, growth factors and opportunities

      • 5.2.2. Market size and forecast, by region

      • 5.2.3. Market share analysis by country

    • 5.3. Computer Vision

      • 5.3.1. Key market trends, growth factors and opportunities

      • 5.3.2. Market size and forecast, by region

      • 5.3.3. Market share analysis by country

  • CHAPTER 6: AI IN GENOMICS MARKET, BY APPLICATION

    • 6.1. Overview

      • 6.1.1. Market size and forecast

    • 6.2. Drug Discovery and Development

      • 6.2.1. Key market trends, growth factors and opportunities

      • 6.2.2. Market size and forecast, by region

      • 6.2.3. Market share analysis by country

    • 6.3. Precision Medicine

      • 6.3.1. Key market trends, growth factors and opportunities

      • 6.3.2. Market size and forecast, by region

      • 6.3.3. Market share analysis by country

    • 6.4. Diagnostics

      • 6.4.1. Key market trends, growth factors and opportunities

      • 6.4.2. Market size and forecast, by region

      • 6.4.3. Market share analysis by country

    • 6.5. Others

      • 6.5.1. Key market trends, growth factors and opportunities

      • 6.5.2. Market size and forecast, by region

      • 6.5.3. Market share analysis by country

  • CHAPTER 7: AI IN GENOMICS MARKET, BY END USER

    • 7.1. Overview

      • 7.1.1. Market size and forecast

    • 7.2. Pharmaceutical and Biotech Companies

      • 7.2.1. Key market trends, growth factors and opportunities

      • 7.2.2. Market size and forecast, by region

      • 7.2.3. Market share analysis by country

    • 7.3. Healthcare Providers

      • 7.3.1. Key market trends, growth factors and opportunities

      • 7.3.2. Market size and forecast, by region

      • 7.3.3. Market share analysis by country

    • 7.4. Research Centers

      • 7.4.1. Key market trends, growth factors and opportunities

      • 7.4.2. Market size and forecast, by region

      • 7.4.3. Market share analysis by country

  • CHAPTER 8: AI IN GENOMICS MARKET, BY REGION

    • 8.1. Overview

      • 8.1.1. Market size and forecast By Region

    • 8.2. North America

      • 8.2.1. Key trends and opportunities

      • 8.2.2. Market size and forecast, by Offering

      • 8.2.3. Market size and forecast, by Technology

      • 8.2.4. Market size and forecast, by Application

      • 8.2.5. Market size and forecast, by End User

      • 8.2.6. Market size and forecast, by country

        • 8.2.6.1. U.S.
          • 8.2.6.1.1. Key market trends, growth factors and opportunities
          • 8.2.6.1.2. Market size and forecast, by Offering
          • 8.2.6.1.3. Market size and forecast, by Technology
          • 8.2.6.1.4. Market size and forecast, by Application
          • 8.2.6.1.5. Market size and forecast, by End User
        • 8.2.6.2. Canada
          • 8.2.6.2.1. Key market trends, growth factors and opportunities
          • 8.2.6.2.2. Market size and forecast, by Offering
          • 8.2.6.2.3. Market size and forecast, by Technology
          • 8.2.6.2.4. Market size and forecast, by Application
          • 8.2.6.2.5. Market size and forecast, by End User
        • 8.2.6.3. Mexico
          • 8.2.6.3.1. Key market trends, growth factors and opportunities
          • 8.2.6.3.2. Market size and forecast, by Offering
          • 8.2.6.3.3. Market size and forecast, by Technology
          • 8.2.6.3.4. Market size and forecast, by Application
          • 8.2.6.3.5. Market size and forecast, by End User
    • 8.3. Europe

      • 8.3.1. Key trends and opportunities

      • 8.3.2. Market size and forecast, by Offering

      • 8.3.3. Market size and forecast, by Technology

      • 8.3.4. Market size and forecast, by Application

      • 8.3.5. Market size and forecast, by End User

      • 8.3.6. Market size and forecast, by country

        • 8.3.6.1. Germany
          • 8.3.6.1.1. Key market trends, growth factors and opportunities
          • 8.3.6.1.2. Market size and forecast, by Offering
          • 8.3.6.1.3. Market size and forecast, by Technology
          • 8.3.6.1.4. Market size and forecast, by Application
          • 8.3.6.1.5. Market size and forecast, by End User
        • 8.3.6.2. France
          • 8.3.6.2.1. Key market trends, growth factors and opportunities
          • 8.3.6.2.2. Market size and forecast, by Offering
          • 8.3.6.2.3. Market size and forecast, by Technology
          • 8.3.6.2.4. Market size and forecast, by Application
          • 8.3.6.2.5. Market size and forecast, by End User
        • 8.3.6.3. UK
          • 8.3.6.3.1. Key market trends, growth factors and opportunities
          • 8.3.6.3.2. Market size and forecast, by Offering
          • 8.3.6.3.3. Market size and forecast, by Technology
          • 8.3.6.3.4. Market size and forecast, by Application
          • 8.3.6.3.5. Market size and forecast, by End User
        • 8.3.6.4. Italy
          • 8.3.6.4.1. Key market trends, growth factors and opportunities
          • 8.3.6.4.2. Market size and forecast, by Offering
          • 8.3.6.4.3. Market size and forecast, by Technology
          • 8.3.6.4.4. Market size and forecast, by Application
          • 8.3.6.4.5. Market size and forecast, by End User
        • 8.3.6.5. Spain
          • 8.3.6.5.1. Key market trends, growth factors and opportunities
          • 8.3.6.5.2. Market size and forecast, by Offering
          • 8.3.6.5.3. Market size and forecast, by Technology
          • 8.3.6.5.4. Market size and forecast, by Application
          • 8.3.6.5.5. Market size and forecast, by End User
        • 8.3.6.6. Rest of Europe
          • 8.3.6.6.1. Key market trends, growth factors and opportunities
          • 8.3.6.6.2. Market size and forecast, by Offering
          • 8.3.6.6.3. Market size and forecast, by Technology
          • 8.3.6.6.4. Market size and forecast, by Application
          • 8.3.6.6.5. Market size and forecast, by End User
    • 8.4. Asia-Pacific

      • 8.4.1. Key trends and opportunities

      • 8.4.2. Market size and forecast, by Offering

      • 8.4.3. Market size and forecast, by Technology

      • 8.4.4. Market size and forecast, by Application

      • 8.4.5. Market size and forecast, by End User

      • 8.4.6. Market size and forecast, by country

        • 8.4.6.1. Japan
          • 8.4.6.1.1. Key market trends, growth factors and opportunities
          • 8.4.6.1.2. Market size and forecast, by Offering
          • 8.4.6.1.3. Market size and forecast, by Technology
          • 8.4.6.1.4. Market size and forecast, by Application
          • 8.4.6.1.5. Market size and forecast, by End User
        • 8.4.6.2. China
          • 8.4.6.2.1. Key market trends, growth factors and opportunities
          • 8.4.6.2.2. Market size and forecast, by Offering
          • 8.4.6.2.3. Market size and forecast, by Technology
          • 8.4.6.2.4. Market size and forecast, by Application
          • 8.4.6.2.5. Market size and forecast, by End User
        • 8.4.6.3. Australia
          • 8.4.6.3.1. Key market trends, growth factors and opportunities
          • 8.4.6.3.2. Market size and forecast, by Offering
          • 8.4.6.3.3. Market size and forecast, by Technology
          • 8.4.6.3.4. Market size and forecast, by Application
          • 8.4.6.3.5. Market size and forecast, by End User
        • 8.4.6.4. India
          • 8.4.6.4.1. Key market trends, growth factors and opportunities
          • 8.4.6.4.2. Market size and forecast, by Offering
          • 8.4.6.4.3. Market size and forecast, by Technology
          • 8.4.6.4.4. Market size and forecast, by Application
          • 8.4.6.4.5. Market size and forecast, by End User
        • 8.4.6.5. South Korea
          • 8.4.6.5.1. Key market trends, growth factors and opportunities
          • 8.4.6.5.2. Market size and forecast, by Offering
          • 8.4.6.5.3. Market size and forecast, by Technology
          • 8.4.6.5.4. Market size and forecast, by Application
          • 8.4.6.5.5. Market size and forecast, by End User
        • 8.4.6.6. Rest of Asia-Pacific
          • 8.4.6.6.1. Key market trends, growth factors and opportunities
          • 8.4.6.6.2. Market size and forecast, by Offering
          • 8.4.6.6.3. Market size and forecast, by Technology
          • 8.4.6.6.4. Market size and forecast, by Application
          • 8.4.6.6.5. Market size and forecast, by End User
    • 8.5. LAMEA

      • 8.5.1. Key trends and opportunities

      • 8.5.2. Market size and forecast, by Offering

      • 8.5.3. Market size and forecast, by Technology

      • 8.5.4. Market size and forecast, by Application

      • 8.5.5. Market size and forecast, by End User

      • 8.5.6. Market size and forecast, by country

        • 8.5.6.1. Brazil
          • 8.5.6.1.1. Key market trends, growth factors and opportunities
          • 8.5.6.1.2. Market size and forecast, by Offering
          • 8.5.6.1.3. Market size and forecast, by Technology
          • 8.5.6.1.4. Market size and forecast, by Application
          • 8.5.6.1.5. Market size and forecast, by End User
        • 8.5.6.2. Saudi Arabia
          • 8.5.6.2.1. Key market trends, growth factors and opportunities
          • 8.5.6.2.2. Market size and forecast, by Offering
          • 8.5.6.2.3. Market size and forecast, by Technology
          • 8.5.6.2.4. Market size and forecast, by Application
          • 8.5.6.2.5. Market size and forecast, by End User
        • 8.5.6.3. South Africa
          • 8.5.6.3.1. Key market trends, growth factors and opportunities
          • 8.5.6.3.2. Market size and forecast, by Offering
          • 8.5.6.3.3. Market size and forecast, by Technology
          • 8.5.6.3.4. Market size and forecast, by Application
          • 8.5.6.3.5. Market size and forecast, by End User
        • 8.5.6.4. Rest of LAMEA
          • 8.5.6.4.1. Key market trends, growth factors and opportunities
          • 8.5.6.4.2. Market size and forecast, by Offering
          • 8.5.6.4.3. Market size and forecast, by Technology
          • 8.5.6.4.4. Market size and forecast, by Application
          • 8.5.6.4.5. Market size and forecast, by End User
  • CHAPTER 9: COMPETITIVE LANDSCAPE

    • 9.1. Introduction

    • 9.2. Top winning strategies

    • 9.3. Product Mapping of Top 10 Player

    • 9.4. Competitive Dashboard

    • 9.5. Competitive Heatmap

    • 9.6. Top player positioning, 2021

  • CHAPTER 10: COMPANY PROFILES

    • 10.1. Microsoft Corporation

      • 10.1.1. Company overview

      • 10.1.2. Key Executives

      • 10.1.3. Company snapshot

      • 10.1.4. Operating business segments

      • 10.1.5. Product portfolio

      • 10.1.6. Business performance

      • 10.1.7. Key strategic moves and developments

    • 10.2. IBM Corporation

      • 10.2.1. Company overview

      • 10.2.2. Key Executives

      • 10.2.3. Company snapshot

      • 10.2.4. Operating business segments

      • 10.2.5. Product portfolio

      • 10.2.6. Business performance

      • 10.2.7. Key strategic moves and developments

    • 10.3. NVIDIA Corporation (Mellanox Technologies)

      • 10.3.1. Company overview

      • 10.3.2. Key Executives

      • 10.3.3. Company snapshot

      • 10.3.4. Operating business segments

      • 10.3.5. Product portfolio

      • 10.3.6. Business performance

      • 10.3.7. Key strategic moves and developments

    • 10.4. Deep Genomics

      • 10.4.1. Company overview

      • 10.4.2. Key Executives

      • 10.4.3. Company snapshot

      • 10.4.4. Operating business segments

      • 10.4.5. Product portfolio

      • 10.4.6. Key strategic moves and developments

    • 10.5. Data4Cure, Inc

      • 10.5.1. Company overview

      • 10.5.2. Key Executives

      • 10.5.3. Company snapshot

      • 10.5.4. Operating business segments

      • 10.5.5. Product portfolio

    • 10.6. Freenome Holdings, Inc

      • 10.6.1. Company overview

      • 10.6.2. Key Executives

      • 10.6.3. Company snapshot

      • 10.6.4. Operating business segments

      • 10.6.5. Product portfolio

    • 10.7. Thermo Fisher Scientific Inc.

      • 10.7.1. Company overview

      • 10.7.2. Key Executives

      • 10.7.3. Company snapshot

      • 10.7.4. Operating business segments

      • 10.7.5. Product portfolio

      • 10.7.6. Business performance

    • 10.8. Illumina, Inc.

      • 10.8.1. Company overview

      • 10.8.2. Key Executives

      • 10.8.3. Company snapshot

      • 10.8.4. Operating business segments

      • 10.8.5. Product portfolio

      • 10.8.6. Business performance

      • 10.8.7. Key strategic moves and developments

    • 10.9. Sophia Genetics

      • 10.9.1. Company overview

      • 10.9.2. Key Executives

      • 10.9.3. Company snapshot

      • 10.9.4. Operating business segments

      • 10.9.5. Product portfolio

      • 10.9.6. Business performance

    • 10.10. BenevolentAI

      • 10.10.1. Company overview

      • 10.10.2. Key Executives

      • 10.10.3. Company snapshot

      • 10.10.4. Operating business segments

      • 10.10.5. Product portfolio

      • 10.10.6. Key strategic moves and developments

  • LIST OF TABLES

  • TABLE 01. GLOBAL AI IN GENOMICS MARKET, BY OFFERING, 2021-2031 ($MILLION)
    TABLE 02. AI IN GENOMICS MARKET FOR HARDWARE, BY REGION, 2021-2031 ($MILLION)
    TABLE 03. AI IN GENOMICS MARKET FOR SOFTWARE, BY REGION, 2021-2031 ($MILLION)
    TABLE 04. AI IN GENOMICS MARKET FOR SERVICES, BY REGION, 2021-2031 ($MILLION)
    TABLE 05. GLOBAL AI IN GENOMICS MARKET, BY TECHNOLOGY, 2021-2031 ($MILLION)
    TABLE 06. AI IN GENOMICS MARKET FOR MACHINE LEARNING, BY REGION, 2021-2031 ($MILLION)
    TABLE 07. AI IN GENOMICS MARKET FOR COMPUTER VISION, BY REGION, 2021-2031 ($MILLION)
    TABLE 08. GLOBAL AI IN GENOMICS MARKET, BY APPLICATION, 2021-2031 ($MILLION)
    TABLE 09. AI IN GENOMICS MARKET FOR DRUG DISCOVERY AND DEVELOPMENT, BY REGION, 2021-2031 ($MILLION)
    TABLE 10. AI IN GENOMICS MARKET FOR PRECISION MEDICINE, BY REGION, 2021-2031 ($MILLION)
    TABLE 11. AI IN GENOMICS MARKET FOR DIAGNOSTICS, BY REGION, 2021-2031 ($MILLION)
    TABLE 12. AI IN GENOMICS MARKET FOR OTHERS, BY REGION, 2021-2031 ($MILLION)
    TABLE 13. GLOBAL AI IN GENOMICS MARKET, BY END USER, 2021-2031 ($MILLION)
    TABLE 14. AI IN GENOMICS MARKET FOR PHARMACEUTICAL AND BIOTECH COMPANIES, BY REGION, 2021-2031 ($MILLION)
    TABLE 15. AI IN GENOMICS MARKET FOR HEALTHCARE PROVIDERS, BY REGION, 2021-2031 ($MILLION)
    TABLE 16. AI IN GENOMICS MARKET FOR RESEARCH CENTERS, BY REGION, 2021-2031 ($MILLION)
    TABLE 17. AI IN GENOMICS MARKET, BY REGION, 2021-2031 ($MILLION)
    TABLE 18. NORTH AMERICA AI IN GENOMICS MARKET, BY OFFERING, 2021-2031 ($MILLION)
    TABLE 19. NORTH AMERICA AI IN GENOMICS MARKET, BY TECHNOLOGY, 2021-2031 ($MILLION)
    TABLE 20. NORTH AMERICA AI IN GENOMICS MARKET, BY APPLICATION, 2021-2031 ($MILLION)
    TABLE 21. NORTH AMERICA AI IN GENOMICS MARKET, BY END USER, 2021-2031 ($MILLION)
    TABLE 22. NORTH AMERICA AI IN GENOMICS MARKET, BY COUNTRY, 2021-2031 ($MILLION)
    TABLE 23. U.S. AI IN GENOMICS MARKET, BY OFFERING, 2021-2031 ($MILLION)
    TABLE 24. U.S. AI IN GENOMICS MARKET, BY TECHNOLOGY, 2021-2031 ($MILLION)
    TABLE 25. U.S. AI IN GENOMICS MARKET, BY APPLICATION, 2021-2031 ($MILLION)
    TABLE 26. U.S. AI IN GENOMICS MARKET, BY END USER, 2021-2031 ($MILLION)
    TABLE 27. CANADA AI IN GENOMICS MARKET, BY OFFERING, 2021-2031 ($MILLION)
    TABLE 28. CANADA AI IN GENOMICS MARKET, BY TECHNOLOGY, 2021-2031 ($MILLION)
    TABLE 29. CANADA AI IN GENOMICS MARKET, BY APPLICATION, 2021-2031 ($MILLION)
    TABLE 30. CANADA AI IN GENOMICS MARKET, BY END USER, 2021-2031 ($MILLION)
    TABLE 31. MEXICO AI IN GENOMICS MARKET, BY OFFERING, 2021-2031 ($MILLION)
    TABLE 32. MEXICO AI IN GENOMICS MARKET, BY TECHNOLOGY, 2021-2031 ($MILLION)
    TABLE 33. MEXICO AI IN GENOMICS MARKET, BY APPLICATION, 2021-2031 ($MILLION)
    TABLE 34. MEXICO AI IN GENOMICS MARKET, BY END USER, 2021-2031 ($MILLION)
    TABLE 35. EUROPE AI IN GENOMICS MARKET, BY OFFERING, 2021-2031 ($MILLION)
    TABLE 36. EUROPE AI IN GENOMICS MARKET, BY TECHNOLOGY, 2021-2031 ($MILLION)
    TABLE 37. EUROPE AI IN GENOMICS MARKET, BY APPLICATION, 2021-2031 ($MILLION)
    TABLE 38. EUROPE AI IN GENOMICS MARKET, BY END USER, 2021-2031 ($MILLION)
    TABLE 39. EUROPE AI IN GENOMICS MARKET, BY COUNTRY, 2021-2031 ($MILLION)
    TABLE 40. GERMANY AI IN GENOMICS MARKET, BY OFFERING, 2021-2031 ($MILLION)
    TABLE 41. GERMANY AI IN GENOMICS MARKET, BY TECHNOLOGY, 2021-2031 ($MILLION)
    TABLE 42. GERMANY AI IN GENOMICS MARKET, BY APPLICATION, 2021-2031 ($MILLION)
    TABLE 43. GERMANY AI IN GENOMICS MARKET, BY END USER, 2021-2031 ($MILLION)
    TABLE 44. FRANCE AI IN GENOMICS MARKET, BY OFFERING, 2021-2031 ($MILLION)
    TABLE 45. FRANCE AI IN GENOMICS MARKET, BY TECHNOLOGY, 2021-2031 ($MILLION)
    TABLE 46. FRANCE AI IN GENOMICS MARKET, BY APPLICATION, 2021-2031 ($MILLION)
    TABLE 47. FRANCE AI IN GENOMICS MARKET, BY END USER, 2021-2031 ($MILLION)
    TABLE 48. UK AI IN GENOMICS MARKET, BY OFFERING, 2021-2031 ($MILLION)
    TABLE 49. UK AI IN GENOMICS MARKET, BY TECHNOLOGY, 2021-2031 ($MILLION)
    TABLE 50. UK AI IN GENOMICS MARKET, BY APPLICATION, 2021-2031 ($MILLION)
    TABLE 51. UK AI IN GENOMICS MARKET, BY END USER, 2021-2031 ($MILLION)
    TABLE 52. ITALY AI IN GENOMICS MARKET, BY OFFERING, 2021-2031 ($MILLION)
    TABLE 53. ITALY AI IN GENOMICS MARKET, BY TECHNOLOGY, 2021-2031 ($MILLION)
    TABLE 54. ITALY AI IN GENOMICS MARKET, BY APPLICATION, 2021-2031 ($MILLION)
    TABLE 55. ITALY AI IN GENOMICS MARKET, BY END USER, 2021-2031 ($MILLION)
    TABLE 56. SPAIN AI IN GENOMICS MARKET, BY OFFERING, 2021-2031 ($MILLION)
    TABLE 57. SPAIN AI IN GENOMICS MARKET, BY TECHNOLOGY, 2021-2031 ($MILLION)
    TABLE 58. SPAIN AI IN GENOMICS MARKET, BY APPLICATION, 2021-2031 ($MILLION)
    TABLE 59. SPAIN AI IN GENOMICS MARKET, BY END USER, 2021-2031 ($MILLION)
    TABLE 60. REST OF EUROPE AI IN GENOMICS MARKET, BY OFFERING, 2021-2031 ($MILLION)
    TABLE 61. REST OF EUROPE AI IN GENOMICS MARKET, BY TECHNOLOGY, 2021-2031 ($MILLION)
    TABLE 62. REST OF EUROPE AI IN GENOMICS MARKET, BY APPLICATION, 2021-2031 ($MILLION)
    TABLE 63. REST OF EUROPE AI IN GENOMICS MARKET, BY END USER, 2021-2031 ($MILLION)
    TABLE 64. ASIA-PACIFIC AI IN GENOMICS MARKET, BY OFFERING, 2021-2031 ($MILLION)
    TABLE 65. ASIA-PACIFIC AI IN GENOMICS MARKET, BY TECHNOLOGY, 2021-2031 ($MILLION)
    TABLE 66. ASIA-PACIFIC AI IN GENOMICS MARKET, BY APPLICATION, 2021-2031 ($MILLION)
    TABLE 67. ASIA-PACIFIC AI IN GENOMICS MARKET, BY END USER, 2021-2031 ($MILLION)
    TABLE 68. ASIA-PACIFIC AI IN GENOMICS MARKET, BY COUNTRY, 2021-2031 ($MILLION)
    TABLE 69. JAPAN AI IN GENOMICS MARKET, BY OFFERING, 2021-2031 ($MILLION)
    TABLE 70. JAPAN AI IN GENOMICS MARKET, BY TECHNOLOGY, 2021-2031 ($MILLION)
    TABLE 71. JAPAN AI IN GENOMICS MARKET, BY APPLICATION, 2021-2031 ($MILLION)
    TABLE 72. JAPAN AI IN GENOMICS MARKET, BY END USER, 2021-2031 ($MILLION)
    TABLE 73. CHINA AI IN GENOMICS MARKET, BY OFFERING, 2021-2031 ($MILLION)
    TABLE 74. CHINA AI IN GENOMICS MARKET, BY TECHNOLOGY, 2021-2031 ($MILLION)
    TABLE 75. CHINA AI IN GENOMICS MARKET, BY APPLICATION, 2021-2031 ($MILLION)
    TABLE 76. CHINA AI IN GENOMICS MARKET, BY END USER, 2021-2031 ($MILLION)
    TABLE 77. AUSTRALIA AI IN GENOMICS MARKET, BY OFFERING, 2021-2031 ($MILLION)
    TABLE 78. AUSTRALIA AI IN GENOMICS MARKET, BY TECHNOLOGY, 2021-2031 ($MILLION)
    TABLE 79. AUSTRALIA AI IN GENOMICS MARKET, BY APPLICATION, 2021-2031 ($MILLION)
    TABLE 80. AUSTRALIA AI IN GENOMICS MARKET, BY END USER, 2021-2031 ($MILLION)
    TABLE 81. INDIA AI IN GENOMICS MARKET, BY OFFERING, 2021-2031 ($MILLION)
    TABLE 82. INDIA AI IN GENOMICS MARKET, BY TECHNOLOGY, 2021-2031 ($MILLION)
    TABLE 83. INDIA AI IN GENOMICS MARKET, BY APPLICATION, 2021-2031 ($MILLION)
    TABLE 84. INDIA AI IN GENOMICS MARKET, BY END USER, 2021-2031 ($MILLION)
    TABLE 85. SOUTH KOREA AI IN GENOMICS MARKET, BY OFFERING, 2021-2031 ($MILLION)
    TABLE 86. SOUTH KOREA AI IN GENOMICS MARKET, BY TECHNOLOGY, 2021-2031 ($MILLION)
    TABLE 87. SOUTH KOREA AI IN GENOMICS MARKET, BY APPLICATION, 2021-2031 ($MILLION)
    TABLE 88. SOUTH KOREA AI IN GENOMICS MARKET, BY END USER, 2021-2031 ($MILLION)
    TABLE 89. REST OF ASIA-PACIFIC AI IN GENOMICS MARKET, BY OFFERING, 2021-2031 ($MILLION)
    TABLE 90. REST OF ASIA-PACIFIC AI IN GENOMICS MARKET, BY TECHNOLOGY, 2021-2031 ($MILLION)
    TABLE 91. REST OF ASIA-PACIFIC AI IN GENOMICS MARKET, BY APPLICATION, 2021-2031 ($MILLION)
    TABLE 92. REST OF ASIA-PACIFIC AI IN GENOMICS MARKET, BY END USER, 2021-2031 ($MILLION)
    TABLE 93. LAMEA AI IN GENOMICS MARKET, BY OFFERING, 2021-2031 ($MILLION)
    TABLE 94. LAMEA AI IN GENOMICS MARKET, BY TECHNOLOGY, 2021-2031 ($MILLION)
    TABLE 95. LAMEA AI IN GENOMICS MARKET, BY APPLICATION, 2021-2031 ($MILLION)
    TABLE 96. LAMEA AI IN GENOMICS MARKET, BY END USER, 2021-2031 ($MILLION)
    TABLE 97. LAMEA AI IN GENOMICS MARKET, BY COUNTRY, 2021-2031 ($MILLION)
    TABLE 98. BRAZIL AI IN GENOMICS MARKET, BY OFFERING, 2021-2031 ($MILLION)
    TABLE 99. BRAZIL AI IN GENOMICS MARKET, BY TECHNOLOGY, 2021-2031 ($MILLION)
    TABLE 100. BRAZIL AI IN GENOMICS MARKET, BY APPLICATION, 2021-2031 ($MILLION)
    TABLE 101. BRAZIL AI IN GENOMICS MARKET, BY END USER, 2021-2031 ($MILLION)
    TABLE 102. SAUDI ARABIA AI IN GENOMICS MARKET, BY OFFERING, 2021-2031 ($MILLION)
    TABLE 103. SAUDI ARABIA AI IN GENOMICS MARKET, BY TECHNOLOGY, 2021-2031 ($MILLION)
    TABLE 104. SAUDI ARABIA AI IN GENOMICS MARKET, BY APPLICATION, 2021-2031 ($MILLION)
    TABLE 105. SAUDI ARABIA AI IN GENOMICS MARKET, BY END USER, 2021-2031 ($MILLION)
    TABLE 106. SOUTH AFRICA AI IN GENOMICS MARKET, BY OFFERING, 2021-2031 ($MILLION)
    TABLE 107. SOUTH AFRICA AI IN GENOMICS MARKET, BY TECHNOLOGY, 2021-2031 ($MILLION)
    TABLE 108. SOUTH AFRICA AI IN GENOMICS MARKET, BY APPLICATION, 2021-2031 ($MILLION)
    TABLE 109. SOUTH AFRICA AI IN GENOMICS MARKET, BY END USER, 2021-2031 ($MILLION)
    TABLE 110. REST OF LAMEA AI IN GENOMICS MARKET, BY OFFERING, 2021-2031 ($MILLION)
    TABLE 111. REST OF LAMEA AI IN GENOMICS MARKET, BY TECHNOLOGY, 2021-2031 ($MILLION)
    TABLE 112. REST OF LAMEA AI IN GENOMICS MARKET, BY APPLICATION, 2021-2031 ($MILLION)
    TABLE 113. REST OF LAMEA AI IN GENOMICS MARKET, BY END USER, 2021-2031 ($MILLION)
    TABLE 114. MICROSOFT CORPORATION: KEY EXECUTIVES
    TABLE 115. MICROSOFT CORPORATION: COMPANY SNAPSHOT
    TABLE 116. MICROSOFT CORPORATION: SERVICE SEGMENTS
    TABLE 117. MICROSOFT CORPORATION: PRODUCT PORTFOLIO
    TABLE 118. MICROSOFT CORPORATION: KEY STRATERGIES
    TABLE 119. IBM CORPORATION: KEY EXECUTIVES
    TABLE 120. IBM CORPORATION: COMPANY SNAPSHOT
    TABLE 121. IBM CORPORATION: SERVICE SEGMENTS
    TABLE 122. IBM CORPORATION: PRODUCT PORTFOLIO
    TABLE 123. IBM CORPORATION: KEY STRATERGIES
    TABLE 124. NVIDIA CORPORATION (MELLANOX TECHNOLOGIES): KEY EXECUTIVES
    TABLE 125. NVIDIA CORPORATION (MELLANOX TECHNOLOGIES): COMPANY SNAPSHOT
    TABLE 126. NVIDIA CORPORATION (MELLANOX TECHNOLOGIES): PRODUCT SEGMENTS
    TABLE 127. NVIDIA CORPORATION (MELLANOX TECHNOLOGIES): PRODUCT PORTFOLIO
    TABLE 128. NVIDIA CORPORATION (MELLANOX TECHNOLOGIES): KEY STRATERGIES
    TABLE 129. DEEP GENOMICS: KEY EXECUTIVES
    TABLE 130. DEEP GENOMICS: COMPANY SNAPSHOT
    TABLE 131. DEEP GENOMICS: SERVICE SEGMENTS
    TABLE 132. DEEP GENOMICS: PRODUCT PORTFOLIO
    TABLE 133. DEEP GENOMICS: KEY STRATERGIES
    TABLE 134. DATA4CURE, INC: KEY EXECUTIVES
    TABLE 135. DATA4CURE, INC: COMPANY SNAPSHOT
    TABLE 136. DATA4CURE, INC: SERVICE SEGMENTS
    TABLE 137. DATA4CURE, INC: PRODUCT PORTFOLIO
    TABLE 138. FREENOME HOLDINGS, INC: KEY EXECUTIVES
    TABLE 139. FREENOME HOLDINGS, INC: COMPANY SNAPSHOT
    TABLE 140. FREENOME HOLDINGS, INC: SERVICE SEGMENTS
    TABLE 141. FREENOME HOLDINGS, INC: PRODUCT PORTFOLIO
    TABLE 142. THERMO FISHER SCIENTIFIC INC.: KEY EXECUTIVES
    TABLE 143. THERMO FISHER SCIENTIFIC INC.: COMPANY SNAPSHOT
    TABLE 144. THERMO FISHER SCIENTIFIC INC.: PRODUCT SEGMENTS
    TABLE 145. THERMO FISHER SCIENTIFIC INC.: PRODUCT PORTFOLIO
    TABLE 146. ILLUMINA, INC.: KEY EXECUTIVES
    TABLE 147. ILLUMINA, INC.: COMPANY SNAPSHOT
    TABLE 148. ILLUMINA, INC.: PRODUCT SEGMENTS
    TABLE 149. ILLUMINA, INC.: PRODUCT PORTFOLIO
    TABLE 150. ILLUMINA, INC.: KEY STRATERGIES
    TABLE 151. SOPHIA GENETICS: KEY EXECUTIVES
    TABLE 152. SOPHIA GENETICS: COMPANY SNAPSHOT
    TABLE 153. SOPHIA GENETICS: PRODUCT SEGMENTS
    TABLE 154. SOPHIA GENETICS: SERVICE SEGMENTS
    TABLE 155. SOPHIA GENETICS: PRODUCT PORTFOLIO
    TABLE 156. BENEVOLENTAI: KEY EXECUTIVES
    TABLE 157. BENEVOLENTAI: COMPANY SNAPSHOT
    TABLE 158. BENEVOLENTAI: SERVICE SEGMENTS
    TABLE 159. BENEVOLENTAI: PRODUCT PORTFOLIO
    TABLE 160. BENEVOLENTAI: KEY STRATERGIES
  • LIST OF FIGURES

  • FIGURE 01. AI IN GENOMICS MARKET, 2021-2031
    FIGURE 02. SEGMENTATION OF AI IN GENOMICS MARKET, 2021-2031
    FIGURE 03. TOP INVESTMENT POCKETS IN AI IN GENOMICS MARKET (2022-2031)
    FIGURE 04. LOW BARGAINING POWER OF SUPPLIERS
    FIGURE 05. LOW BARGAINING POWER OF BUYERS
    FIGURE 06. LOW THREAT OF SUBSTITUTES
    FIGURE 07. LOW THREAT OF NEW ENTRANTS
    FIGURE 08. LOW INTENSITY OF RIVALRY
    FIGURE 09. DRIVERS, RESTRAINTS AND OPPORTUNITIES: GLOBALAI IN GENOMICS MARKET
    FIGURE 10. AI IN GENOMICS MARKET, BY OFFERING, 2021(%)
    FIGURE 11. COMPARATIVE SHARE ANALYSIS OF AI IN GENOMICS MARKET FOR HARDWARE, BY COUNTRY 2021-2031(%)
    FIGURE 12. COMPARATIVE SHARE ANALYSIS OF AI IN GENOMICS MARKET FOR SOFTWARE, BY COUNTRY 2021-2031(%)
    FIGURE 13. COMPARATIVE SHARE ANALYSIS OF AI IN GENOMICS MARKET FOR SERVICES, BY COUNTRY 2021-2031(%)
    FIGURE 14. AI IN GENOMICS MARKET, BY TECHNOLOGY, 2021(%)
    FIGURE 15. COMPARATIVE SHARE ANALYSIS OF AI IN GENOMICS MARKET FOR MACHINE LEARNING, BY COUNTRY 2021-2031(%)
    FIGURE 16. COMPARATIVE SHARE ANALYSIS OF AI IN GENOMICS MARKET FOR COMPUTER VISION, BY COUNTRY 2021-2031(%)
    FIGURE 17. AI IN GENOMICS MARKET, BY APPLICATION, 2021(%)
    FIGURE 18. COMPARATIVE SHARE ANALYSIS OF AI IN GENOMICS MARKET FOR DRUG DISCOVERY AND DEVELOPMENT, BY COUNTRY 2021-2031(%)
    FIGURE 19. COMPARATIVE SHARE ANALYSIS OF AI IN GENOMICS MARKET FOR PRECISION MEDICINE, BY COUNTRY 2021-2031(%)
    FIGURE 20. COMPARATIVE SHARE ANALYSIS OF AI IN GENOMICS MARKET FOR DIAGNOSTICS, BY COUNTRY 2021-2031(%)
    FIGURE 21. COMPARATIVE SHARE ANALYSIS OF AI IN GENOMICS MARKET FOR OTHERS, BY COUNTRY 2021-2031(%)
    FIGURE 22. AI IN GENOMICS MARKET, BY END USER, 2021(%)
    FIGURE 23. COMPARATIVE SHARE ANALYSIS OF AI IN GENOMICS MARKET FOR PHARMACEUTICAL AND BIOTECH COMPANIES, BY COUNTRY 2021-2031(%)
    FIGURE 24. COMPARATIVE SHARE ANALYSIS OF AI IN GENOMICS MARKET FOR HEALTHCARE PROVIDERS, BY COUNTRY 2021-2031(%)
    FIGURE 25. COMPARATIVE SHARE ANALYSIS OF AI IN GENOMICS MARKET FOR RESEARCH CENTERS, BY COUNTRY 2021-2031(%)
    FIGURE 26. AI IN GENOMICS MARKET BY REGION, 2021
    FIGURE 27. U.S. AI IN GENOMICS MARKET, 2021-2031 ($MILLION)
    FIGURE 28. CANADA AI IN GENOMICS MARKET, 2021-2031 ($MILLION)
    FIGURE 29. MEXICO AI IN GENOMICS MARKET, 2021-2031 ($MILLION)
    FIGURE 30. GERMANY AI IN GENOMICS MARKET, 2021-2031 ($MILLION)
    FIGURE 31. FRANCE AI IN GENOMICS MARKET, 2021-2031 ($MILLION)
    FIGURE 32. UK AI IN GENOMICS MARKET, 2021-2031 ($MILLION)
    FIGURE 33. ITALY AI IN GENOMICS MARKET, 2021-2031 ($MILLION)
    FIGURE 34. SPAIN AI IN GENOMICS MARKET, 2021-2031 ($MILLION)
    FIGURE 35. REST OF EUROPE AI IN GENOMICS MARKET, 2021-2031 ($MILLION)
    FIGURE 36. JAPAN AI IN GENOMICS MARKET, 2021-2031 ($MILLION)
    FIGURE 37. CHINA AI IN GENOMICS MARKET, 2021-2031 ($MILLION)
    FIGURE 38. AUSTRALIA AI IN GENOMICS MARKET, 2021-2031 ($MILLION)
    FIGURE 39. INDIA AI IN GENOMICS MARKET, 2021-2031 ($MILLION)
    FIGURE 40. SOUTH KOREA AI IN GENOMICS MARKET, 2021-2031 ($MILLION)
    FIGURE 41. REST OF ASIA-PACIFIC AI IN GENOMICS MARKET, 2021-2031 ($MILLION)
    FIGURE 42. BRAZIL AI IN GENOMICS MARKET, 2021-2031 ($MILLION)
    FIGURE 43. SAUDI ARABIA AI IN GENOMICS MARKET, 2021-2031 ($MILLION)
    FIGURE 44. SOUTH AFRICA AI IN GENOMICS MARKET, 2021-2031 ($MILLION)
    FIGURE 45. REST OF LAMEA AI IN GENOMICS MARKET, 2021-2031 ($MILLION)
    FIGURE 46. TOP WINNING STRATEGIES, BY YEAR
    FIGURE 47. TOP WINNING STRATEGIES, BY DEVELOPMENT
    FIGURE 48. TOP WINNING STRATEGIES, BY COMPANY
    FIGURE 49. PRODUCT MAPPING OF TOP 10 PLAYERS
    FIGURE 50. COMPETITIVE DASHBOARD
    FIGURE 51. COMPETITIVE HEATMAP: AI IN GENOMICS MARKET
    FIGURE 52. TOP PLAYER POSITIONING, 2021
    FIGURE 53. MICROSOFT CORPORATION: NET REVENUE, 2020-2022 ($MILLION)
    FIGURE 54. MICROSOFT CORPORATION: RESEARCH & DEVELOPMENT EXPENDITURE, 2020-2022 ($MILLION)
    FIGURE 55. MICROSOFT CORPORATION: REVENUE SHARE BY SEGMENT, 2022 (%)
    FIGURE 56. MICROSOFT CORPORATION: REVENUE SHARE BY REGION, 2022 (%)
    FIGURE 57. IBM CORPORATION: NET REVENUE, 2019-2021 ($MILLION)
    FIGURE 58. IBM CORPORATION: RESEARCH & DEVELOPMENT EXPENDITURE, 2019-2021
    FIGURE 59. IBM CORPORATION: REVENUE SHARE BY REGION, 2021 (%)
    FIGURE 60. IBM CORPORATION: REVENUE SHARE BY SEGMENT, 2021 (%)
    FIGURE 61. NVIDIA CORPORATION (MELLANOX TECHNOLOGIES): NET REVENUE, 2020-2022 ($MILLION)
    FIGURE 62. NVIDIA CORPORATION (MELLANOX TECHNOLOGIES): RESEARCH & DEVELOPMENT EXPENDITURE, 2020-2022
    FIGURE 63. NVIDIA CORPORATION (MELLANOX TECHNOLOGIES): REVENUE SHARE BY SEGMENT, 2022 (%)
    FIGURE 64. NVIDIA CORPORATION (MELLANOX TECHNOLOGIES): REVENUE SHARE BY REGION, 2022 (%)
    FIGURE 65. THERMO FISHER SCIENTIFIC INC.: NET REVENUE, 2019-2021 ($MILLION)
    FIGURE 66. THERMO FISHER SCIENTIFIC INC.: REVENUE SHARE BY SEGMENT, 2021 (%)
    FIGURE 67. THERMO FISHER SCIENTIFIC INC.: REVENUE SHARE BY REGION, 2021 (%)
    FIGURE 68. ILLUMINA, INC.: NET REVENUE, 2020-2022 ($MILLION)
    FIGURE 69. ILLUMINA, INC.: REVENUE SHARE BY SEGMENT, 2022 (%)
    FIGURE 70. ILLUMINA, INC.: REVENUE SHARE BY REGION, 2022 (%)
    FIGURE 71. SOPHIA GENETICS: NET REVENUE, 2019-2021 ($MILLION)
    FIGURE 72. SOPHIA GENETICS: REVENUE SHARE BY SEGMENT, 2021 (%)
    FIGURE 73. SOPHIA GENETICS: REVENUE SHARE BY REGION, 2021 (%)


PURCHASE OPTIONS

Call or Email us

U.S.-Canada Toll-free: +1-800-792-5285
Int'l : +1-503-894-6022
Europe : +44-845-528-1300
Email : help@alliedmarketresearch.com
 
FREQUENTLY ASKED QUESTIONS?

A. Upcoming trends for AI in genomics are the development of personalized medicine coupled with its application in drug discovery and disease diagnosis.

A. The drug discovery segment was highest contributor to the market in 2021

A. North America was the highest revenue contributor to the market in 2021.

A. The AI in genomics market was valued at $346.3 million in 2021, and is projected to reach $9859.7 million by 2031, registering a CAGR of 40.6% from 2022 to 2031.

A. Thermo Fisher Scientific Inc., Deep Genomics,Illumina, Inc., Data4Cure, Inc., BenevolentAI and Microsoft Corporation were the top companies to hold the highest market share in AI in Genomics Market

A. Yes, competitive landscape included in the AI in Genomics Market

A. Asia Pacific is the fastest-growing region in AI in Genomics Market in 2021.

A. Advancements in AI technology have the potential to act as a major driver for the AI in genomics market. AI is a powerful tool that can analyze vast amounts of genomic data quickly and accurately, helping to unlock the secrets of the human genome and revolutionize the field of genomics.

Looking for Customization?

 Customization Request

Have a Question?

 Speak with Analyst

Any Confusion?

 Inquire Before Buying

Have a glance of the Report

  Request Sample
RELATED TAGS

Purchase Full Report of
Ai In Genomics Market

Start reading instantly.
This Report and over 66,905+ more Reports, Available with Avenue Library. T&C*.

  • Online Only
  • $3,690
  • Online cloud access only
  • Restricted print, copy, paste & download
  • Read only
  • Free industry update
    (Within 180 days)
  • Free report update in next update cycle
    (Mar 2024 - Mar 2025)
  • Data Pack
  • $3,930
  • Restricted to one authorized user
  • One print only
  • Available in
    Excel
  • Free industry update
    (Within 180 days)
  •   Free report update in next update cycle
    (Mar 2024 - Mar 2025)
  • Single User
  • $5,820
  • Restricted to one authorized user
  • One print only
  • Available in
    PDF
  • Free industry update
    (Within 180 days)
  •   Free report update in next update cycle
    (Mar 2024 - Mar 2025)
  • Five Users
  • $6,540
  • Limited to five authorized users
  • Print upto five copies
  • Available in
    PDF
  • Free industry update
    (Within 180 days)
  •   Free report update in next update cycle
    (Mar 2024 - Mar 2025)
  • Enterprise
    License/PDF

  • $9,870
  • Unlimited
    within
    company/enterprise
  • Available in Excel & PDF
  • Free industry update
    (Within 180 days)
  •   Free report update in next update cycle
    (Mar 2024 - Mar 2025)
  • Library
    Membership

  • $999 $ 1,175
    Per User/ Per month/ Billed annually
  • Published Content
    E-access
  • Company Profiles
    E-access
  • Newly Added Content Access
  • 10 PDF
    Downloads
  • 5 Excel Data
    Pack Downloads
  • 250 Company Profiles PDF Downloads
  • Buy Now

*Taxes/Fees, if applicable will be added during checkout. All prices in USD

RELATED REPORTS
 

Why Allied Market Research?


Infallible Methodology

To ensure high-level data integrity, accurate analysis, and impeccable forecasts

Analyst Support

For complete satisfaction

Customization

On-demand customization of scope of the report to exactly meet your needs

TARGETED MARKET VIEW

Targeted market view to provide pertinent information and save time of readers

Get fresh content delivered

Get insights on topics that are crucial for your business. Stay abreast of your interest areas.

Get Industry Data Alerts

Why Allied Market Research?

Infallible Methodology

To ensure high-level data integrity, accurate analysis, and impeccable forecasts

Analyst Support

For complete satisfaction

Customization

On-demand customization of scope of the report to exactly meet your needs

TARGETED MARKET VIEW

Targeted market view to provide pertinent information and save time of readers