0
2022
Air Powered Vehicle Market

Air Powered Vehicle Market

By Vehicle Type (Passenger Vehicle, Commercial Vehicle, Motorcycles & Scooters), By Product Type (Single Energy Mode, Dual Energy Mode), By Range (Less Than 100 KM, 100-200 KM, More Than 200 KM), By Top Speed (Up To 100 kmph, More Than 100 kmph): Global Opportunity Analysis and Industry Forecast, 2025 - 2035

Report Code: A08900
Aug 2022 | Pages: 343
Tables: 211
Charts: 69
  • Formats*:

  • pdf

    Single User License, Five User
    License & Enterprise User License

  • xls

    Data Pack Excel License

  • ppt

    It comes with the additional cost
    of $2500.00 contact sales.


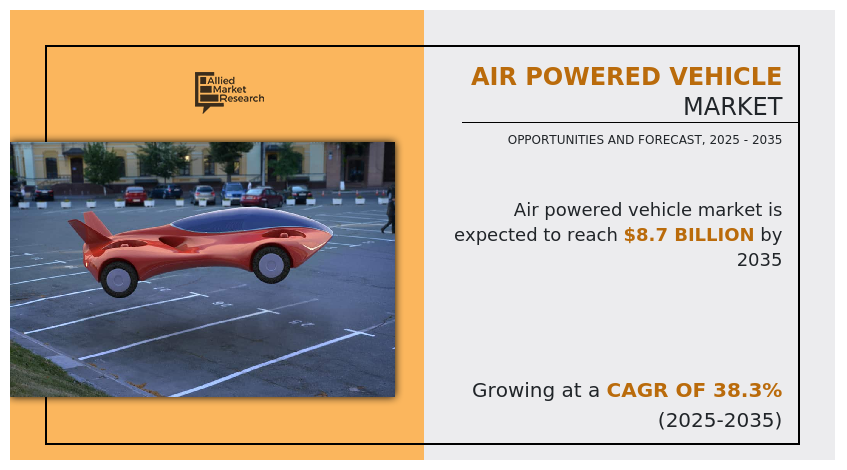
The global air powered vehicle market was valued at $339.4 million in 2025, and is projected to reach $8,692.47 million by 2035, registering a CAGR of 38.3% from 2025 to 2035.

An air powered vehicle, also known as air compressed vehicle, is a green vehicle that uses a compressed air engine, an alternative of the internal combustion (IC) engine and works on the principle of compressed air technology (CAT). It utilizes compressed air, a non-polluting fuel, as a power source in order to run the vehicle. The air is pushed down into small chamber which further moves the crankshaft and powers the vehicle. The air inside air powered vehicle is fed through air injector to the engine. As the vehicle runs on compressed air instead of gasoline, the vehicle is considered into environmentally friendly vehicle. It is primarily designed to replace conventional ways of travel as they lead to environmental pollution. It has gained popularity owing to numerous technological advancements. Furthermore, the air powered vehicle offers long life of the vehicle, high energy density of compressed air, and low toxicity as compared to other alternatives of the IC engine vehicle.

Oregon

Air Powered Vehicle Market, Air Powered Vehicle Industry

The factors such as increasing awareness of environment friendly vehicles, stringent government norms and emission standards to reduce carbon footprints, and rising fuel prices supplement the growth of the air powered vehicle market. However, low speed of air powered vehicles and increasing adoption of battery electric vehicles (BEVs) & hybrid electric vehicles (HEVs) are the factors expected to hamper the growth of the market. In addition, increasing research and development in air powered vehicles and rise in demand for air hybrid vehicles creates market opportunities for the key players operating in the air powered vehicle market.
Air Powered Vehicle Market

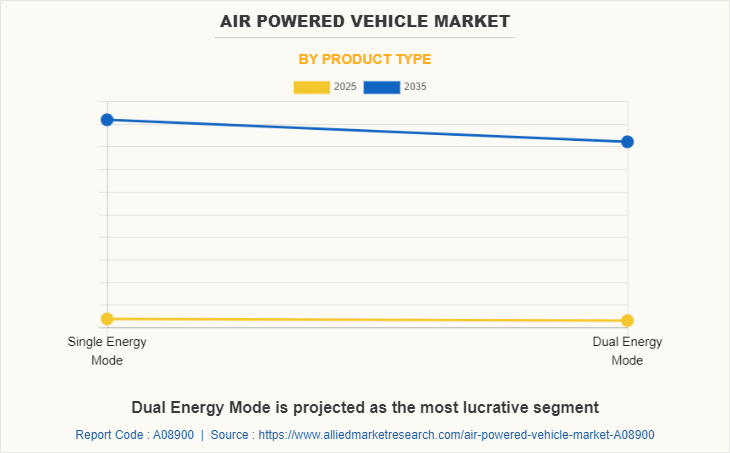
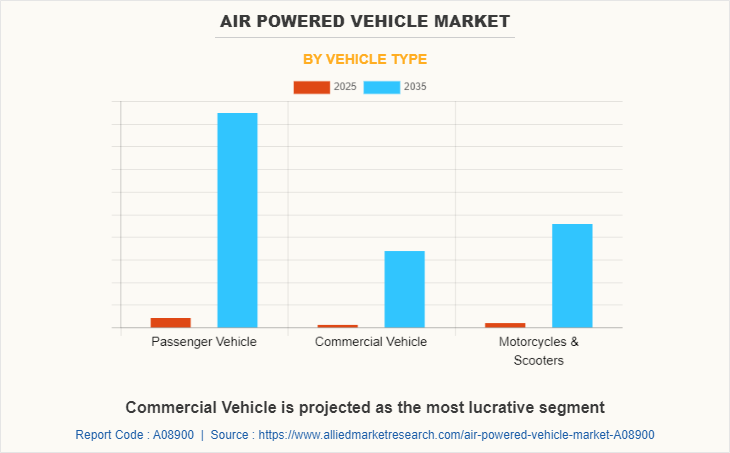
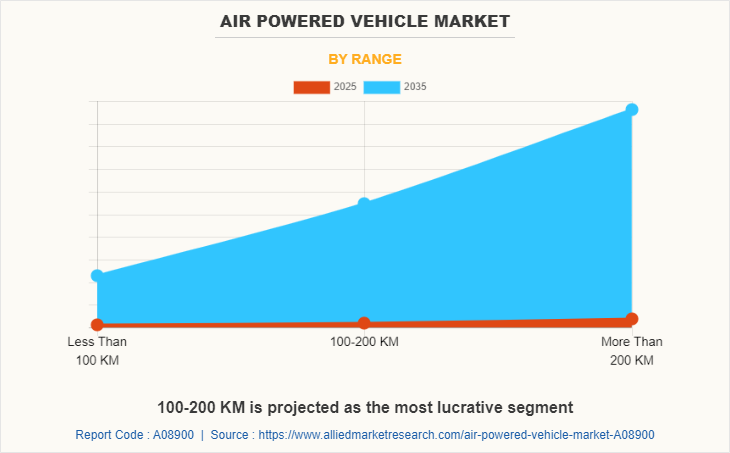
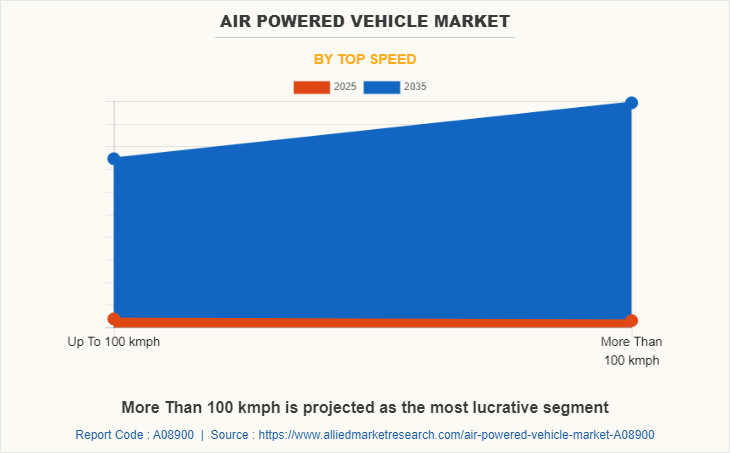
The air powered vehicle market is segmented into product type, vehicle type, range, and top speed. By product type, the market is divided into single energy mode and dual energy mode. By vehicle type, it is fragmented into passenger cars, commercial vehicles, and motorcycles & scooters. By range, it is categorized into less than 100 KM, 100-200 KM, and more than 200 KM. By top speed, it is categorized into up to 100 kmph and more than 100 kmph. By region, it is analyzed across North America, Europe, Asia-Pacific, and LAMEA..

The leading players operating in the air powered vehicle market are AB Volvo, Audi AG, Ballard Power Systems, BMW AG, Engineair Pty Ltd, General Motors, Honda Motor Co., Ltd., Hyundai Motor Company, Man SE, Mercedes-Benz Group AG, Motor Development International SA, Peugeot S.A., Phinergy, Suzuki Motor Corporation, Tata Motors, Toyota Motor Corporation, and Volkswagen AG.

Air Powered Vehicle Market

Increasing awareness of environment friendly vehicles

Gasoline being a fossil fuel is not a renewable source of energy and is anticipated to get exhausted in the future. Meanwhile, to support sustainable development, it is important to develop and use alternative sources of fuel. This involves use of environment friendly vehicles such as electric mobility & air powered vehicles, which do not use gas and are more economical than conventional vehicles. Also, emissions caused due to internal combustion engines of the vehicles degrades the environment to a much larger extent, as the tailpipe of the vehicle emits chlorofluorocarbons and other harmful gases, which lead to environment pollution. Meanwhile, air powered vehicles are the solution to these issues, as these vehicles emit no pollutants as exhaust gas. Hence, using more energy-efficient vehicles like air hybrid and plug-in electric vehicles has become an essential part of continuing the booming trend of minimizing imported petroleum globally.  This is attributed to depleting fossil fuel reserves and growth in tendency of companies to gain maximum profit from these oil reserves. Thus, these factors give rise to the need for advanced air powered vehicle technologies, thereby propels the market growth.
Air Powered Vehicle Market

Stringent government norms and emission standards to reduce carbon footprints

With the growing environmental concerns, governments and environmental agencies across the world are enacting stringent emission norms and laws to reduce vehicle emission. Major regulatory measures are stringent emissions targets for the reduction of nitrogen oxides (NOx) and carbon dioxide (CO2) in air. High amounts of greenhouse gases being emitted from vehicles and federal and state governments in the U.S. are stepping up efforts to make transportation cleaner. For instance, the U.S. Environmental Protection Agency (EPA) announced that they are working on new rules to decrease emissions of nitrogen oxide (NOx) and other pollutants from heavy-duty trucks. Also, the agency finalized federal greenhouse gas (GHG) emissions standards for passenger cars and light trucks in the US through 2026. The final standards leverage advances in clean car technology to unlock $190 billion in net benefits to Americans, including reducing climate pollution, improving public health, and saving drivers money at the pump. Therefore, with enactment of the emission regulations for fossil fuel-powered vehicle, the burden on vehicle manufacturers, especially on commercial vehicle manufacturers, has further increased. This, in turn, is expected to drive the demand for air powered vehicle market in the forecast period.   
Air Powered Vehicle Market

Increasing adoption of battery electric vehicles (BEVs) & hybrid electric vehicles (HEVs)

Electric vehicles (EVs) are experiencing a rise in popularity over the past few years as the technology has matured & costs have declined, and support for clean transportation has promoted awareness, increased charging opportunities, and facilitated EV adoption. According to European Environment Agency, in 2020, electric car registrations surged, accounting for 11% of newly registered passenger cars in which battery electric vehicles (BEVs) accounted for 6% of total new car registrations, while plug-in hybrid electric vehicles (PHEVs) represented 5%. Even subsidies for purchasing electric cars have led consumers to adopt EVs. Hence, rise in adoption of electric vehicles such as battery electric vehicle (BEV) and hybrid electric vehicle (HEV), owing to emission concerns and government subsidies and incentives being offered on purchase on electric vehicles, is another factor that is projected to hamper the air powered vehicle market during the forecast period.
Air Powered Vehicle Market

Increasing research and development in air powered vehicles

Various companies are investing in the research and development of the air powered vehicle owing to its advantages. Besides, companies are planning strategically for deployment of air powered vehicles. Additionally, the manufacturers are developing to increase the range and performance of vehicle. Although, the production vehicle is yet to be revealed, companies have launched various concept vehicles. Also, companies are working actively on launch of production vehicles. For instance, the Luxembourg-based company MDI has come a long way in its development and pledges to launch the zero-emission AirPod 2.0 soon. Researchers at the University of Ontario Institute of Technology have taken a closer look at the air pressure concept for passenger cars and come to a surprising result. Also, scientists are working on improvements in the new system design of air powered vehicles including weight and volume reduction to reduce the space demand in the vehicle, which enhances the vehicle’s driving range with lowering emissions. All such factors are estimated to ultimately propel the air powered vehicle market opportunity during the forecast period.

Key Benefits For Stakeholders

  • This study presents analytical depiction of the global air powered vehicle market analysis along with current trends and future estimations to depict imminent investment pockets.
  • The overall air powered vehicle market opportunity is determined by understanding profitable trends to gain a stronger foothold.
  • The report presents information related to the key drivers, restraints, and opportunities of the global air powered vehicle market with a detailed impact analysis.
  • The current air powered vehicle market is quantitatively analyzed from 2025 to 2035 to benchmark the financial competency.
  • Porter’s five forces analysis illustrates the potency of the buyers and suppliers in the industry.

Air Powered Vehicle Market Report Highlights

Aspects Details
By Vehicle Type
  • Passenger Vehicle
  • Commercial Vehicle
  • Motorcycles & Scooters
By Product Type
  • Single Energy Mode
  • Dual Energy Mode
By Range
  • Less Than 100 KM
  • 100-200 KM
  • More Than 200 KM
By Top Speed
  • Up To 100 kmph
  • More Than 100 kmph
By Region
  • North America  (U.S., Canada, Mexico)
  • Europe  (U.K., Germany, France, Spain, Netherlands, Norway, Rest of Europe)
  • Asia-Pacific  (Rest of Asia-Pacific, China, Japan, India, Australia, South Korea, Singapore)
  • LAMEA  (Latin America, Middle East, Africa)
Key Market Players Magnetic Air Car, Inc., Tata Motors Limited, Motor development international SA, AUDI AG, GENERAL MOTORS COMPANY, Peugeot S.A., BMW GROUP, TOYOTA MOTOR CORPORATION, HYUNDAI MOTOR GROUP, VOLVO GROUP, Honda Motor Company, Ltd., Matrix Comsec, Engineair Pty Ltd, Phinergy, DAIMLER AG, MAN SE, BALLARD POWER SYSTEMS INC
 
  • CHAPTER 1:INTRODUCTION

    • 1.1.Report description

    • 1.2.Key market segments

    • 1.3.Key benefits to the stakeholders

    • 1.4.Research Methodology

      • 1.4.1.Secondary research

      • 1.4.2.Primary research

      • 1.4.3.Analyst tools and models

  • CHAPTER 2:EXECUTIVE SUMMARY

    • 2.1.Key findings of the study

    • 2.2.CXO Perspective

  • CHAPTER 3:MARKET OVERVIEW

    • 3.1.Market definition and scope

    • 3.2.Key findings

      • 3.2.1.Top investment pockets

    • 3.3.Porter’s five forces analysis

    • 3.4.Top player positioning

    • 3.5.Market dynamics

      • 3.5.1.Drivers

      • 3.5.2.Restraints

      • 3.5.3.Opportunities

    • 3.6.COVID-19 Impact Analysis on the market

  • CHAPTER 4: AIR POWERED VEHICLE MARKET, BY PRODUCT TYPE

    • 4.1 Overview

      • 4.1.1 Market size and forecast

    • 4.2 Single Energy Mode

      • 4.2.1 Key market trends, growth factors and opportunities

      • 4.2.2 Market size and forecast, by region

      • 4.2.3 Market analysis by country

    • 4.3 Dual Energy Mode

      • 4.3.1 Key market trends, growth factors and opportunities

      • 4.3.2 Market size and forecast, by region

      • 4.3.3 Market analysis by country

  • CHAPTER 5: AIR POWERED VEHICLE MARKET, BY VEHICLE TYPE

    • 5.1 Overview

      • 5.1.1 Market size and forecast

    • 5.2 Passenger Vehicle

      • 5.2.1 Key market trends, growth factors and opportunities

      • 5.2.2 Market size and forecast, by region

      • 5.2.3 Market analysis by country

    • 5.3 Commercial Vehicle

      • 5.3.1 Key market trends, growth factors and opportunities

      • 5.3.2 Market size and forecast, by region

      • 5.3.3 Market analysis by country

    • 5.4 Motorcycles & Scooters

      • 5.4.1 Key market trends, growth factors and opportunities

      • 5.4.2 Market size and forecast, by region

      • 5.4.3 Market analysis by country

  • CHAPTER 6: AIR POWERED VEHICLE MARKET, BY RANGE

    • 6.1 Overview

      • 6.1.1 Market size and forecast

    • 6.2 Less Than 100 KM

      • 6.2.1 Key market trends, growth factors and opportunities

      • 6.2.2 Market size and forecast, by region

      • 6.2.3 Market analysis by country

    • 6.3 100-200 KM

      • 6.3.1 Key market trends, growth factors and opportunities

      • 6.3.2 Market size and forecast, by region

      • 6.3.3 Market analysis by country

    • 6.4 More Than 200 KM

      • 6.4.1 Key market trends, growth factors and opportunities

      • 6.4.2 Market size and forecast, by region

      • 6.4.3 Market analysis by country

  • CHAPTER 7: AIR POWERED VEHICLE MARKET, BY TOP SPEED

    • 7.1 Overview

      • 7.1.1 Market size and forecast

    • 7.2 Up To 100 kmph

      • 7.2.1 Key market trends, growth factors and opportunities

      • 7.2.2 Market size and forecast, by region

      • 7.2.3 Market analysis by country

    • 7.3 More Than 100 kmph

      • 7.3.1 Key market trends, growth factors and opportunities

      • 7.3.2 Market size and forecast, by region

      • 7.3.3 Market analysis by country

  • CHAPTER 8: AIR POWERED VEHICLE MARKET, BY REGION

    • 8.1 Overview

      • 8.1.1 Market size and forecast

    • 8.2 North America

      • 8.2.1 Key trends and opportunities

      • 8.2.2 North America Market size and forecast, by Product Type

      • 8.2.3 North America Market size and forecast, by Vehicle Type

      • 8.2.4 North America Market size and forecast, by Range

      • 8.2.5 North America Market size and forecast, by Top Speed

      • 8.2.6 North America Market size and forecast, by country

        • 8.2.6.1 U.S.
          • 8.2.6.1.1 Market size and forecast, by Product Type
          • 8.2.6.1.2 Market size and forecast, by Vehicle Type
          • 8.2.6.1.3 Market size and forecast, by Range
          • 8.2.6.1.4 Market size and forecast, by Top Speed
        • 8.2.6.2 Canada
          • 8.2.6.2.1 Market size and forecast, by Product Type
          • 8.2.6.2.2 Market size and forecast, by Vehicle Type
          • 8.2.6.2.3 Market size and forecast, by Range
          • 8.2.6.2.4 Market size and forecast, by Top Speed
        • 8.2.6.3 Mexico
          • 8.2.6.3.1 Market size and forecast, by Product Type
          • 8.2.6.3.2 Market size and forecast, by Vehicle Type
          • 8.2.6.3.3 Market size and forecast, by Range
          • 8.2.6.3.4 Market size and forecast, by Top Speed
    • 8.3 Europe

      • 8.3.1 Key trends and opportunities

      • 8.3.2 Europe Market size and forecast, by Product Type

      • 8.3.3 Europe Market size and forecast, by Vehicle Type

      • 8.3.4 Europe Market size and forecast, by Range

      • 8.3.5 Europe Market size and forecast, by Top Speed

      • 8.3.6 Europe Market size and forecast, by country

        • 8.3.6.1 U.K.
          • 8.3.6.1.1 Market size and forecast, by Product Type
          • 8.3.6.1.2 Market size and forecast, by Vehicle Type
          • 8.3.6.1.3 Market size and forecast, by Range
          • 8.3.6.1.4 Market size and forecast, by Top Speed
        • 8.3.6.2 Germany
          • 8.3.6.2.1 Market size and forecast, by Product Type
          • 8.3.6.2.2 Market size and forecast, by Vehicle Type
          • 8.3.6.2.3 Market size and forecast, by Range
          • 8.3.6.2.4 Market size and forecast, by Top Speed
        • 8.3.6.3 France
          • 8.3.6.3.1 Market size and forecast, by Product Type
          • 8.3.6.3.2 Market size and forecast, by Vehicle Type
          • 8.3.6.3.3 Market size and forecast, by Range
          • 8.3.6.3.4 Market size and forecast, by Top Speed
        • 8.3.6.4 Spain
          • 8.3.6.4.1 Market size and forecast, by Product Type
          • 8.3.6.4.2 Market size and forecast, by Vehicle Type
          • 8.3.6.4.3 Market size and forecast, by Range
          • 8.3.6.4.4 Market size and forecast, by Top Speed
        • 8.3.6.5 Netherlands
          • 8.3.6.5.1 Market size and forecast, by Product Type
          • 8.3.6.5.2 Market size and forecast, by Vehicle Type
          • 8.3.6.5.3 Market size and forecast, by Range
          • 8.3.6.5.4 Market size and forecast, by Top Speed
        • 8.3.6.6 Norway
          • 8.3.6.6.1 Market size and forecast, by Product Type
          • 8.3.6.6.2 Market size and forecast, by Vehicle Type
          • 8.3.6.6.3 Market size and forecast, by Range
          • 8.3.6.6.4 Market size and forecast, by Top Speed
        • 8.3.6.7 Rest of Europe
          • 8.3.6.7.1 Market size and forecast, by Product Type
          • 8.3.6.7.2 Market size and forecast, by Vehicle Type
          • 8.3.6.7.3 Market size and forecast, by Range
          • 8.3.6.7.4 Market size and forecast, by Top Speed
    • 8.4 Asia-Pacific

      • 8.4.1 Key trends and opportunities

      • 8.4.2 Asia-Pacific Market size and forecast, by Product Type

      • 8.4.3 Asia-Pacific Market size and forecast, by Vehicle Type

      • 8.4.4 Asia-Pacific Market size and forecast, by Range

      • 8.4.5 Asia-Pacific Market size and forecast, by Top Speed

      • 8.4.6 Asia-Pacific Market size and forecast, by country

        • 8.4.6.1 China
          • 8.4.6.1.1 Market size and forecast, by Product Type
          • 8.4.6.1.2 Market size and forecast, by Vehicle Type
          • 8.4.6.1.3 Market size and forecast, by Range
          • 8.4.6.1.4 Market size and forecast, by Top Speed
        • 8.4.6.2 Japan
          • 8.4.6.2.1 Market size and forecast, by Product Type
          • 8.4.6.2.2 Market size and forecast, by Vehicle Type
          • 8.4.6.2.3 Market size and forecast, by Range
          • 8.4.6.2.4 Market size and forecast, by Top Speed
        • 8.4.6.3 India
          • 8.4.6.3.1 Market size and forecast, by Product Type
          • 8.4.6.3.2 Market size and forecast, by Vehicle Type
          • 8.4.6.3.3 Market size and forecast, by Range
          • 8.4.6.3.4 Market size and forecast, by Top Speed
        • 8.4.6.4 Australia
          • 8.4.6.4.1 Market size and forecast, by Product Type
          • 8.4.6.4.2 Market size and forecast, by Vehicle Type
          • 8.4.6.4.3 Market size and forecast, by Range
          • 8.4.6.4.4 Market size and forecast, by Top Speed
        • 8.4.6.5 South Korea
          • 8.4.6.5.1 Market size and forecast, by Product Type
          • 8.4.6.5.2 Market size and forecast, by Vehicle Type
          • 8.4.6.5.3 Market size and forecast, by Range
          • 8.4.6.5.4 Market size and forecast, by Top Speed
        • 8.4.6.6 Singapore
          • 8.4.6.6.1 Market size and forecast, by Product Type
          • 8.4.6.6.2 Market size and forecast, by Vehicle Type
          • 8.4.6.6.3 Market size and forecast, by Range
          • 8.4.6.6.4 Market size and forecast, by Top Speed
        • 8.4.6.7 Rest of Asia-Pacific
          • 8.4.6.7.1 Market size and forecast, by Product Type
          • 8.4.6.7.2 Market size and forecast, by Vehicle Type
          • 8.4.6.7.3 Market size and forecast, by Range
          • 8.4.6.7.4 Market size and forecast, by Top Speed
    • 8.5 LAMEA

      • 8.5.1 Key trends and opportunities

      • 8.5.2 LAMEA Market size and forecast, by Product Type

      • 8.5.3 LAMEA Market size and forecast, by Vehicle Type

      • 8.5.4 LAMEA Market size and forecast, by Range

      • 8.5.5 LAMEA Market size and forecast, by Top Speed

      • 8.5.6 LAMEA Market size and forecast, by country

        • 8.5.6.1 Latin America
          • 8.5.6.1.1 Market size and forecast, by Product Type
          • 8.5.6.1.2 Market size and forecast, by Vehicle Type
          • 8.5.6.1.3 Market size and forecast, by Range
          • 8.5.6.1.4 Market size and forecast, by Top Speed
        • 8.5.6.2 Middle East
          • 8.5.6.2.1 Market size and forecast, by Product Type
          • 8.5.6.2.2 Market size and forecast, by Vehicle Type
          • 8.5.6.2.3 Market size and forecast, by Range
          • 8.5.6.2.4 Market size and forecast, by Top Speed
        • 8.5.6.3 Africa
          • 8.5.6.3.1 Market size and forecast, by Product Type
          • 8.5.6.3.2 Market size and forecast, by Vehicle Type
          • 8.5.6.3.3 Market size and forecast, by Range
          • 8.5.6.3.4 Market size and forecast, by Top Speed
  • CHAPTER 9: COMPANY LANDSCAPE

    • 9.1. Introduction

    • 9.2. Top winning strategies

    • 9.3. Product Mapping of Top 10 Player

    • 9.4. Competitive Dashboard

    • 9.5. Competitive Heatmap

    • 9.6. Key developments

  • CHAPTER 10: COMPANY PROFILES

    • 10.1 AUDI AG

      • 10.1.1 Company overview

      • 10.1.2 Company snapshot

      • 10.1.3 Operating business segments

      • 10.1.4 Product portfolio

      • 10.1.5 Business performance

      • 10.1.6 Key strategic moves and developments

    • 10.2 BALLARD POWER SYSTEMS INC

      • 10.2.1 Company overview

      • 10.2.2 Company snapshot

      • 10.2.3 Operating business segments

      • 10.2.4 Product portfolio

      • 10.2.5 Business performance

      • 10.2.6 Key strategic moves and developments

    • 10.3 BMW GROUP

      • 10.3.1 Company overview

      • 10.3.2 Company snapshot

      • 10.3.3 Operating business segments

      • 10.3.4 Product portfolio

      • 10.3.5 Business performance

      • 10.3.6 Key strategic moves and developments

    • 10.4 DAIMLER AG

      • 10.4.1 Company overview

      • 10.4.2 Company snapshot

      • 10.4.3 Operating business segments

      • 10.4.4 Product portfolio

      • 10.4.5 Business performance

      • 10.4.6 Key strategic moves and developments

    • 10.5 Engineair Pty Ltd

      • 10.5.1 Company overview

      • 10.5.2 Company snapshot

      • 10.5.3 Operating business segments

      • 10.5.4 Product portfolio

      • 10.5.5 Business performance

      • 10.5.6 Key strategic moves and developments

    • 10.6 GENERAL MOTORS COMPANY

      • 10.6.1 Company overview

      • 10.6.2 Company snapshot

      • 10.6.3 Operating business segments

      • 10.6.4 Product portfolio

      • 10.6.5 Business performance

      • 10.6.6 Key strategic moves and developments

    • 10.7 Honda Motor Company, Ltd.

      • 10.7.1 Company overview

      • 10.7.2 Company snapshot

      • 10.7.3 Operating business segments

      • 10.7.4 Product portfolio

      • 10.7.5 Business performance

      • 10.7.6 Key strategic moves and developments

    • 10.8 HYUNDAI MOTOR GROUP

      • 10.8.1 Company overview

      • 10.8.2 Company snapshot

      • 10.8.3 Operating business segments

      • 10.8.4 Product portfolio

      • 10.8.5 Business performance

      • 10.8.6 Key strategic moves and developments

    • 10.9 Magnetic Air Car, Inc.

      • 10.9.1 Company overview

      • 10.9.2 Company snapshot

      • 10.9.3 Operating business segments

      • 10.9.4 Product portfolio

      • 10.9.5 Business performance

      • 10.9.6 Key strategic moves and developments

    • 10.10 MAN SE

      • 10.10.1 Company overview

      • 10.10.2 Company snapshot

      • 10.10.3 Operating business segments

      • 10.10.4 Product portfolio

      • 10.10.5 Business performance

      • 10.10.6 Key strategic moves and developments

    • 10.11 Matrix Comsec

      • 10.11.1 Company overview

      • 10.11.2 Company snapshot

      • 10.11.3 Operating business segments

      • 10.11.4 Product portfolio

      • 10.11.5 Business performance

      • 10.11.6 Key strategic moves and developments

    • 10.12 Motor development international SA

      • 10.12.1 Company overview

      • 10.12.2 Company snapshot

      • 10.12.3 Operating business segments

      • 10.12.4 Product portfolio

      • 10.12.5 Business performance

      • 10.12.6 Key strategic moves and developments

    • 10.13 Peugeot S.A.

      • 10.13.1 Company overview

      • 10.13.2 Company snapshot

      • 10.13.3 Operating business segments

      • 10.13.4 Product portfolio

      • 10.13.5 Business performance

      • 10.13.6 Key strategic moves and developments

    • 10.14 Phinergy

      • 10.14.1 Company overview

      • 10.14.2 Company snapshot

      • 10.14.3 Operating business segments

      • 10.14.4 Product portfolio

      • 10.14.5 Business performance

      • 10.14.6 Key strategic moves and developments

    • 10.15 Tata Motors Limited

      • 10.15.1 Company overview

      • 10.15.2 Company snapshot

      • 10.15.3 Operating business segments

      • 10.15.4 Product portfolio

      • 10.15.5 Business performance

      • 10.15.6 Key strategic moves and developments

    • 10.16 TOYOTA MOTOR CORPORATION

      • 10.16.1 Company overview

      • 10.16.2 Company snapshot

      • 10.16.3 Operating business segments

      • 10.16.4 Product portfolio

      • 10.16.5 Business performance

      • 10.16.6 Key strategic moves and developments

    • 10.17 VOLVO GROUP

      • 10.17.1 Company overview

      • 10.17.2 Company snapshot

      • 10.17.3 Operating business segments

      • 10.17.4 Product portfolio

      • 10.17.5 Business performance

      • 10.17.6 Key strategic moves and developments

  • LIST OF TABLES

  • TABLE 1. GLOBAL AIR POWERED VEHICLE MARKET, BY PRODUCT TYPE, 2025-2035 ($MILLION)
    TABLE 2. AIR POWERED VEHICLE MARKET SIZE, FOR SINGLE ENERGY MODE, BY REGION, 2025-2035 ($MILLION)
    TABLE 3. AIR POWERED VEHICLE MARKET FOR SINGLE ENERGY MODE, BY COUNTRY, 2025-2035 ($MILLION)
    TABLE 4. AIR POWERED VEHICLE MARKET SIZE, FOR DUAL ENERGY MODE, BY REGION, 2025-2035 ($MILLION)
    TABLE 5. AIR POWERED VEHICLE MARKET FOR DUAL ENERGY MODE, BY COUNTRY, 2025-2035 ($MILLION)
    TABLE 6. GLOBAL AIR POWERED VEHICLE MARKET, BY VEHICLE TYPE, 2025-2035 ($MILLION)
    TABLE 7. AIR POWERED VEHICLE MARKET SIZE, FOR PASSENGER VEHICLE, BY REGION, 2025-2035 ($MILLION)
    TABLE 8. AIR POWERED VEHICLE MARKET FOR PASSENGER VEHICLE, BY COUNTRY, 2025-2035 ($MILLION)
    TABLE 9. AIR POWERED VEHICLE MARKET SIZE, FOR COMMERCIAL VEHICLE, BY REGION, 2025-2035 ($MILLION)
    TABLE 10. AIR POWERED VEHICLE MARKET FOR COMMERCIAL VEHICLE, BY COUNTRY, 2025-2035 ($MILLION)
    TABLE 11. AIR POWERED VEHICLE MARKET SIZE, FOR MOTORCYCLES & SCOOTERS, BY REGION, 2025-2035 ($MILLION)
    TABLE 12. AIR POWERED VEHICLE MARKET FOR MOTORCYCLES & SCOOTERS, BY COUNTRY, 2025-2035 ($MILLION)
    TABLE 13. GLOBAL AIR POWERED VEHICLE MARKET, BY RANGE, 2025-2035 ($MILLION)
    TABLE 14. AIR POWERED VEHICLE MARKET SIZE, FOR LESS THAN 100 KM, BY REGION, 2025-2035 ($MILLION)
    TABLE 15. AIR POWERED VEHICLE MARKET FOR LESS THAN 100 KM, BY COUNTRY, 2025-2035 ($MILLION)
    TABLE 16. AIR POWERED VEHICLE MARKET SIZE, FOR 100-200 KM, BY REGION, 2025-2035 ($MILLION)
    TABLE 17. AIR POWERED VEHICLE MARKET FOR 100-200 KM, BY COUNTRY, 2025-2035 ($MILLION)
    TABLE 18. AIR POWERED VEHICLE MARKET SIZE, FOR MORE THAN 200 KM, BY REGION, 2025-2035 ($MILLION)
    TABLE 19. AIR POWERED VEHICLE MARKET FOR MORE THAN 200 KM, BY COUNTRY, 2025-2035 ($MILLION)
    TABLE 20. GLOBAL AIR POWERED VEHICLE MARKET, BY TOP SPEED, 2025-2035 ($MILLION)
    TABLE 21. AIR POWERED VEHICLE MARKET SIZE, FOR UP TO 100 KMPH, BY REGION, 2025-2035 ($MILLION)
    TABLE 22. AIR POWERED VEHICLE MARKET FOR UP TO 100 KMPH, BY COUNTRY, 2025-2035 ($MILLION)
    TABLE 23. AIR POWERED VEHICLE MARKET SIZE, FOR MORE THAN 100 KMPH, BY REGION, 2025-2035 ($MILLION)
    TABLE 24. AIR POWERED VEHICLE MARKET FOR MORE THAN 100 KMPH, BY COUNTRY, 2025-2035 ($MILLION)
    TABLE 25. AIR POWERED VEHICLE MARKET, BY REGION, 2025-2035 ($MILLION)
    TABLE 26. NORTH AMERICA AIR POWERED VEHICLE MARKET, BY PRODUCT TYPE, 2025-2035 ($MILLION)
    TABLE 27. NORTH AMERICA AIR POWERED VEHICLE MARKET, BY VEHICLE TYPE, 2025-2035 ($MILLION)
    TABLE 28. NORTH AMERICA AIR POWERED VEHICLE MARKET, BY RANGE, 2025-2035 ($MILLION)
    TABLE 29. NORTH AMERICA AIR POWERED VEHICLE MARKET, BY TOP SPEED, 2025-2035 ($MILLION)
    TABLE 30. NORTH AMERICA AIR POWERED VEHICLE MARKET, BY COUNTRY, 2025-2035 ($MILLION)
    TABLE 31. U.S. AIR POWERED VEHICLE MARKET, BY PRODUCT TYPE, 2025-2035 ($MILLION)
    TABLE 32. U.S. AIR POWERED VEHICLE MARKET, BY VEHICLE TYPE, 2025-2035 ($MILLION)
    TABLE 33. U.S. AIR POWERED VEHICLE MARKET, BY RANGE, 2025-2035 ($MILLION)
    TABLE 34. U.S. AIR POWERED VEHICLE MARKET, BY TOP SPEED, 2025-2035 ($MILLION)
    TABLE 35. CANADA AIR POWERED VEHICLE MARKET, BY PRODUCT TYPE, 2025-2035 ($MILLION)
    TABLE 36. CANADA AIR POWERED VEHICLE MARKET, BY VEHICLE TYPE, 2025-2035 ($MILLION)
    TABLE 37. CANADA AIR POWERED VEHICLE MARKET, BY RANGE, 2025-2035 ($MILLION)
    TABLE 38. CANADA AIR POWERED VEHICLE MARKET, BY TOP SPEED, 2025-2035 ($MILLION)
    TABLE 39. MEXICO AIR POWERED VEHICLE MARKET, BY PRODUCT TYPE, 2025-2035 ($MILLION)
    TABLE 40. MEXICO AIR POWERED VEHICLE MARKET, BY VEHICLE TYPE, 2025-2035 ($MILLION)
    TABLE 41. MEXICO AIR POWERED VEHICLE MARKET, BY RANGE, 2025-2035 ($MILLION)
    TABLE 42. MEXICO AIR POWERED VEHICLE MARKET, BY TOP SPEED, 2025-2035 ($MILLION)
    TABLE 43. EUROPE AIR POWERED VEHICLE MARKET, BY PRODUCT TYPE, 2025-2035 ($MILLION)
    TABLE 44. EUROPE AIR POWERED VEHICLE MARKET, BY VEHICLE TYPE, 2025-2035 ($MILLION)
    TABLE 45. EUROPE AIR POWERED VEHICLE MARKET, BY RANGE, 2025-2035 ($MILLION)
    TABLE 46. EUROPE AIR POWERED VEHICLE MARKET, BY TOP SPEED, 2025-2035 ($MILLION)
    TABLE 47. EUROPE AIR POWERED VEHICLE MARKET, BY COUNTRY, 2025-2035 ($MILLION)
    TABLE 48. U.K. AIR POWERED VEHICLE MARKET, BY PRODUCT TYPE, 2025-2035 ($MILLION)
    TABLE 49. U.K. AIR POWERED VEHICLE MARKET, BY VEHICLE TYPE, 2025-2035 ($MILLION)
    TABLE 50. U.K. AIR POWERED VEHICLE MARKET, BY RANGE, 2025-2035 ($MILLION)
    TABLE 51. U.K. AIR POWERED VEHICLE MARKET, BY TOP SPEED, 2025-2035 ($MILLION)
    TABLE 52. GERMANY AIR POWERED VEHICLE MARKET, BY PRODUCT TYPE, 2025-2035 ($MILLION)
    TABLE 53. GERMANY AIR POWERED VEHICLE MARKET, BY VEHICLE TYPE, 2025-2035 ($MILLION)
    TABLE 54. GERMANY AIR POWERED VEHICLE MARKET, BY RANGE, 2025-2035 ($MILLION)
    TABLE 55. GERMANY AIR POWERED VEHICLE MARKET, BY TOP SPEED, 2025-2035 ($MILLION)
    TABLE 56. FRANCE AIR POWERED VEHICLE MARKET, BY PRODUCT TYPE, 2025-2035 ($MILLION)
    TABLE 57. FRANCE AIR POWERED VEHICLE MARKET, BY VEHICLE TYPE, 2025-2035 ($MILLION)
    TABLE 58. FRANCE AIR POWERED VEHICLE MARKET, BY RANGE, 2025-2035 ($MILLION)
    TABLE 59. FRANCE AIR POWERED VEHICLE MARKET, BY TOP SPEED, 2025-2035 ($MILLION)
    TABLE 60. SPAIN AIR POWERED VEHICLE MARKET, BY PRODUCT TYPE, 2025-2035 ($MILLION)
    TABLE 61. SPAIN AIR POWERED VEHICLE MARKET, BY VEHICLE TYPE, 2025-2035 ($MILLION)
    TABLE 62. SPAIN AIR POWERED VEHICLE MARKET, BY RANGE, 2025-2035 ($MILLION)
    TABLE 63. SPAIN AIR POWERED VEHICLE MARKET, BY TOP SPEED, 2025-2035 ($MILLION)
    TABLE 64. NETHERLANDS AIR POWERED VEHICLE MARKET, BY PRODUCT TYPE, 2025-2035 ($MILLION)
    TABLE 65. NETHERLANDS AIR POWERED VEHICLE MARKET, BY VEHICLE TYPE, 2025-2035 ($MILLION)
    TABLE 66. NETHERLANDS AIR POWERED VEHICLE MARKET, BY RANGE, 2025-2035 ($MILLION)
    TABLE 67. NETHERLANDS AIR POWERED VEHICLE MARKET, BY TOP SPEED, 2025-2035 ($MILLION)
    TABLE 68. NORWAY AIR POWERED VEHICLE MARKET, BY PRODUCT TYPE, 2025-2035 ($MILLION)
    TABLE 69. NORWAY AIR POWERED VEHICLE MARKET, BY VEHICLE TYPE, 2025-2035 ($MILLION)
    TABLE 70. NORWAY AIR POWERED VEHICLE MARKET, BY RANGE, 2025-2035 ($MILLION)
    TABLE 71. NORWAY AIR POWERED VEHICLE MARKET, BY TOP SPEED, 2025-2035 ($MILLION)
    TABLE 72. REST OF EUROPE AIR POWERED VEHICLE MARKET, BY PRODUCT TYPE, 2025-2035 ($MILLION)
    TABLE 73. REST OF EUROPE AIR POWERED VEHICLE MARKET, BY VEHICLE TYPE, 2025-2035 ($MILLION)
    TABLE 74. REST OF EUROPE AIR POWERED VEHICLE MARKET, BY RANGE, 2025-2035 ($MILLION)
    TABLE 75. REST OF EUROPE AIR POWERED VEHICLE MARKET, BY TOP SPEED, 2025-2035 ($MILLION)
    TABLE 76. ASIA-PACIFIC AIR POWERED VEHICLE MARKET, BY PRODUCT TYPE, 2025-2035 ($MILLION)
    TABLE 77. ASIA-PACIFIC AIR POWERED VEHICLE MARKET, BY VEHICLE TYPE, 2025-2035 ($MILLION)
    TABLE 78. ASIA-PACIFIC AIR POWERED VEHICLE MARKET, BY RANGE, 2025-2035 ($MILLION)
    TABLE 79. ASIA-PACIFIC AIR POWERED VEHICLE MARKET, BY TOP SPEED, 2025-2035 ($MILLION)
    TABLE 80. ASIA-PACIFIC AIR POWERED VEHICLE MARKET, BY COUNTRY, 2025-2035 ($MILLION)
    TABLE 81. CHINA AIR POWERED VEHICLE MARKET, BY PRODUCT TYPE, 2025-2035 ($MILLION)
    TABLE 82. CHINA AIR POWERED VEHICLE MARKET, BY VEHICLE TYPE, 2025-2035 ($MILLION)
    TABLE 83. CHINA AIR POWERED VEHICLE MARKET, BY RANGE, 2025-2035 ($MILLION)
    TABLE 84. CHINA AIR POWERED VEHICLE MARKET, BY TOP SPEED, 2025-2035 ($MILLION)
    TABLE 85. JAPAN AIR POWERED VEHICLE MARKET, BY PRODUCT TYPE, 2025-2035 ($MILLION)
    TABLE 86. JAPAN AIR POWERED VEHICLE MARKET, BY VEHICLE TYPE, 2025-2035 ($MILLION)
    TABLE 87. JAPAN AIR POWERED VEHICLE MARKET, BY RANGE, 2025-2035 ($MILLION)
    TABLE 88. JAPAN AIR POWERED VEHICLE MARKET, BY TOP SPEED, 2025-2035 ($MILLION)
    TABLE 89. INDIA AIR POWERED VEHICLE MARKET, BY PRODUCT TYPE, 2025-2035 ($MILLION)
    TABLE 90. INDIA AIR POWERED VEHICLE MARKET, BY VEHICLE TYPE, 2025-2035 ($MILLION)
    TABLE 91. INDIA AIR POWERED VEHICLE MARKET, BY RANGE, 2025-2035 ($MILLION)
    TABLE 92. INDIA AIR POWERED VEHICLE MARKET, BY TOP SPEED, 2025-2035 ($MILLION)
    TABLE 93. AUSTRALIA AIR POWERED VEHICLE MARKET, BY PRODUCT TYPE, 2025-2035 ($MILLION)
    TABLE 94. AUSTRALIA AIR POWERED VEHICLE MARKET, BY VEHICLE TYPE, 2025-2035 ($MILLION)
    TABLE 95. AUSTRALIA AIR POWERED VEHICLE MARKET, BY RANGE, 2025-2035 ($MILLION)
    TABLE 96. AUSTRALIA AIR POWERED VEHICLE MARKET, BY TOP SPEED, 2025-2035 ($MILLION)
    TABLE 97. SOUTH KOREA AIR POWERED VEHICLE MARKET, BY PRODUCT TYPE, 2025-2035 ($MILLION)
    TABLE 98. SOUTH KOREA AIR POWERED VEHICLE MARKET, BY VEHICLE TYPE, 2025-2035 ($MILLION)
    TABLE 99. SOUTH KOREA AIR POWERED VEHICLE MARKET, BY RANGE, 2025-2035 ($MILLION)
    TABLE 100. SOUTH KOREA AIR POWERED VEHICLE MARKET, BY TOP SPEED, 2025-2035 ($MILLION)
    TABLE 101. SINGAPORE AIR POWERED VEHICLE MARKET, BY PRODUCT TYPE, 2025-2035 ($MILLION)
    TABLE 102. SINGAPORE AIR POWERED VEHICLE MARKET, BY VEHICLE TYPE, 2025-2035 ($MILLION)
    TABLE 103. SINGAPORE AIR POWERED VEHICLE MARKET, BY RANGE, 2025-2035 ($MILLION)
    TABLE 104. SINGAPORE AIR POWERED VEHICLE MARKET, BY TOP SPEED, 2025-2035 ($MILLION)
    TABLE 105. REST OF ASIA-PACIFIC AIR POWERED VEHICLE MARKET, BY PRODUCT TYPE, 2025-2035 ($MILLION)
    TABLE 106. REST OF ASIA-PACIFIC AIR POWERED VEHICLE MARKET, BY VEHICLE TYPE, 2025-2035 ($MILLION)
    TABLE 107. REST OF ASIA-PACIFIC AIR POWERED VEHICLE MARKET, BY RANGE, 2025-2035 ($MILLION)
    TABLE 108. REST OF ASIA-PACIFIC AIR POWERED VEHICLE MARKET, BY TOP SPEED, 2025-2035 ($MILLION)
    TABLE 109. LAMEA AIR POWERED VEHICLE MARKET, BY PRODUCT TYPE, 2025-2035 ($MILLION)
    TABLE 110. LAMEA AIR POWERED VEHICLE MARKET, BY VEHICLE TYPE, 2025-2035 ($MILLION)
    TABLE 111. LAMEA AIR POWERED VEHICLE MARKET, BY RANGE, 2025-2035 ($MILLION)
    TABLE 112. LAMEA AIR POWERED VEHICLE MARKET, BY TOP SPEED, 2025-2035 ($MILLION)
    TABLE 113. LAMEA AIR POWERED VEHICLE MARKET, BY COUNTRY, 2025-2035 ($MILLION)
    TABLE 114. LATIN AMERICA AIR POWERED VEHICLE MARKET, BY PRODUCT TYPE, 2025-2035 ($MILLION)
    TABLE 115. LATIN AMERICA AIR POWERED VEHICLE MARKET, BY VEHICLE TYPE, 2025-2035 ($MILLION)
    TABLE 116. LATIN AMERICA AIR POWERED VEHICLE MARKET, BY RANGE, 2025-2035 ($MILLION)
    TABLE 117. LATIN AMERICA AIR POWERED VEHICLE MARKET, BY TOP SPEED, 2025-2035 ($MILLION)
    TABLE 118. MIDDLE EAST AIR POWERED VEHICLE MARKET, BY PRODUCT TYPE, 2025-2035 ($MILLION)
    TABLE 119. MIDDLE EAST AIR POWERED VEHICLE MARKET, BY VEHICLE TYPE, 2025-2035 ($MILLION)
    TABLE 120. MIDDLE EAST AIR POWERED VEHICLE MARKET, BY RANGE, 2025-2035 ($MILLION)
    TABLE 121. MIDDLE EAST AIR POWERED VEHICLE MARKET, BY TOP SPEED, 2025-2035 ($MILLION)
    TABLE 122. AFRICA AIR POWERED VEHICLE MARKET, BY PRODUCT TYPE, 2025-2035 ($MILLION)
    TABLE 123. AFRICA AIR POWERED VEHICLE MARKET, BY VEHICLE TYPE, 2025-2035 ($MILLION)
    TABLE 124. AFRICA AIR POWERED VEHICLE MARKET, BY RANGE, 2025-2035 ($MILLION)
    TABLE 125. AFRICA AIR POWERED VEHICLE MARKET, BY TOP SPEED, 2025-2035 ($MILLION)
    TABLE 126.AUDI AG: COMPANY SNAPSHOT
    TABLE 127.AUDI AG: OPERATING SEGMENTS
    TABLE 128.AUDI AG: PRODUCT PORTFOLIO
    TABLE 129.AUDI AG: NET SALES,
    TABLE 130.AUDI AG: KEY STRATERGIES
    TABLE 131.BALLARD POWER SYSTEMS INC: COMPANY SNAPSHOT
    TABLE 132.BALLARD POWER SYSTEMS INC: OPERATING SEGMENTS
    TABLE 133.BALLARD POWER SYSTEMS INC: PRODUCT PORTFOLIO
    TABLE 134.BALLARD POWER SYSTEMS INC: NET SALES,
    TABLE 135.BALLARD POWER SYSTEMS INC: KEY STRATERGIES
    TABLE 136.BMW GROUP: COMPANY SNAPSHOT
    TABLE 137.BMW GROUP: OPERATING SEGMENTS
    TABLE 138.BMW GROUP: PRODUCT PORTFOLIO
    TABLE 139.BMW GROUP: NET SALES,
    TABLE 140.BMW GROUP: KEY STRATERGIES
    TABLE 141.DAIMLER AG: COMPANY SNAPSHOT
    TABLE 142.DAIMLER AG: OPERATING SEGMENTS
    TABLE 143.DAIMLER AG: PRODUCT PORTFOLIO
    TABLE 144.DAIMLER AG: NET SALES,
    TABLE 145.DAIMLER AG: KEY STRATERGIES
    TABLE 146.ENGINEAIR PTY LTD: COMPANY SNAPSHOT
    TABLE 147.ENGINEAIR PTY LTD: OPERATING SEGMENTS
    TABLE 148.ENGINEAIR PTY LTD: PRODUCT PORTFOLIO
    TABLE 149.ENGINEAIR PTY LTD: NET SALES,
    TABLE 150.ENGINEAIR PTY LTD: KEY STRATERGIES
    TABLE 151.GENERAL MOTORS COMPANY: COMPANY SNAPSHOT
    TABLE 152.GENERAL MOTORS COMPANY: OPERATING SEGMENTS
    TABLE 153.GENERAL MOTORS COMPANY: PRODUCT PORTFOLIO
    TABLE 154.GENERAL MOTORS COMPANY: NET SALES,
    TABLE 155.GENERAL MOTORS COMPANY: KEY STRATERGIES
    TABLE 156.HONDA MOTOR COMPANY, LTD.: COMPANY SNAPSHOT
    TABLE 157.HONDA MOTOR COMPANY, LTD.: OPERATING SEGMENTS
    TABLE 158.HONDA MOTOR COMPANY, LTD.: PRODUCT PORTFOLIO
    TABLE 159.HONDA MOTOR COMPANY, LTD.: NET SALES,
    TABLE 160.HONDA MOTOR COMPANY, LTD.: KEY STRATERGIES
    TABLE 161.HYUNDAI MOTOR GROUP: COMPANY SNAPSHOT
    TABLE 162.HYUNDAI MOTOR GROUP: OPERATING SEGMENTS
    TABLE 163.HYUNDAI MOTOR GROUP: PRODUCT PORTFOLIO
    TABLE 164.HYUNDAI MOTOR GROUP: NET SALES,
    TABLE 165.HYUNDAI MOTOR GROUP: KEY STRATERGIES
    TABLE 166.MAGNETIC AIR CAR, INC.: COMPANY SNAPSHOT
    TABLE 167.MAGNETIC AIR CAR, INC.: OPERATING SEGMENTS
    TABLE 168.MAGNETIC AIR CAR, INC.: PRODUCT PORTFOLIO
    TABLE 169.MAGNETIC AIR CAR, INC.: NET SALES,
    TABLE 170.MAGNETIC AIR CAR, INC.: KEY STRATERGIES
    TABLE 171.MAN SE: COMPANY SNAPSHOT
    TABLE 172.MAN SE: OPERATING SEGMENTS
    TABLE 173.MAN SE: PRODUCT PORTFOLIO
    TABLE 174.MAN SE: NET SALES,
    TABLE 175.MAN SE: KEY STRATERGIES
    TABLE 176.MATRIX COMSEC: COMPANY SNAPSHOT
    TABLE 177.MATRIX COMSEC: OPERATING SEGMENTS
    TABLE 178.MATRIX COMSEC: PRODUCT PORTFOLIO
    TABLE 179.MATRIX COMSEC: NET SALES,
    TABLE 180.MATRIX COMSEC: KEY STRATERGIES
    TABLE 181.MOTOR DEVELOPMENT INTERNATIONAL SA: COMPANY SNAPSHOT
    TABLE 182.MOTOR DEVELOPMENT INTERNATIONAL SA: OPERATING SEGMENTS
    TABLE 183.MOTOR DEVELOPMENT INTERNATIONAL SA: PRODUCT PORTFOLIO
    TABLE 184.MOTOR DEVELOPMENT INTERNATIONAL SA: NET SALES,
    TABLE 185.MOTOR DEVELOPMENT INTERNATIONAL SA: KEY STRATERGIES
    TABLE 186.PEUGEOT S.A.: COMPANY SNAPSHOT
    TABLE 187.PEUGEOT S.A.: OPERATING SEGMENTS
    TABLE 188.PEUGEOT S.A.: PRODUCT PORTFOLIO
    TABLE 189.PEUGEOT S.A.: NET SALES,
    TABLE 190.PEUGEOT S.A.: KEY STRATERGIES
    TABLE 191.PHINERGY: COMPANY SNAPSHOT
    TABLE 192.PHINERGY: OPERATING SEGMENTS
    TABLE 193.PHINERGY: PRODUCT PORTFOLIO
    TABLE 194.PHINERGY: NET SALES,
    TABLE 195.PHINERGY: KEY STRATERGIES
    TABLE 196.TATA MOTORS LIMITED: COMPANY SNAPSHOT
    TABLE 197.TATA MOTORS LIMITED: OPERATING SEGMENTS
    TABLE 198.TATA MOTORS LIMITED: PRODUCT PORTFOLIO
    TABLE 199.TATA MOTORS LIMITED: NET SALES,
    TABLE 200.TATA MOTORS LIMITED: KEY STRATERGIES
    TABLE 201.TOYOTA MOTOR CORPORATION: COMPANY SNAPSHOT
    TABLE 202.TOYOTA MOTOR CORPORATION: OPERATING SEGMENTS
    TABLE 203.TOYOTA MOTOR CORPORATION: PRODUCT PORTFOLIO
    TABLE 204.TOYOTA MOTOR CORPORATION: NET SALES,
    TABLE 205.TOYOTA MOTOR CORPORATION: KEY STRATERGIES
    TABLE 206.VOLVO GROUP: COMPANY SNAPSHOT
    TABLE 207.VOLVO GROUP: OPERATING SEGMENTS
    TABLE 208.VOLVO GROUP: PRODUCT PORTFOLIO
    TABLE 209.VOLVO GROUP: NET SALES,
    TABLE 210.VOLVO GROUP: KEY STRATERGIES
  • LIST OF FIGURES

  • FIGURE 1.AIR POWERED VEHICLE MARKET SEGMENTATION
    FIGURE 2.AIR POWERED VEHICLE MARKET,2025-2035
    FIGURE 3.AIR POWERED VEHICLE MARKET,2025-2035
    FIGURE 4. TOP INVESTMENT POCKETS, BY REGION
    FIGURE 5.PORTER FIVE-1
    FIGURE 6.PORTER FIVE-2
    FIGURE 7.PORTER FIVE-3
    FIGURE 8.PORTER FIVE-4
    FIGURE 9.PORTER FIVE-5
    FIGURE 10.TOP PLAYER POSITIONING
    FIGURE 11.AIR POWERED VEHICLE MARKET:DRIVERS, RESTRAINTS AND OPPORTUNITIES
    FIGURE 12.AIR POWERED VEHICLE MARKET,BY PRODUCT TYPE,2025(%)
    FIGURE 13.COMPARATIVE SHARE ANALYSIS OF SINGLE ENERGY MODE AIR POWERED VEHICLE MARKET,2025-2035(%)
    FIGURE 14.COMPARATIVE SHARE ANALYSIS OF DUAL ENERGY MODE AIR POWERED VEHICLE MARKET,2025-2035(%)
    FIGURE 15.AIR POWERED VEHICLE MARKET,BY VEHICLE TYPE,2025(%)
    FIGURE 16.COMPARATIVE SHARE ANALYSIS OF PASSENGER VEHICLE AIR POWERED VEHICLE MARKET,2025-2035(%)
    FIGURE 17.COMPARATIVE SHARE ANALYSIS OF COMMERCIAL VEHICLE AIR POWERED VEHICLE MARKET,2025-2035(%)
    FIGURE 18.COMPARATIVE SHARE ANALYSIS OF MOTORCYCLES & SCOOTERS AIR POWERED VEHICLE MARKET,2025-2035(%)
    FIGURE 19.AIR POWERED VEHICLE MARKET,BY RANGE,2025(%)
    FIGURE 20.COMPARATIVE SHARE ANALYSIS OF LESS THAN 100 KM AIR POWERED VEHICLE MARKET,2025-2035(%)
    FIGURE 21.COMPARATIVE SHARE ANALYSIS OF 100-200 KM AIR POWERED VEHICLE MARKET,2025-2035(%)
    FIGURE 22.COMPARATIVE SHARE ANALYSIS OF MORE THAN 200 KM AIR POWERED VEHICLE MARKET,2025-2035(%)
    FIGURE 23.AIR POWERED VEHICLE MARKET,BY TOP SPEED,2025(%)
    FIGURE 24.COMPARATIVE SHARE ANALYSIS OF UP TO 100 KMPH AIR POWERED VEHICLE MARKET,2025-2035(%)
    FIGURE 25.COMPARATIVE SHARE ANALYSIS OF MORE THAN 100 KMPH AIR POWERED VEHICLE MARKET,2025-2035(%)
    FIGURE 26.AIR POWERED VEHICLE MARKET BY REGION,2025
    FIGURE 27.U.S. AIR POWERED VEHICLE MARKET,2025-2035($MILLION)
    FIGURE 28.CANADA AIR POWERED VEHICLE MARKET,2025-2035($MILLION)
    FIGURE 29.MEXICO AIR POWERED VEHICLE MARKET,2025-2035($MILLION)
    FIGURE 30.U.K. AIR POWERED VEHICLE MARKET,2025-2035($MILLION)
    FIGURE 31.GERMANY AIR POWERED VEHICLE MARKET,2025-2035($MILLION)
    FIGURE 32.FRANCE AIR POWERED VEHICLE MARKET,2025-2035($MILLION)
    FIGURE 33.SPAIN AIR POWERED VEHICLE MARKET,2025-2035($MILLION)
    FIGURE 34.NETHERLANDS AIR POWERED VEHICLE MARKET,2025-2035($MILLION)
    FIGURE 35.NORWAY AIR POWERED VEHICLE MARKET,2025-2035($MILLION)
    FIGURE 36.REST OF EUROPE AIR POWERED VEHICLE MARKET,2025-2035($MILLION)
    FIGURE 37.CHINA AIR POWERED VEHICLE MARKET,2025-2035($MILLION)
    FIGURE 38.JAPAN AIR POWERED VEHICLE MARKET,2025-2035($MILLION)
    FIGURE 39.INDIA AIR POWERED VEHICLE MARKET,2025-2035($MILLION)
    FIGURE 40.AUSTRALIA AIR POWERED VEHICLE MARKET,2025-2035($MILLION)
    FIGURE 41.SOUTH KOREA AIR POWERED VEHICLE MARKET,2025-2035($MILLION)
    FIGURE 42.SINGAPORE AIR POWERED VEHICLE MARKET,2025-2035($MILLION)
    FIGURE 43.REST OF ASIA-PACIFIC AIR POWERED VEHICLE MARKET,2025-2035($MILLION)
    FIGURE 44.LATIN AMERICA AIR POWERED VEHICLE MARKET,2025-2035($MILLION)
    FIGURE 45.MIDDLE EAST AIR POWERED VEHICLE MARKET,2025-2035($MILLION)
    FIGURE 46.AFRICA AIR POWERED VEHICLE MARKET,2025-2035($MILLION)
    FIGURE 47. TOP WINNING STRATEGIES, BY YEAR
    FIGURE 48. TOP WINNING STRATEGIES, BY DEVELOPMENT
    FIGURE 49. TOP WINNING STRATEGIES, BY COMPANY
    FIGURE 50.PRODUCT MAPPING OF TOP 10 PLAYERS
    FIGURE 51.COMPETITIVE DASHBOARD
    FIGURE 52.COMPETITIVE HEATMAP OF TOP 10 KEY PLAYERS
    FIGURE 53.AUDI AG.: NET SALES ,($MILLION)
    FIGURE 54.BALLARD POWER SYSTEMS INC.: NET SALES ,($MILLION)
    FIGURE 55.BMW GROUP.: NET SALES ,($MILLION)
    FIGURE 56.DAIMLER AG.: NET SALES ,($MILLION)
    FIGURE 57.ENGINEAIR PTY LTD.: NET SALES ,($MILLION)
    FIGURE 58.GENERAL MOTORS COMPANY.: NET SALES ,($MILLION)
    FIGURE 59.HONDA MOTOR COMPANY, LTD..: NET SALES ,($MILLION)
    FIGURE 60.HYUNDAI MOTOR GROUP.: NET SALES ,($MILLION)
    FIGURE 61.MAGNETIC AIR CAR, INC..: NET SALES ,($MILLION)
    FIGURE 62.MAN SE.: NET SALES ,($MILLION)
    FIGURE 63.MATRIX COMSEC.: NET SALES ,($MILLION)
    FIGURE 64.MOTOR DEVELOPMENT INTERNATIONAL SA.: NET SALES ,($MILLION)
    FIGURE 65.PEUGEOT S.A..: NET SALES ,($MILLION)
    FIGURE 66.PHINERGY.: NET SALES ,($MILLION)
    FIGURE 67.TATA MOTORS LIMITED.: NET SALES ,($MILLION)
    FIGURE 68.TOYOTA MOTOR CORPORATION.: NET SALES ,($MILLION)
    FIGURE 69.VOLVO GROUP.: NET SALES ,($MILLION)


This section provides the opinions of various top-level CXOs in the global air powered vehicle market. The market is expected to witness a steady growth due to stringent vehicle emission norms and an increase in the demand for fuel-efficient & low-emission vehicles. The market in the developed countries, such as the U.S., Canada, Mexico, and Germany, is projected to report a slower growth rate as compared to the developing regions, such as India, South Africa, and the Middle East, owing to rapid industrialization and high sales of vehicles in the developed region. Meanwhile, to support sustainable development, it is important to develop and use alternative sources of fuel. This involves use of environment friendly vehicles such as electric mobility & air powered vehicles, which do not use gas and are more economical than conventional vehicles. 

In addition, several government initiatives related to the environmental protection have also promoted the demand for all air powered vehicles in the various countries. For instance, the U.S. Environmental Protection Agency (EPA) announced that they are working on new rules to decrease emissions of nitrogen oxide (NOx) and other pollutants from heavy-duty trucks. Also, the agency finalized federal greenhouse gas (GHG) emissions standards for passenger cars and light trucks in the US through 2026. Moreover, various companies are investing in the research and development of the air powered vehicle owing to its advantages. For instance, the Luxembourg-based company MDI has come a long way in its development and pledges to launch the zero-emission AirPod 2.0 soon.  

The market growth is supplemented by factors such as increasing awareness of environment friendly vehicles, stringent government norms and emission standards to reduce carbon footprints, and rising fuel prices supplement the growth of the air powered vehicle market. However, low speed of air powered vehicles and increasing adoption of battery electric vehicles (BEVs) & hybrid electric vehicles (HEVs) are the factors expected to hamper the growth of the air powered vehicle market. In addition, increasing research and development in air powered vehicles and rise in demand for air hybrid vehicles creates market opportunities for the key players operating in the air powered vehicle market.

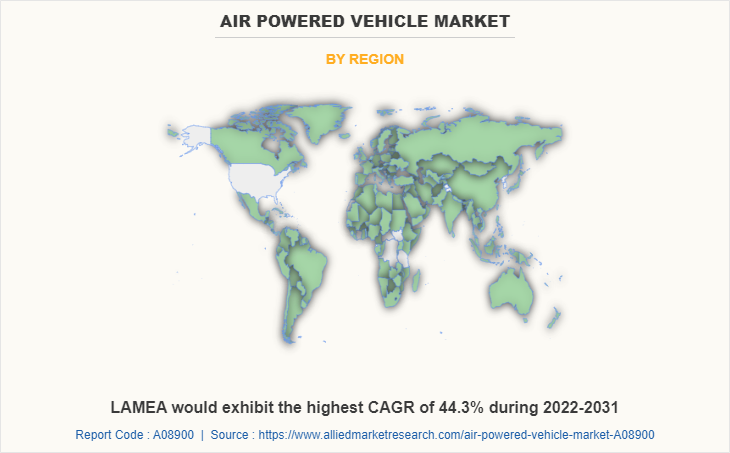
Among the analyzed regions, Asia-Pacific is the highest revenue contributor, followed by Europe, North America, and LAMEA. On the basis of forecast analysis, LAMEA is expected to lead during the forecast period, due to rise in demand for automation and technological advancement in the automobile industry.

PURCHASE OPTIONS

Call or Email us

U.S.-Canada Toll-free: +1-800-792-5285
Int'l : +1-503-894-6022
Europe : +44-845-528-1300
Email : help@alliedmarketresearch.com
 
FREQUENTLY ASKED QUESTIONS?

A. Increased use of single energy mode & dual energy mode are the upcoming trends of Air Powered Vehicle Market in the world

A. Increased use of air powered vehicle as passenger vehicle is the leading application of Air Powered Vehicle Market

A. Asia-Pacific is the largest regional market for Air Powered Vehicle

A. The global air powered vehicle market is projected to be valued at $339.4 million in 2025, and is expected to reach at $8,692.5 million by 2035, registering a CAGR of 38.3% from 2025 to 2035

A. The leading players operating in the air powered vehicle market are AB Volvo, Audi AG, Ballard Power Systems, BMW AG, Engineair Pty Ltd., General Motors, Honda Motor Co., Ltd., Hyundai Motor Company, Man SE, Mercedes-Benz Group AG, Motor Development International SA, Peugeot S.A., Phinergy, Suzuki Motor Corporation, Tata Motors, Toyota Motor Corporation, and Volkswagen AG.

Looking for Customization?

 Customization Request

Have a Question?

 Speak with Analyst

Any Confusion?

 Inquire Before Buying

Have a glance of the Report

  Request Sample
RELATED TAGS

Purchase Full Report of
Air Powered Vehicle Market

Start reading instantly.
This Report and over 66,905+ more Reports, Available with Avenue Library. T&C*.

  • Online Only
  • $3,570
  • Online cloud access only
  • Restricted print, copy, paste & download
  • Read only
  • Free industry update
    (Within 180 days)
  • Free report update in next update cycle
    (Aug 2023 - Aug 2024)
  • Data Pack
  • $3,840
  • Restricted to one authorized user
  • One print only
  • Available in
    Excel
  • Free industry update
    (Within 180 days)
  •   Free report update in next update cycle
    (Aug 2023 - Aug 2024)
  • Single User
  • $5,820
  • Restricted to one authorized user
  • One print only
  • Available in
    PDF
  • Free industry update
    (Within 180 days)
  •   Free report update in next update cycle
    (Aug 2023 - Aug 2024)
  • Five Users
  • $6,450
  • Limited to five authorized users
  • Print upto five copies
  • Available in
    PDF
  • Free industry update
    (Within 180 days)
  •   Free report update in next update cycle
    (Aug 2023 - Aug 2024)
  • Enterprise
    License/PDF

  • $9,600
  • Unlimited
    within
    company/enterprise
  • Available in Excel & PDF
  • Free industry update
    (Within 180 days)
  •   Free report update in next update cycle
    (Aug 2023 - Aug 2024)
  • Library
    Membership

  • $999 $ 1,175
    Per User/ Per month/ Billed annually
  • Published Content
    E-access
  • Company Profiles
    E-access
  • Newly Added Content Access
  • 10 PDF
    Downloads
  • 5 Excel Data
    Pack Downloads
  • 250 Company Profiles PDF Downloads
  • Buy Now

*Taxes/Fees, if applicable will be added during checkout. All prices in USD

RELATED REPORTS
 

Why Allied Market Research?


Infallible Methodology

To ensure high-level data integrity, accurate analysis, and impeccable forecasts

Analyst Support

For complete satisfaction

Customization

On-demand customization of scope of the report to exactly meet your needs

TARGETED MARKET VIEW

Targeted market view to provide pertinent information and save time of readers

Get fresh content delivered

Get insights on topics that are crucial for your business. Stay abreast of your interest areas.

Get Industry Data Alerts

Why Allied Market Research?

Infallible Methodology

To ensure high-level data integrity, accurate analysis, and impeccable forecasts

Analyst Support

For complete satisfaction

Customization

On-demand customization of scope of the report to exactly meet your needs

TARGETED MARKET VIEW

Targeted market view to provide pertinent information and save time of readers